Are We … So Back?

DISCLAIMER: This note is intended for US recipients only and, in particular, is not directed at, nor intended to be relied upon by any UK recipients. Any information or analysis in this note is not an offer to sell or the solicitation of an offer to buy any securities. Nothing in this note is intended to be investment advice and nor should it be relied upon to make investment decisions. Read our full disclaimer, here.
Analysis by Alex King, CEO, Cestrian Capital Research, Inc.
In news that is big only to people with very narrow fields of interest, the S&P500 crossed up and over its 21-day EMA two days ago and put in two daily closes above it. So on that measure, we can declare the last few days’ correction all done and dusted. Life is rarely that simple of course, so let’s get into it in detail.
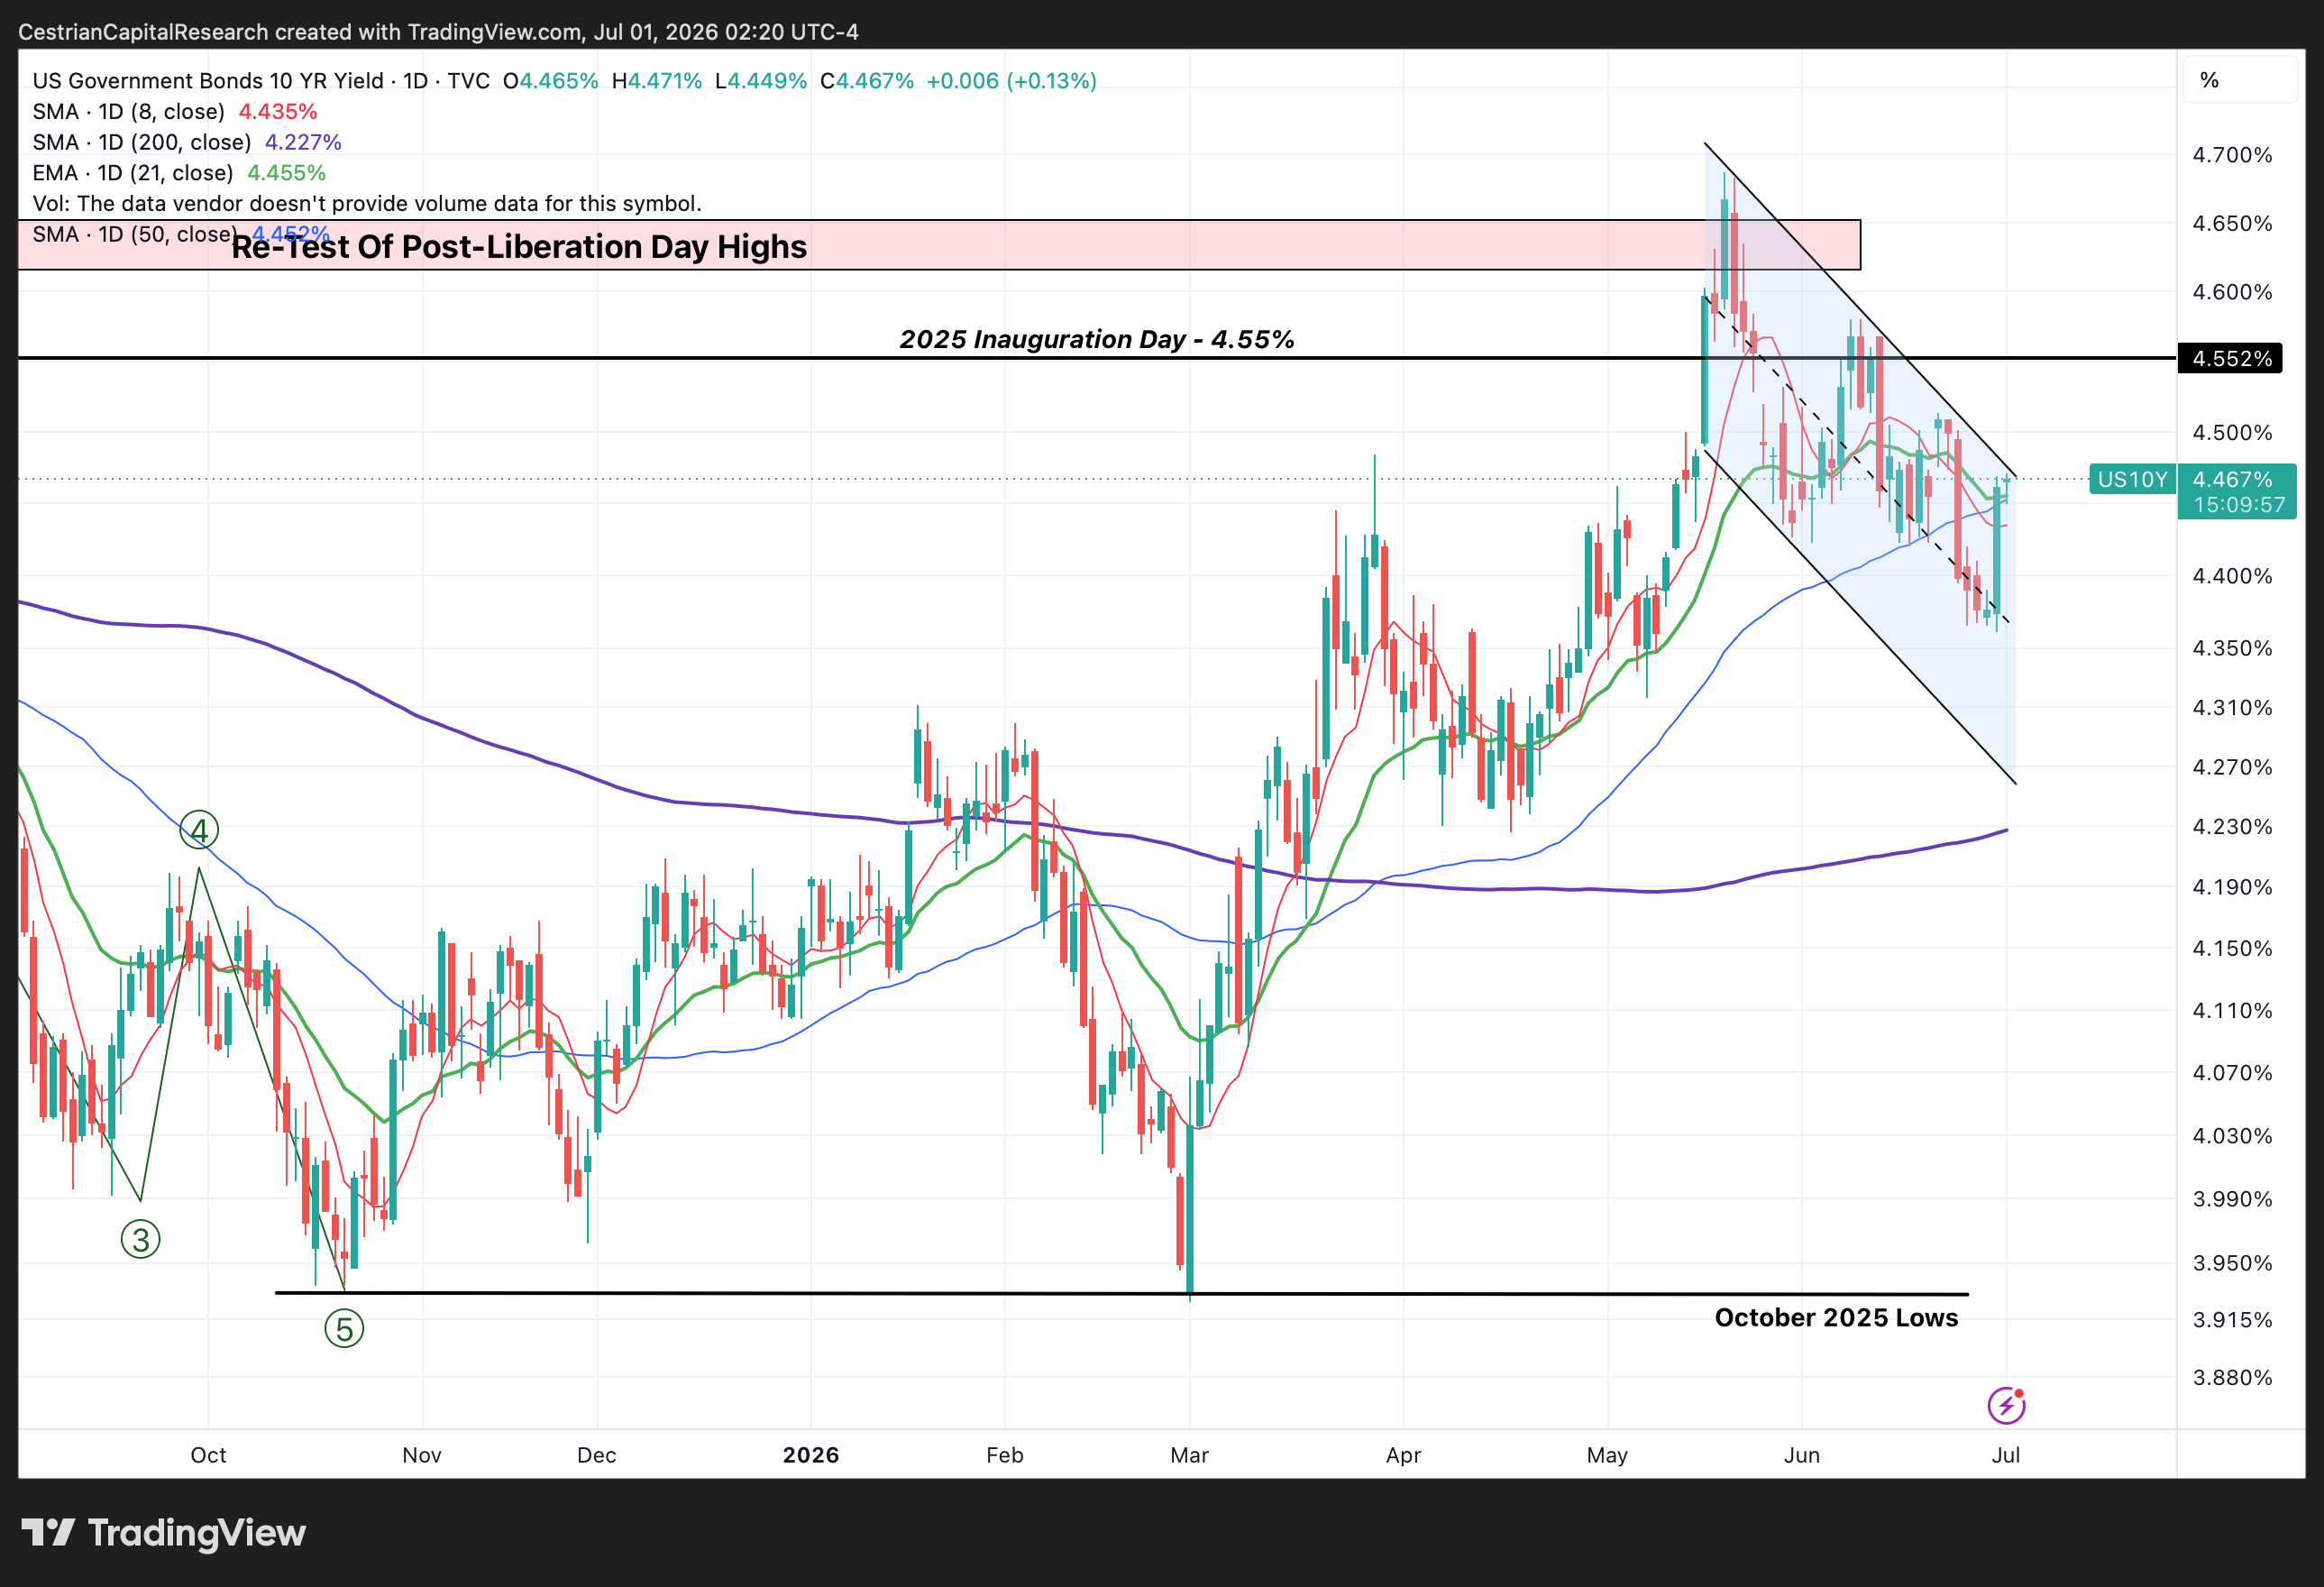
US Government Bond Outlook
The 10yr is testing the upper bound of the downward channel it has formed in recent weeks. I think resistance will hold and that the larger-degree fall in yields will continue.
Reminder - how to get the machine to do your work in bonds for you:
Everyone ignores bonds, because they have been in a long downtrend since the Covid spike highs. This means, in my view, that folks will miss the opportunity to make money on the long side. The opportunity to do so is becoming real. You can use our quantitative algo service, SignalFlow For Bond ETFs, which rotates between TLT and other U.S. bond ETFs, failing over to cash when bonds look weak, to help you win. Read more here and here.
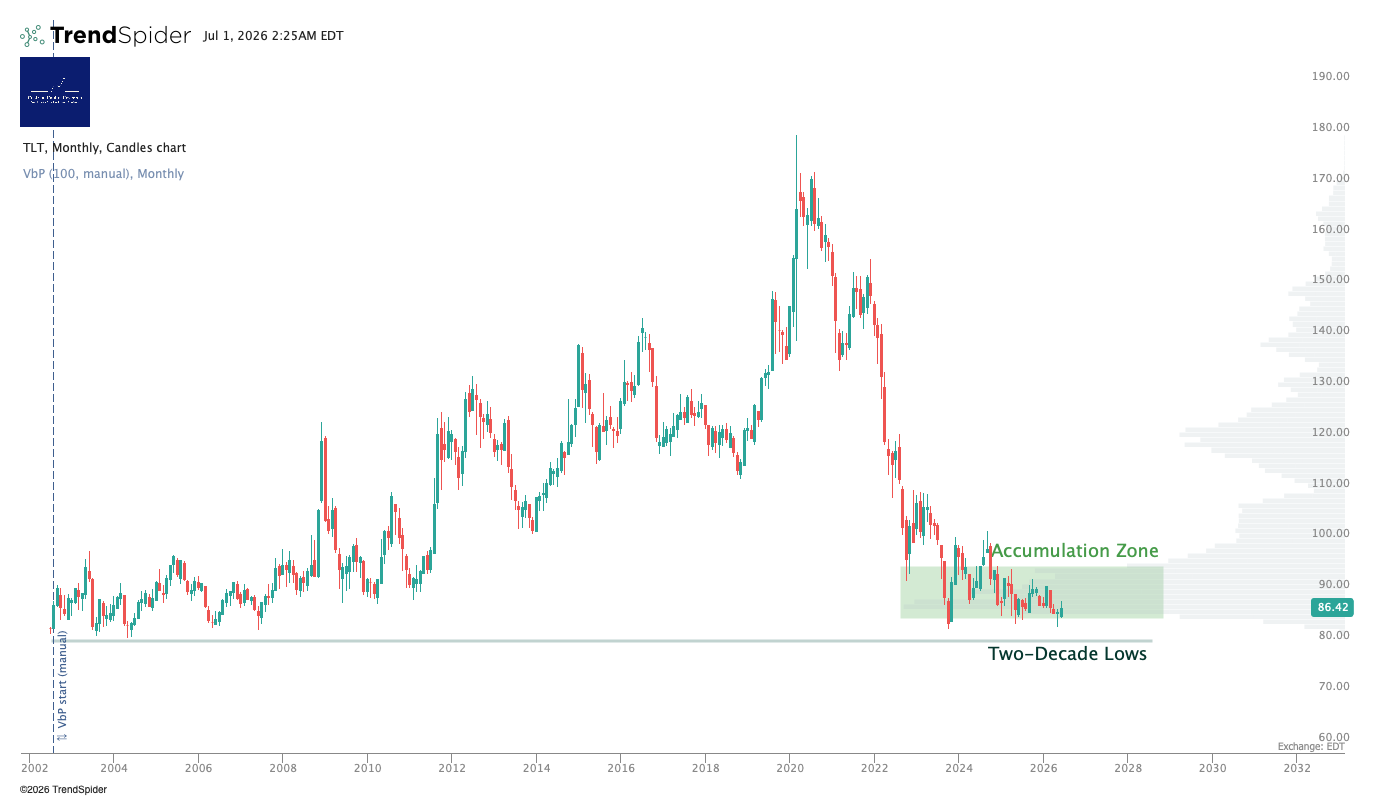
Longer-Term Treasury Bonds (TLT / TMF)
I’m aware of just how dull this chart is. But it is important to realize just how beaten-up US bonds are. I do not expect this to be a permanent situation.