
In Oil, Price x Volume Foretells Reality, Again. No Paywall.

DISCLAIMER: This note is intended for US recipients only and, in particular, is not directed at, nor intended to be relied upon by any UK recipients. Any information or analysis in this note is not an offer to sell or the solicitation of an offer to buy any securities. Nothing in this note is intended to be investment advice and nor should it be relied upon to make investment decisions. Read our full disclaimer, here.
Analysis by Alex King, CEO, Cestrian Capital Research, Inc.
A long time ago when I was in short trousers and thought that the world ran on rails and the Hollywood version of reality bore at least some relation to reality, I also thought that the news involved things that were, you know, new. As in, things that were generally new ie. news to a lot of people. Now that I am old, wizened and grizzled I know that the news is only news to the plebs. And, worse, that to quote an old friend, “nothing appears in the news unless someone wants it to”. Said friend worked in PR for most of his career, so he should know.
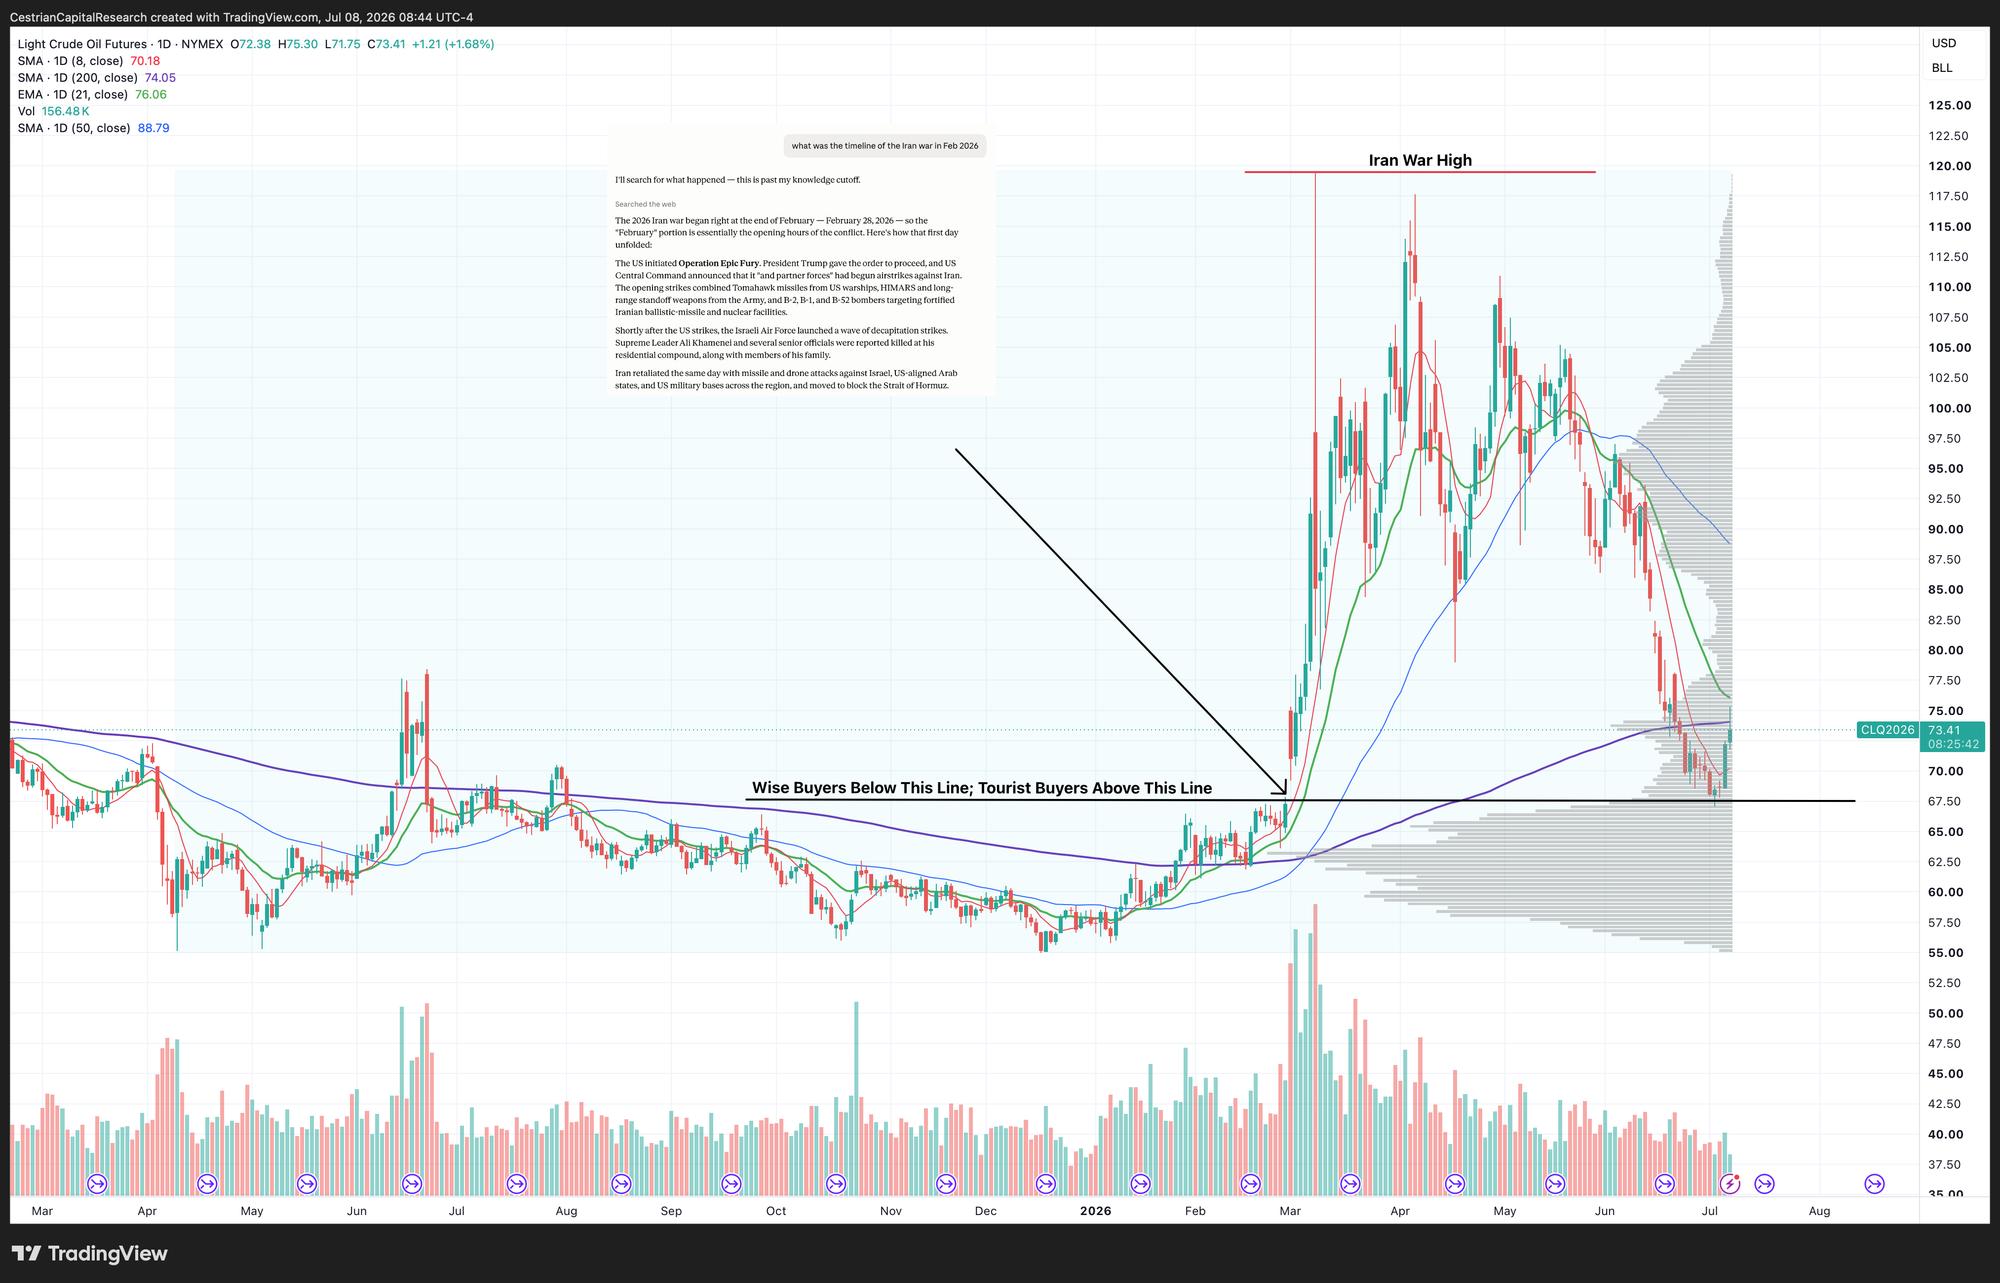
Once you realize this, it becomes a tremendous advantage in your investing and trading. For instance, if you thought that you should take a long oil position in recent weeks because oil extraction, refinery and transit infrastructure in the Gulf and in Russia have been taking such a beating, you would have lost a lot of money. Why? Because the price of oil has been declining, at least the kind of oil you can easily invest in, being futures, ETFs, sector stocks and whatnot. Why has it been declining? More selling than buying, simple.
Now, for the last few days I have been flagging to our Inner Circle members that oil looks to be bottoming out. And we’ll see what happens but so far that is looking likely. Is this because I am a highly skilled oil analyst? It is not. Is it because I have unique insight into the machinations of the Gulf and/or Russia situations? It is not.
It is because of a totally free-to-use indicator you can find in most any stock chart platform, being Price x Volume. This indicator tells you the volume of securities traded in any given price band. Those of you using Bloomberg for charting can find this functionality in the ‘Volume At Price’ tool (details here); if you’re not a Bloomberg user, you will find the tool in TradingView and also TrendSpider. Now, in my professional journey from private unlisted securities (LBO, VC) to public liquid stuff I have been lucky to learn a lot of things from a lot of people along the way. And I owe the use of Volume x Price to Jake Wujastyk when he was at TrendSpider. You can find Jake here - these days he runs the biggest technical analysis service on X, to the annoyance of, oh, everyone - and TrendSpider here.
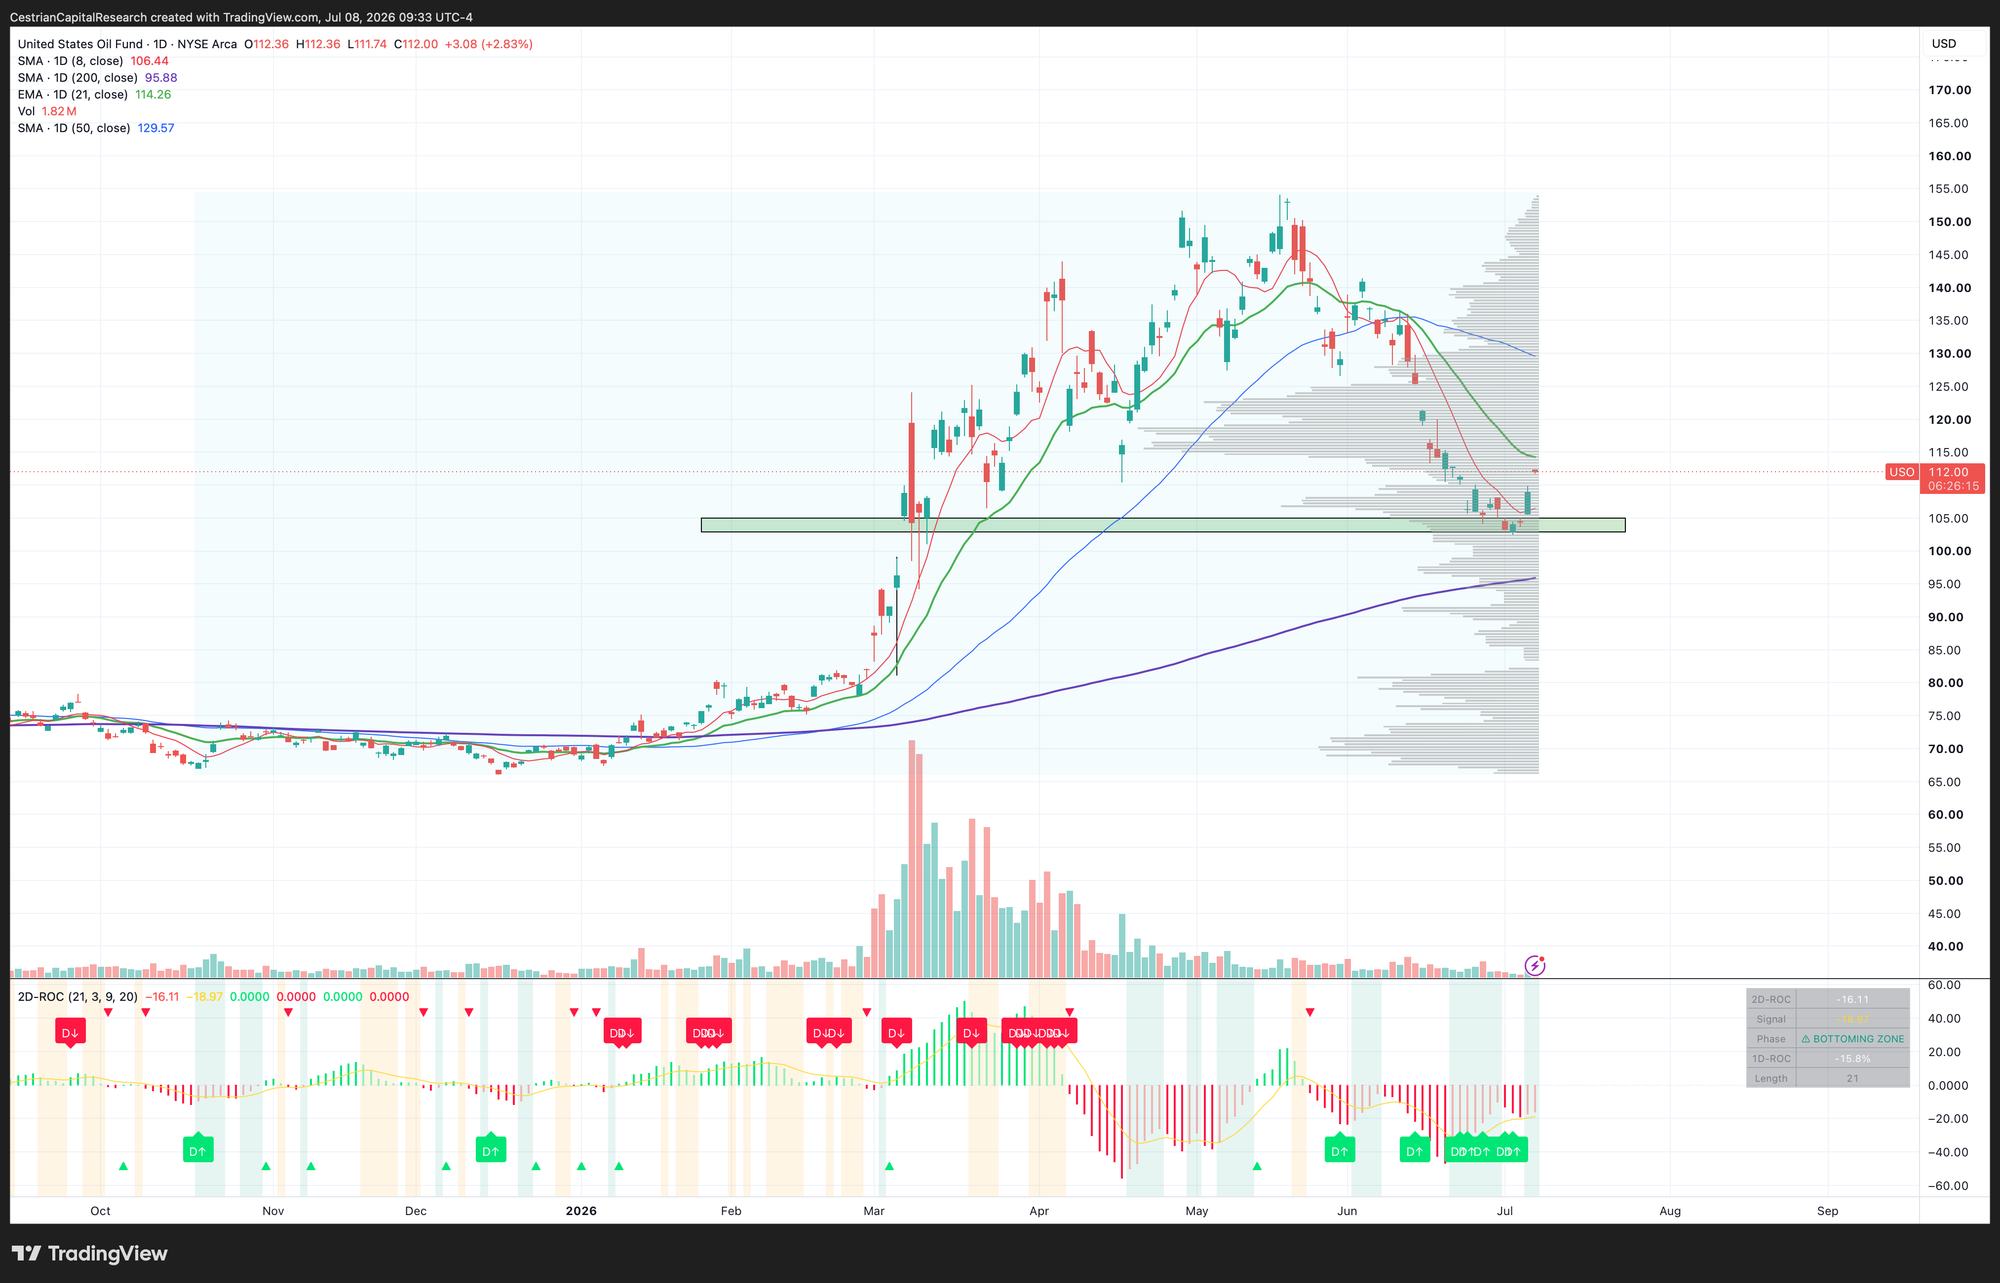
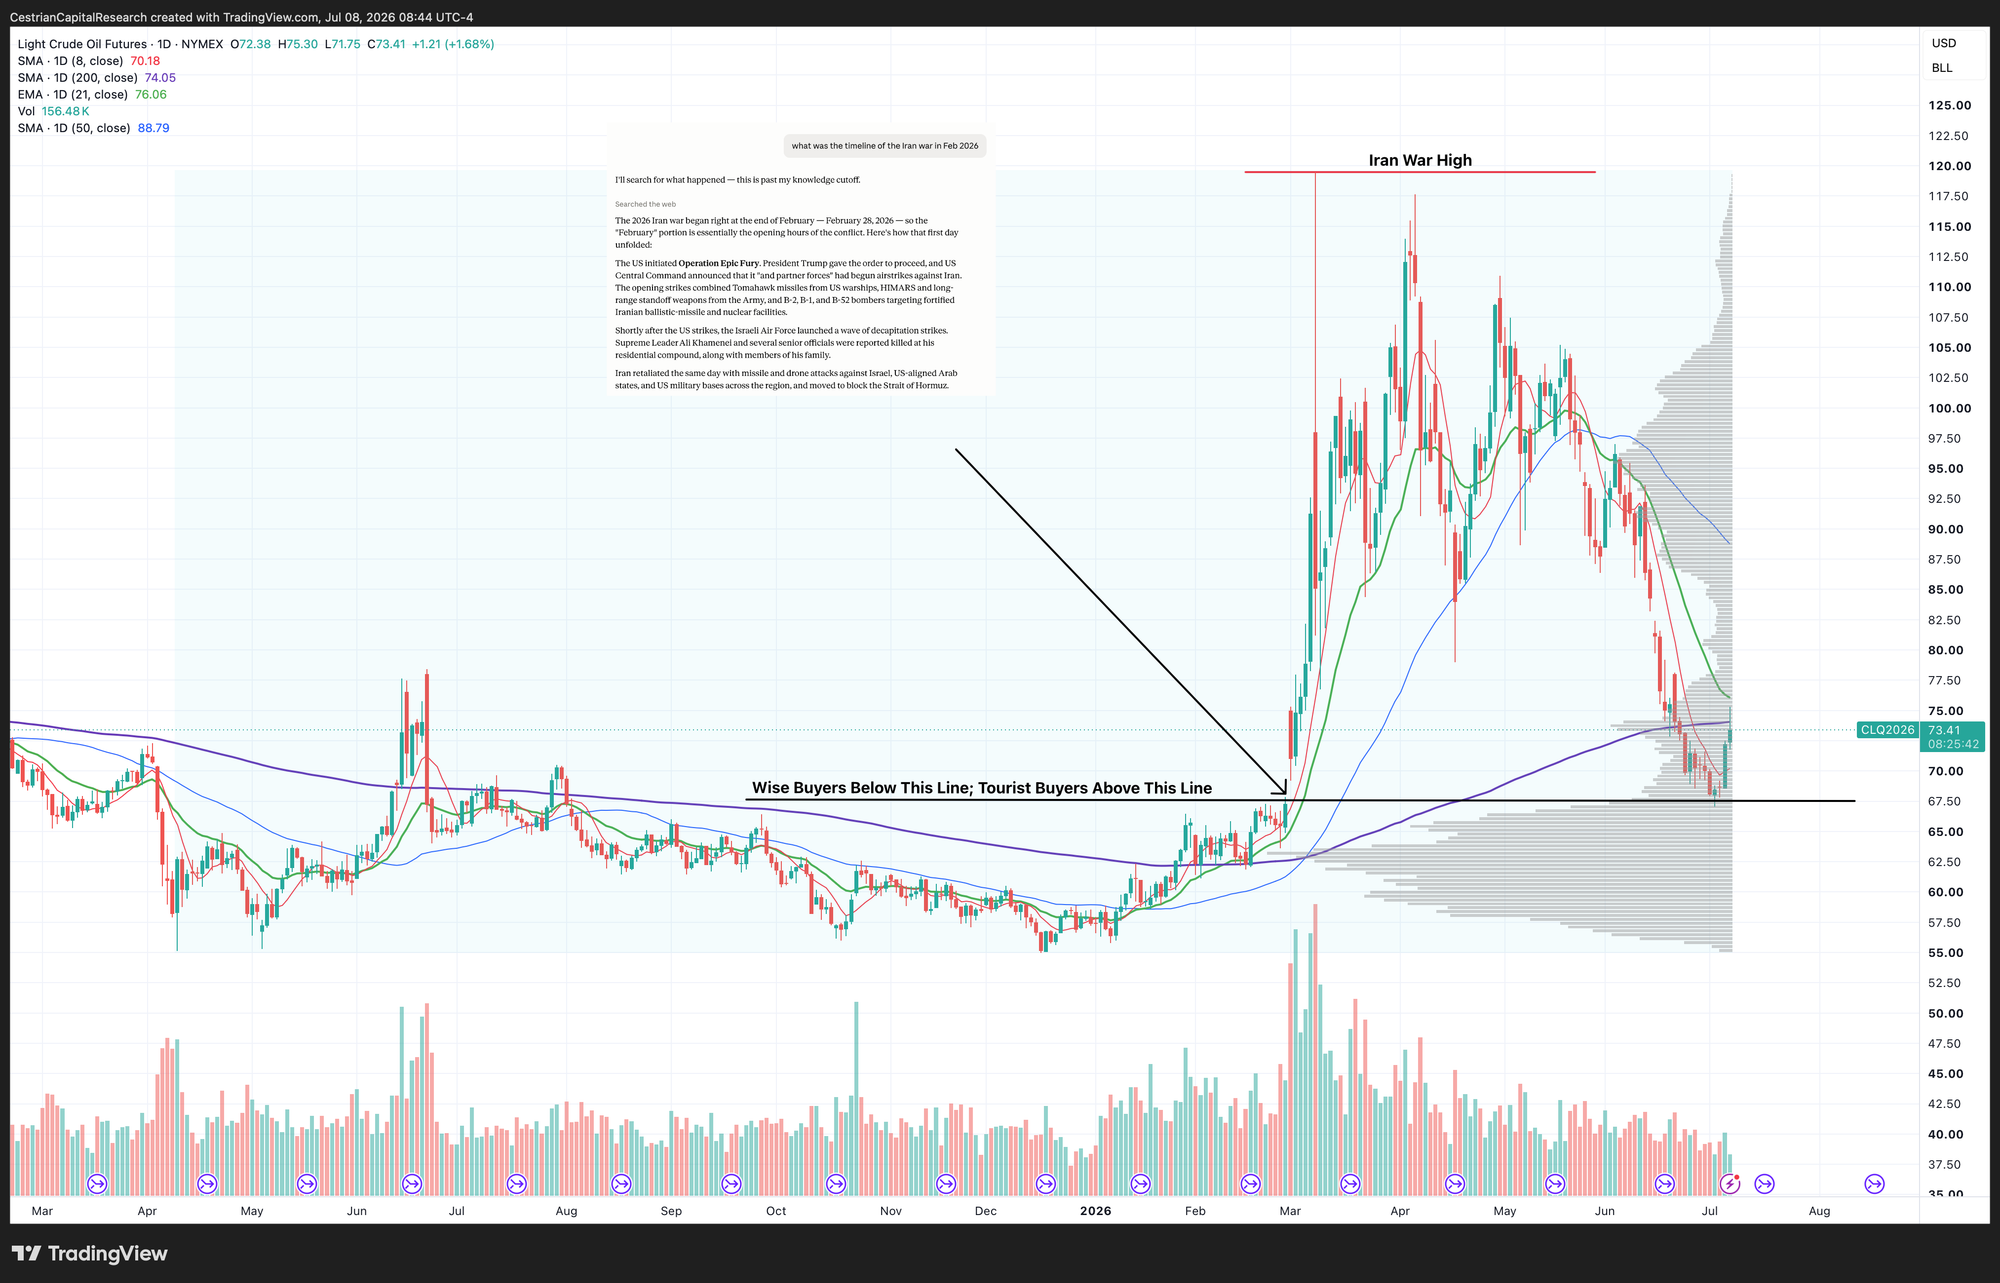
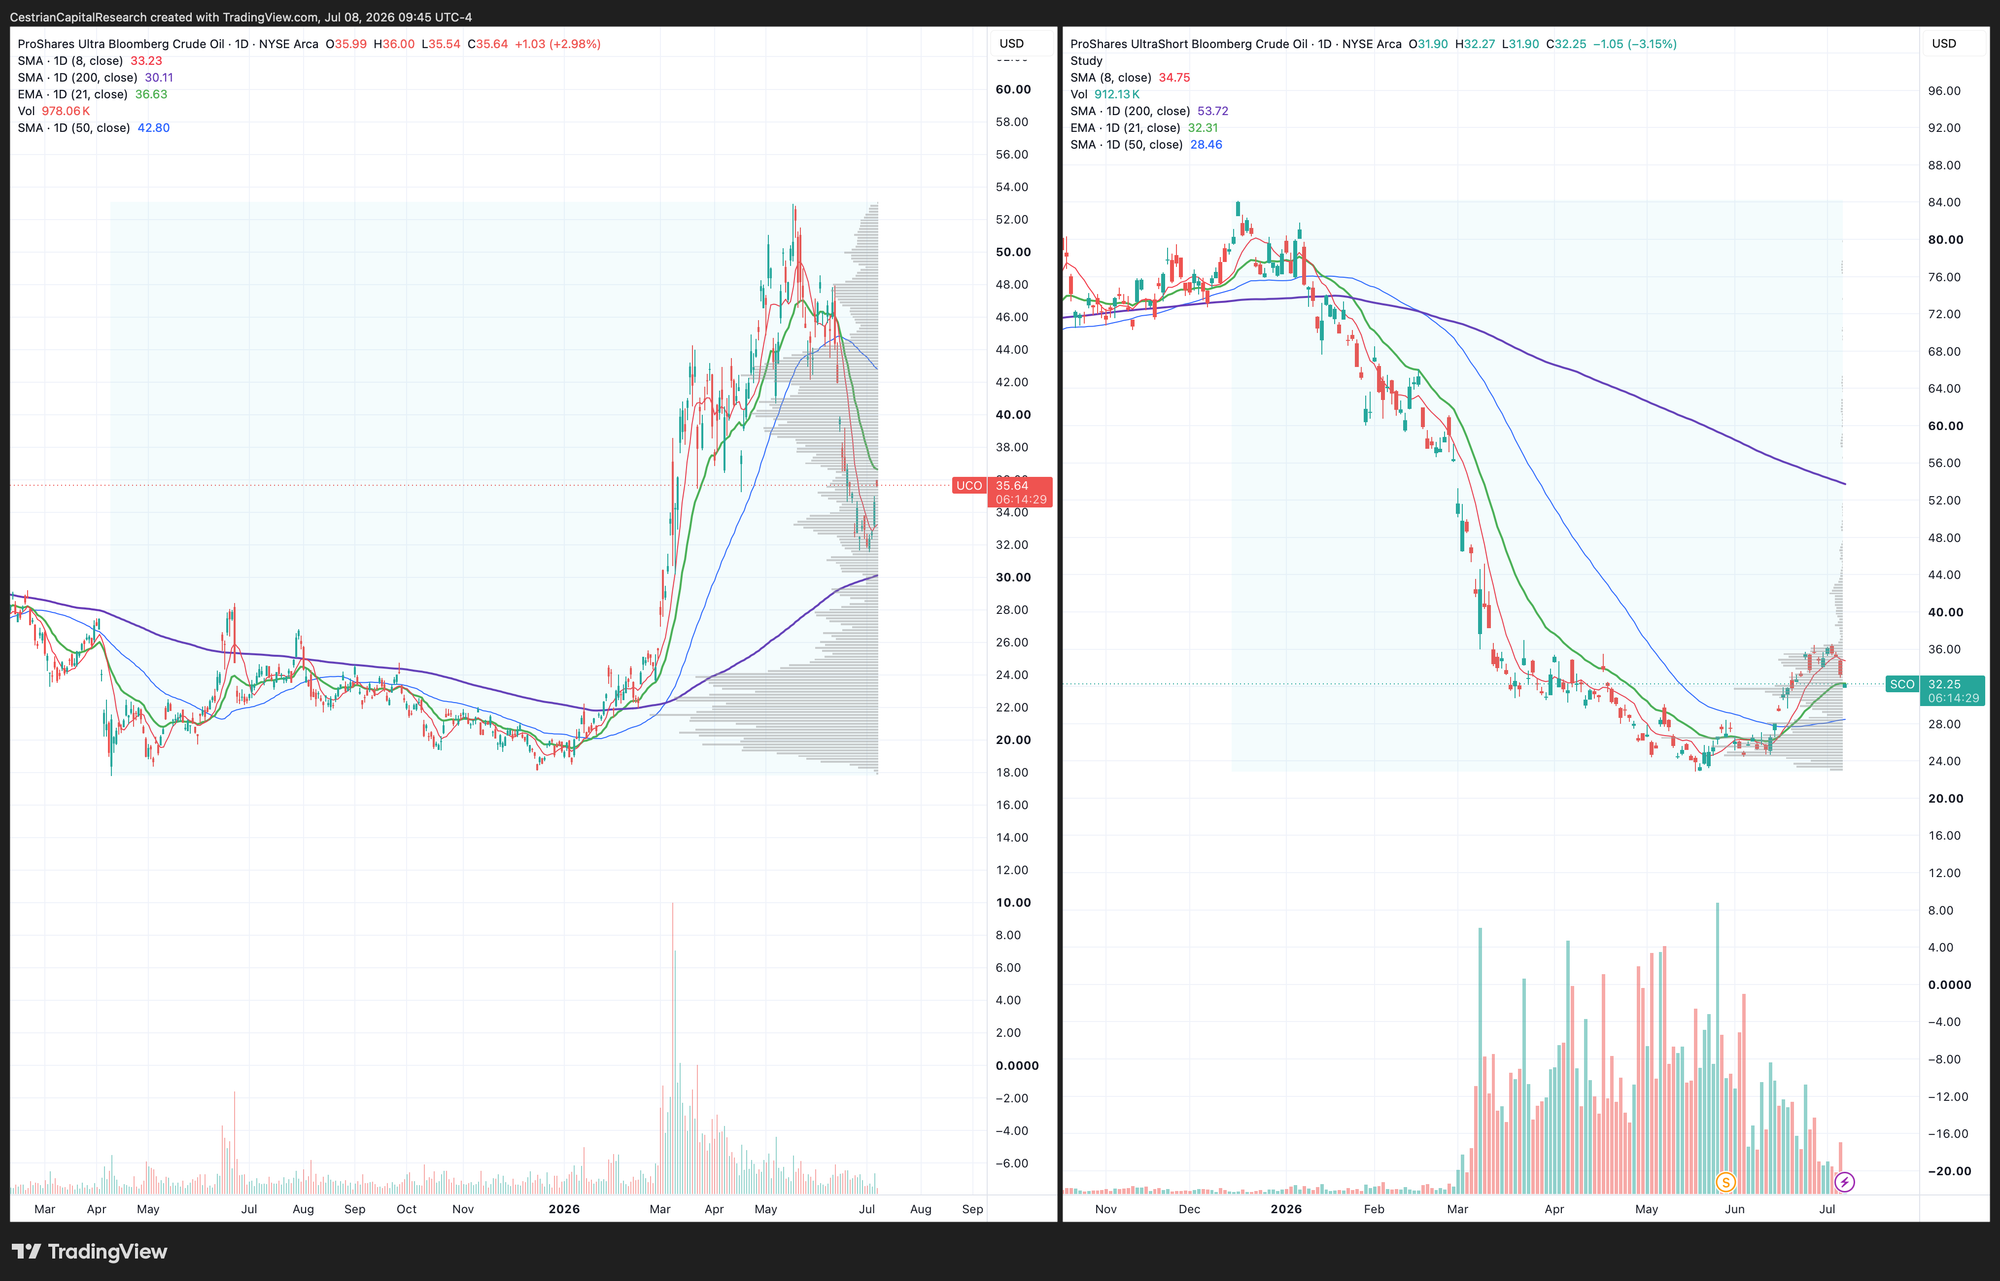
Here’s what volume x price has to say about oil. I posted this chart yesterday before the end-of-ceasefire-news by the way; this being my point. Charts are the real news; then the TV tells you why the chart has been doing what it has been doing.
Now, let’s get to work.
In our daily Market On Open notes, delivered to our Inner Circle members by e-mail, Slack message, and web page, every single trading day, we cover the S&P500, Nasdaq, Dow, Treasuries, Crypto, Gold, Oil, Sector ETFs and Global Equity ETFs.
Today this note is available to all our readers on a no-paywall basis.
You can join our Inner Circle service here. If you’re a Circle member already, we’ll credit any unused subscription value against your new Inner Circle membership, so you won’t be out of pocket. If you have any difficulties signing up just email us at minerva@cestriancapital.com or use this contact form.
US Government Bond Outlook
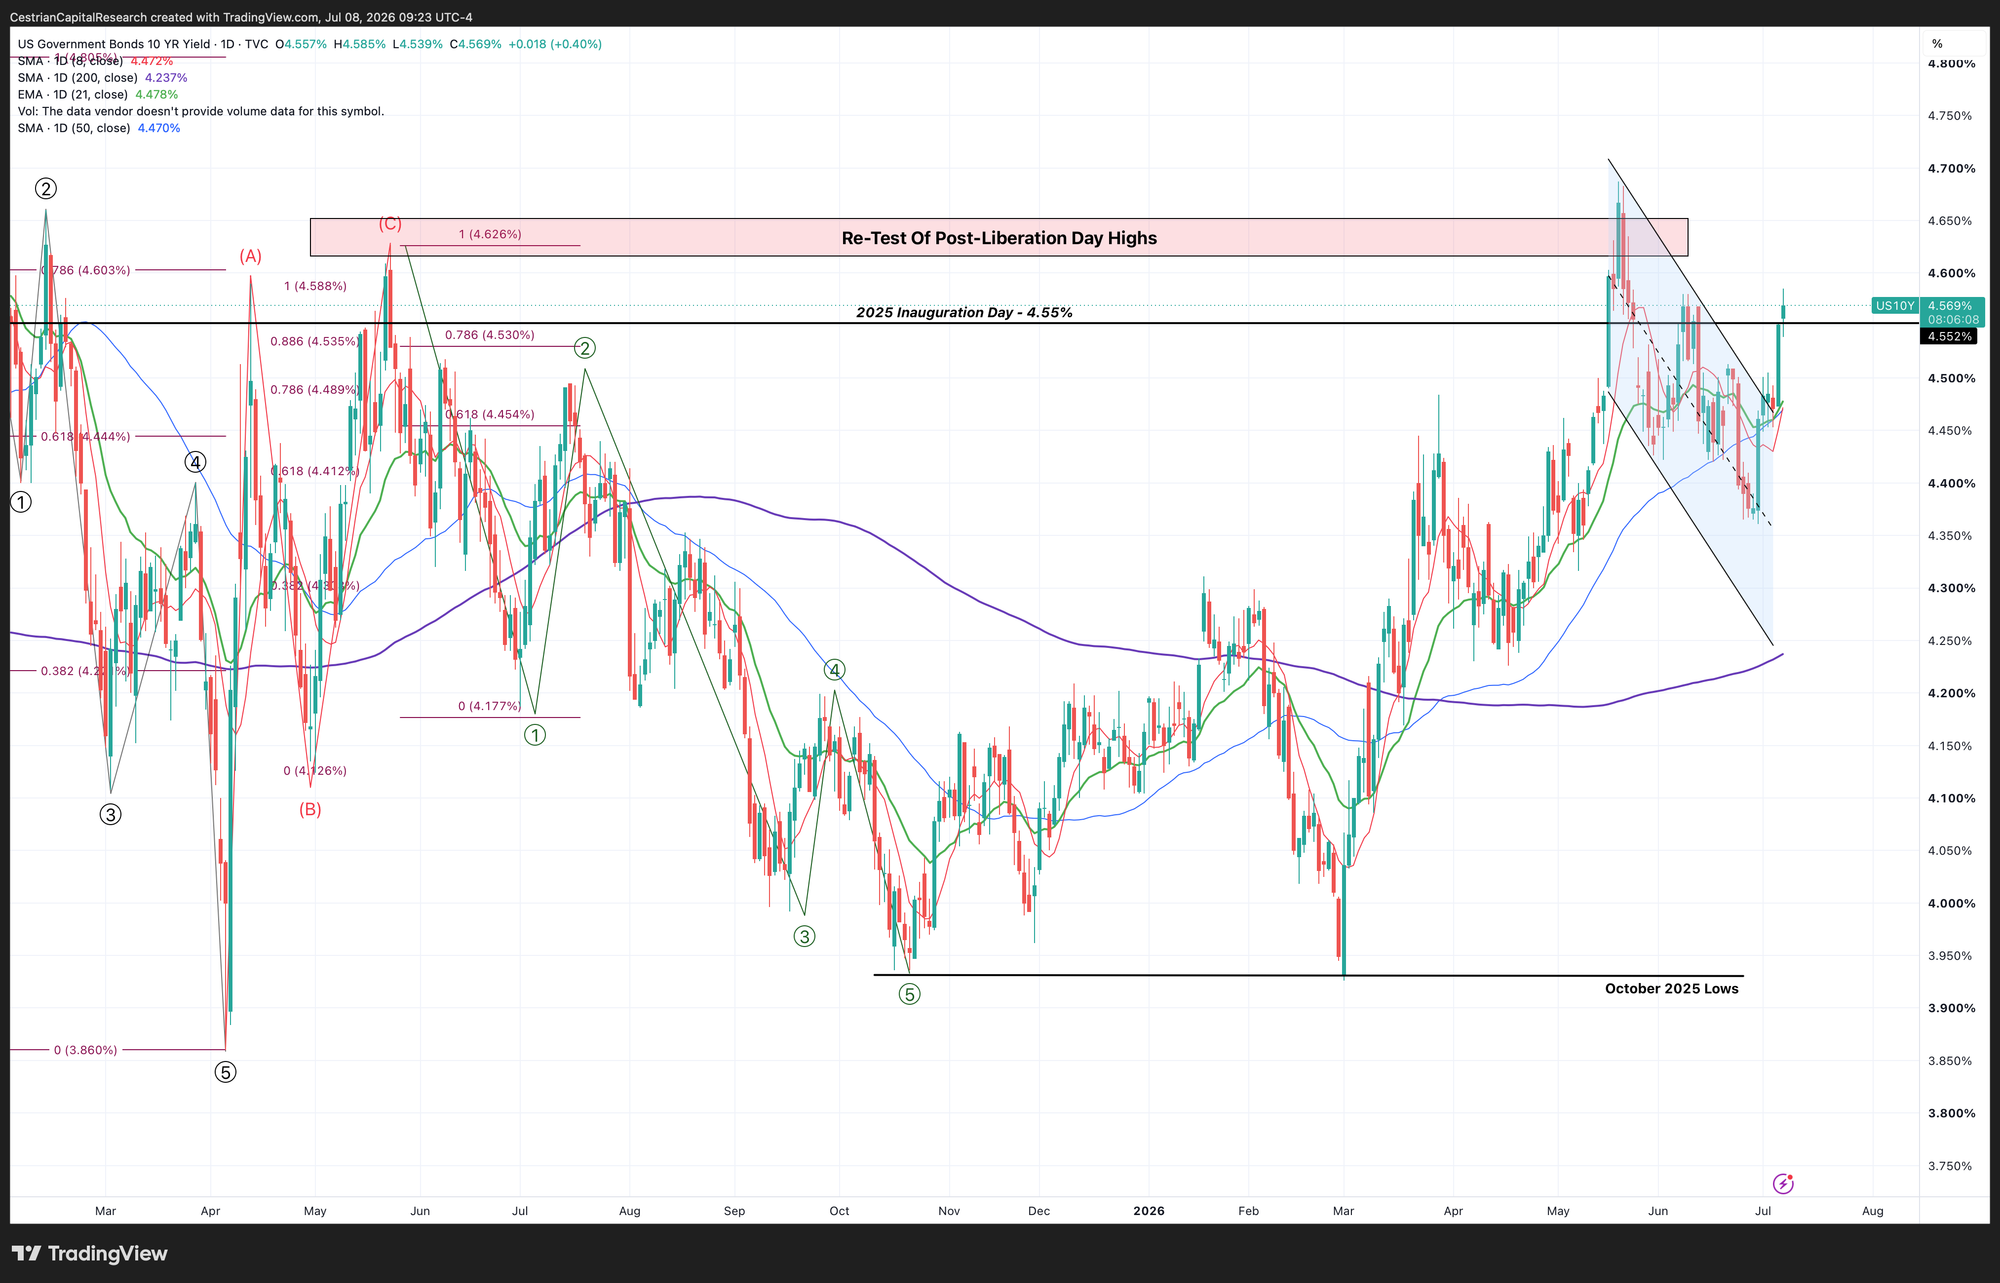
War is inflationary, bonds hate inflation, so back up go yields. This at least is easy to understand!
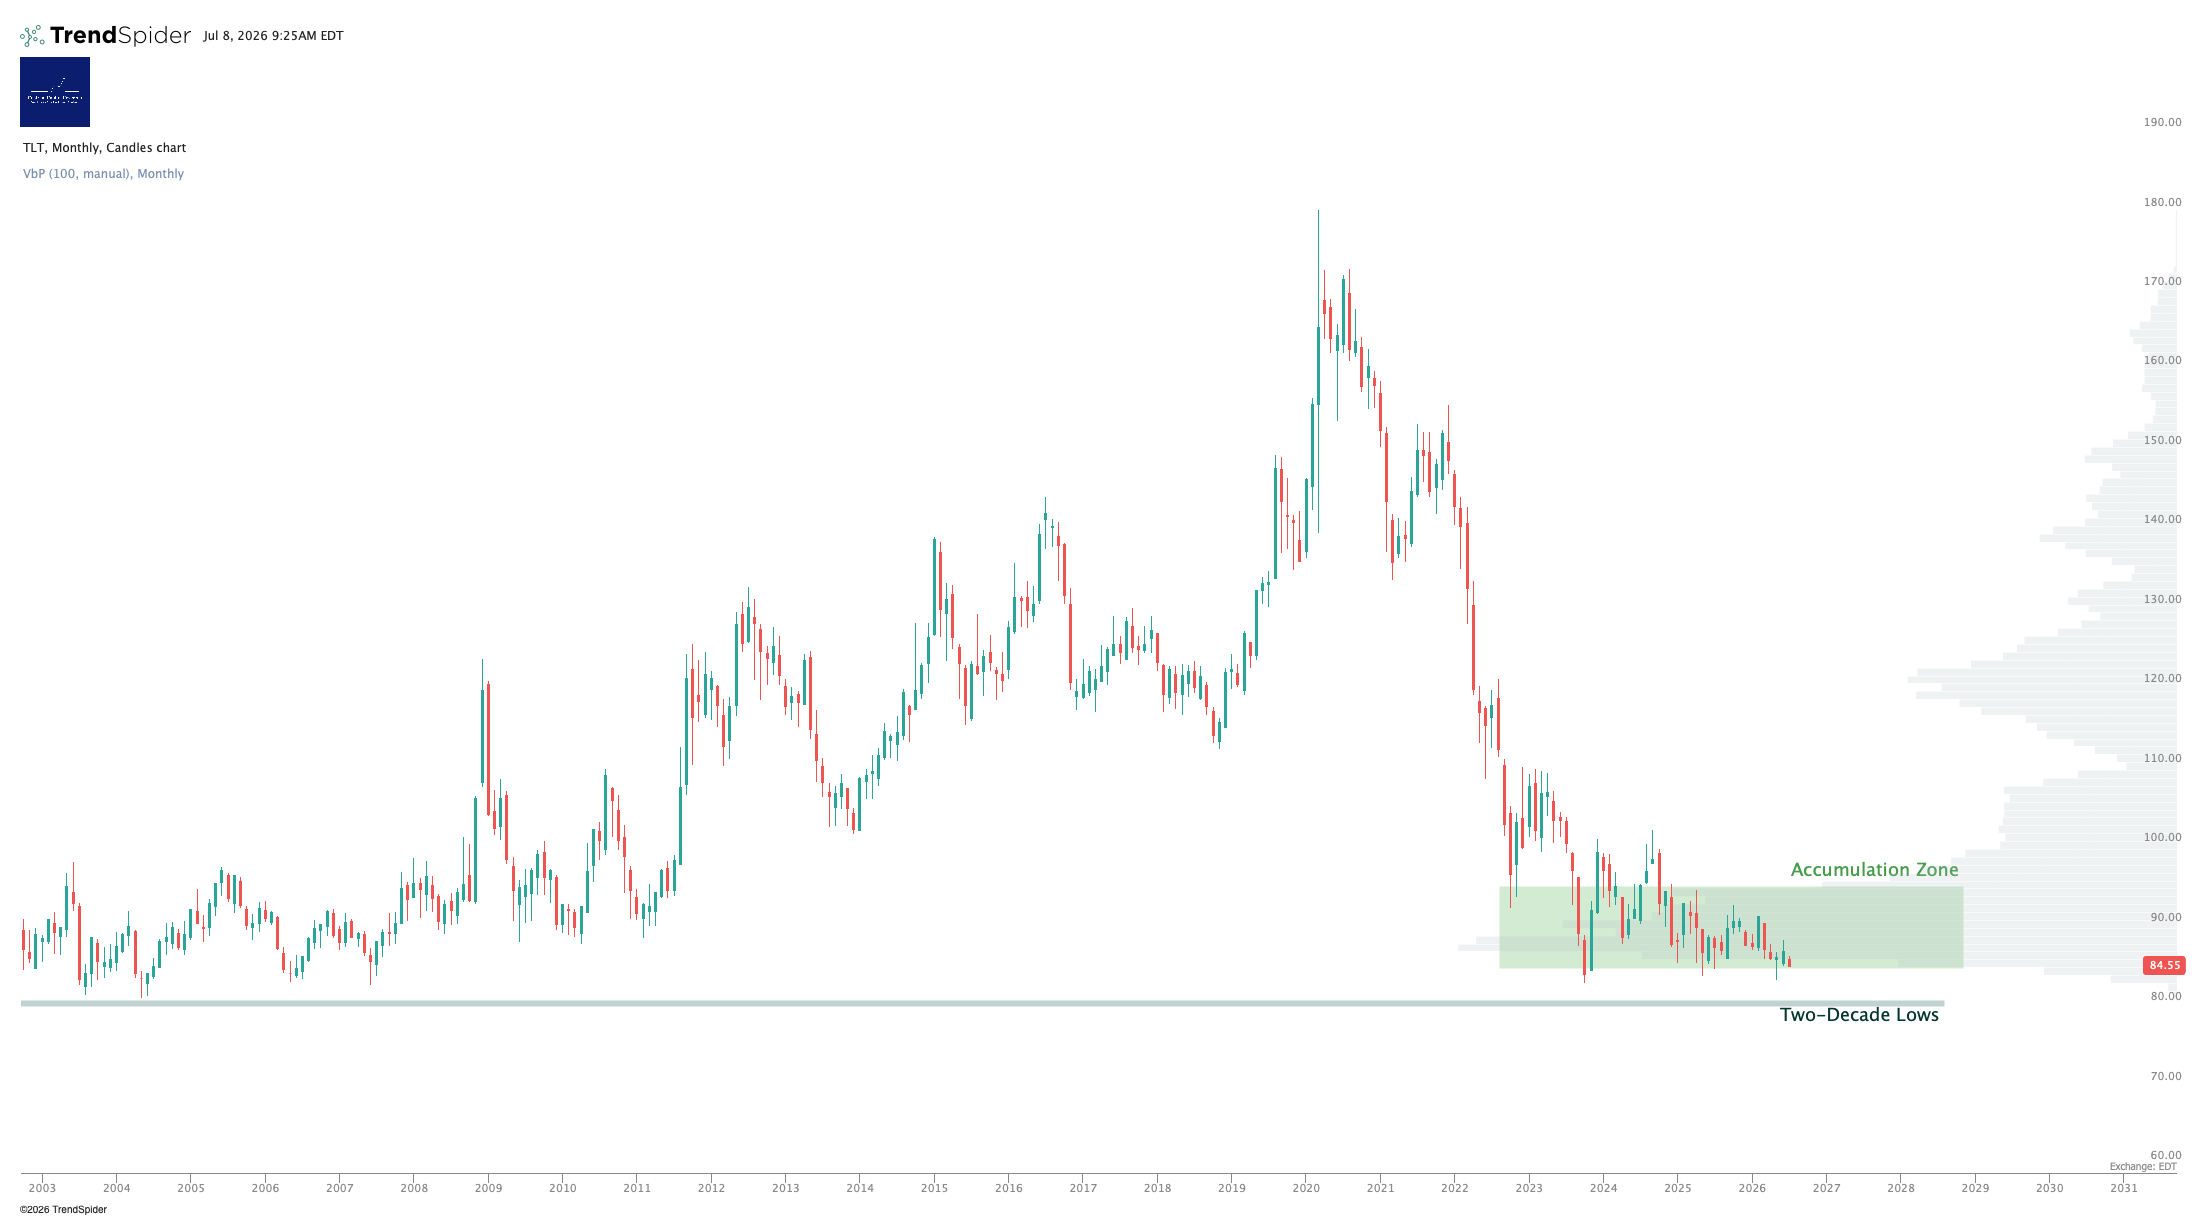
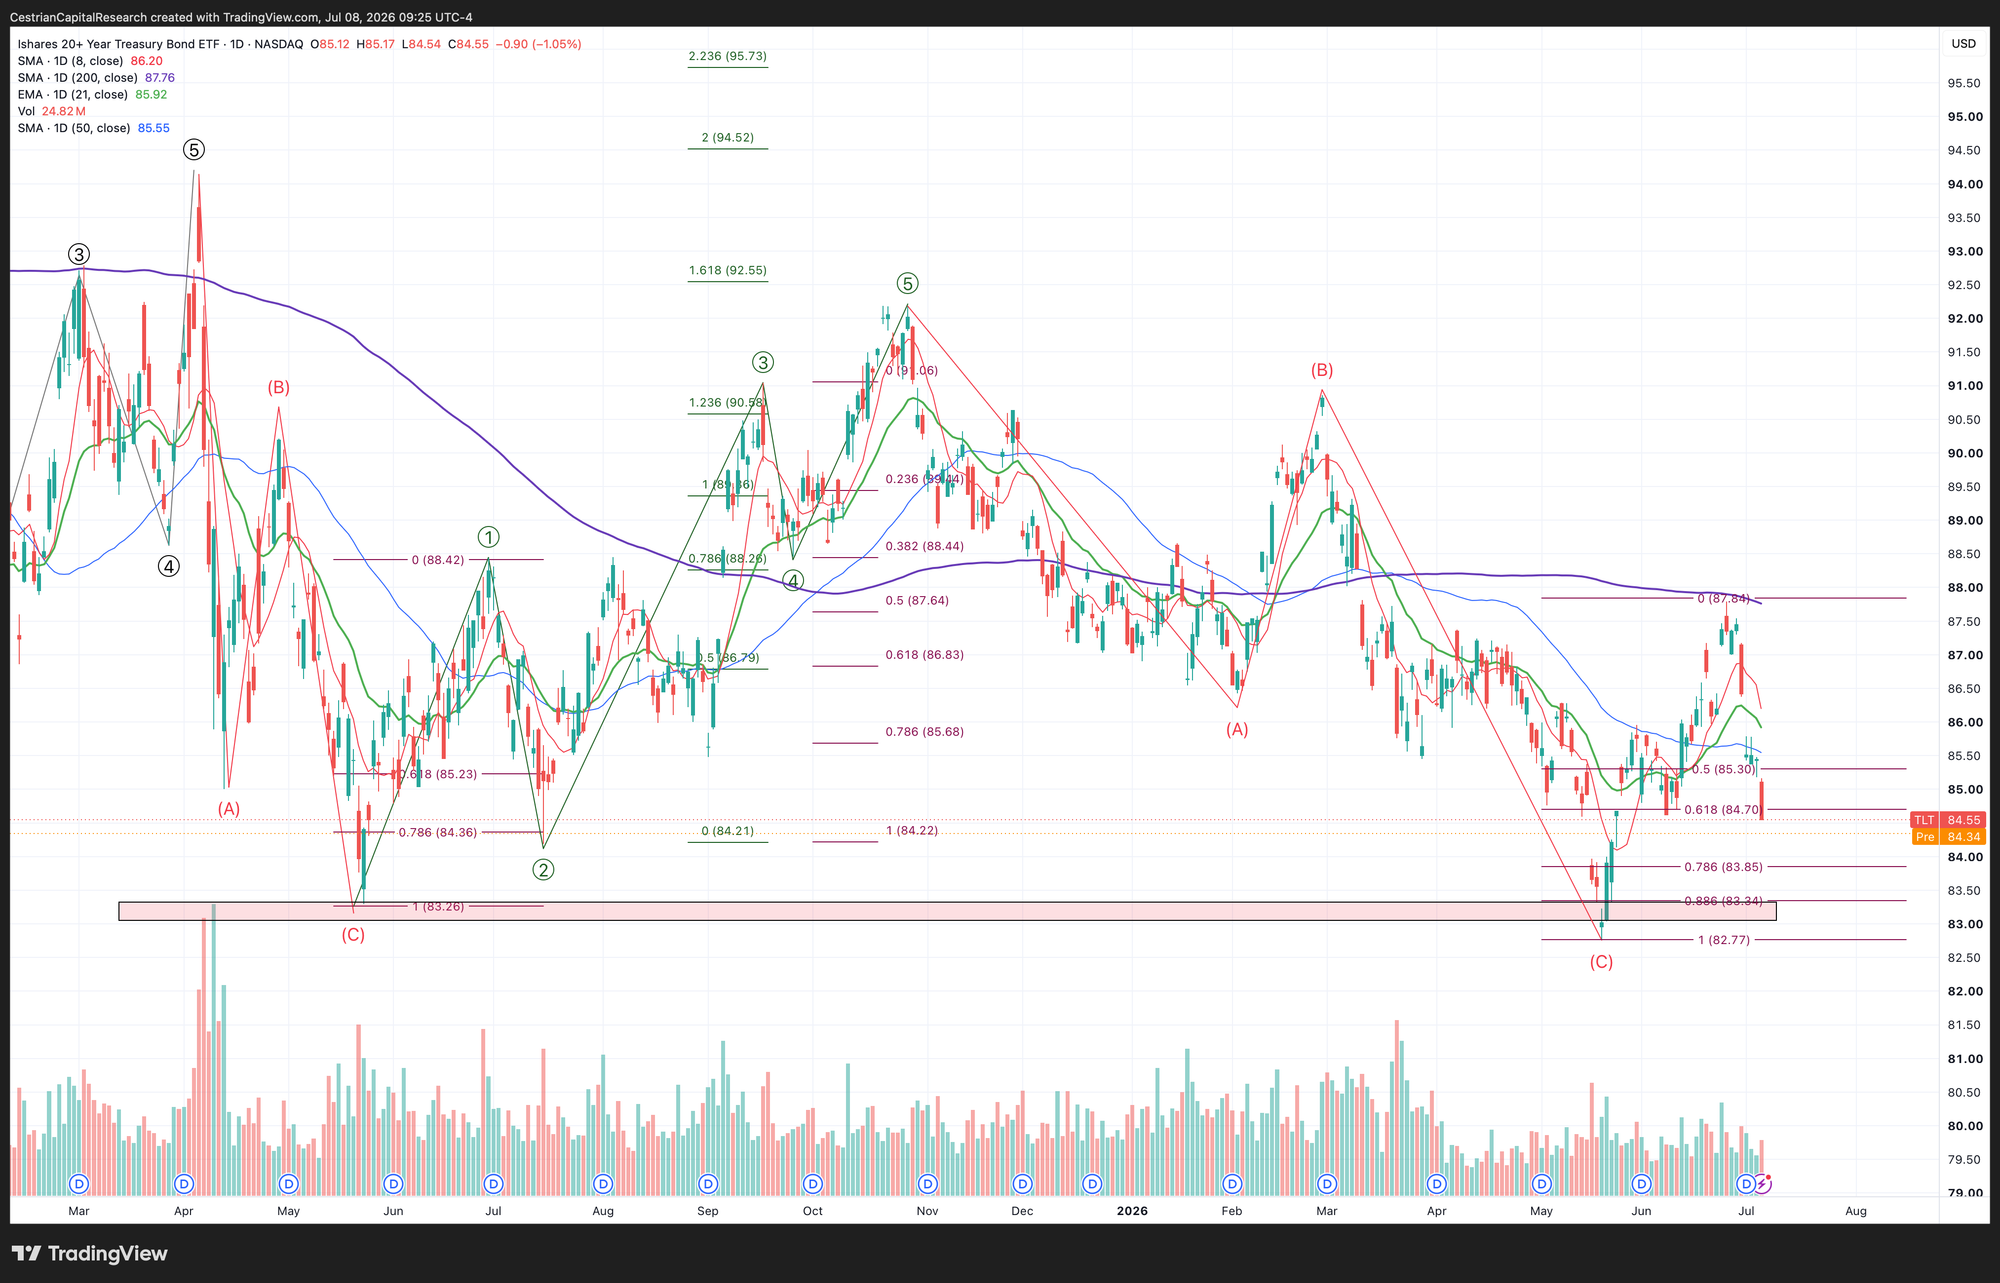
Longer-Term Treasury Bonds (TLT / TMF)
Back down at the lows.
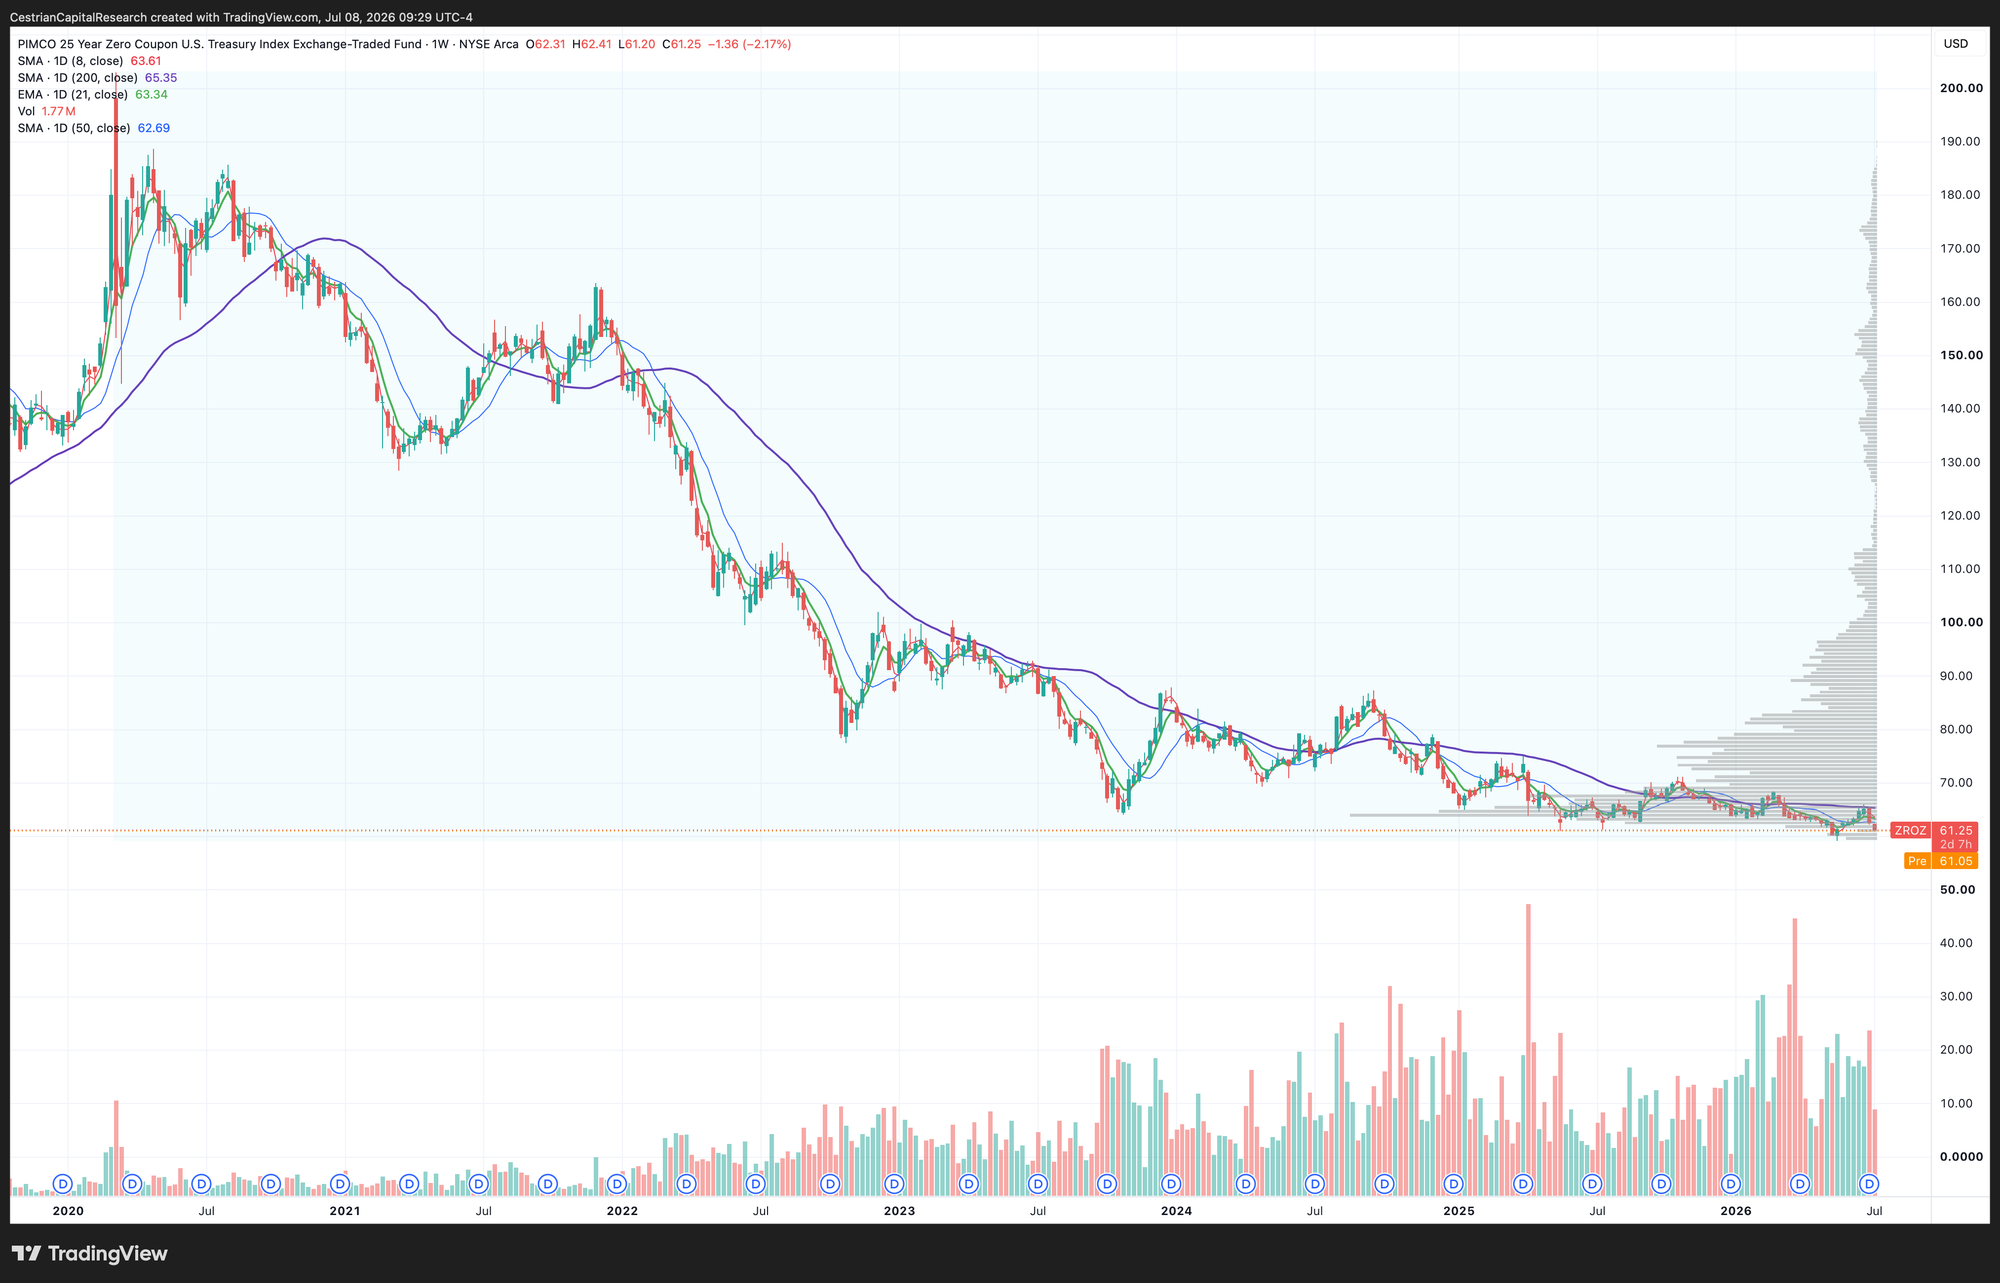
25Yr Zero-Coupon UST ETF - ZROZ
Here’s another example of using volume x price. Odds are that based on the accumulation down here, rates are going to fall.
Commodities Outlook
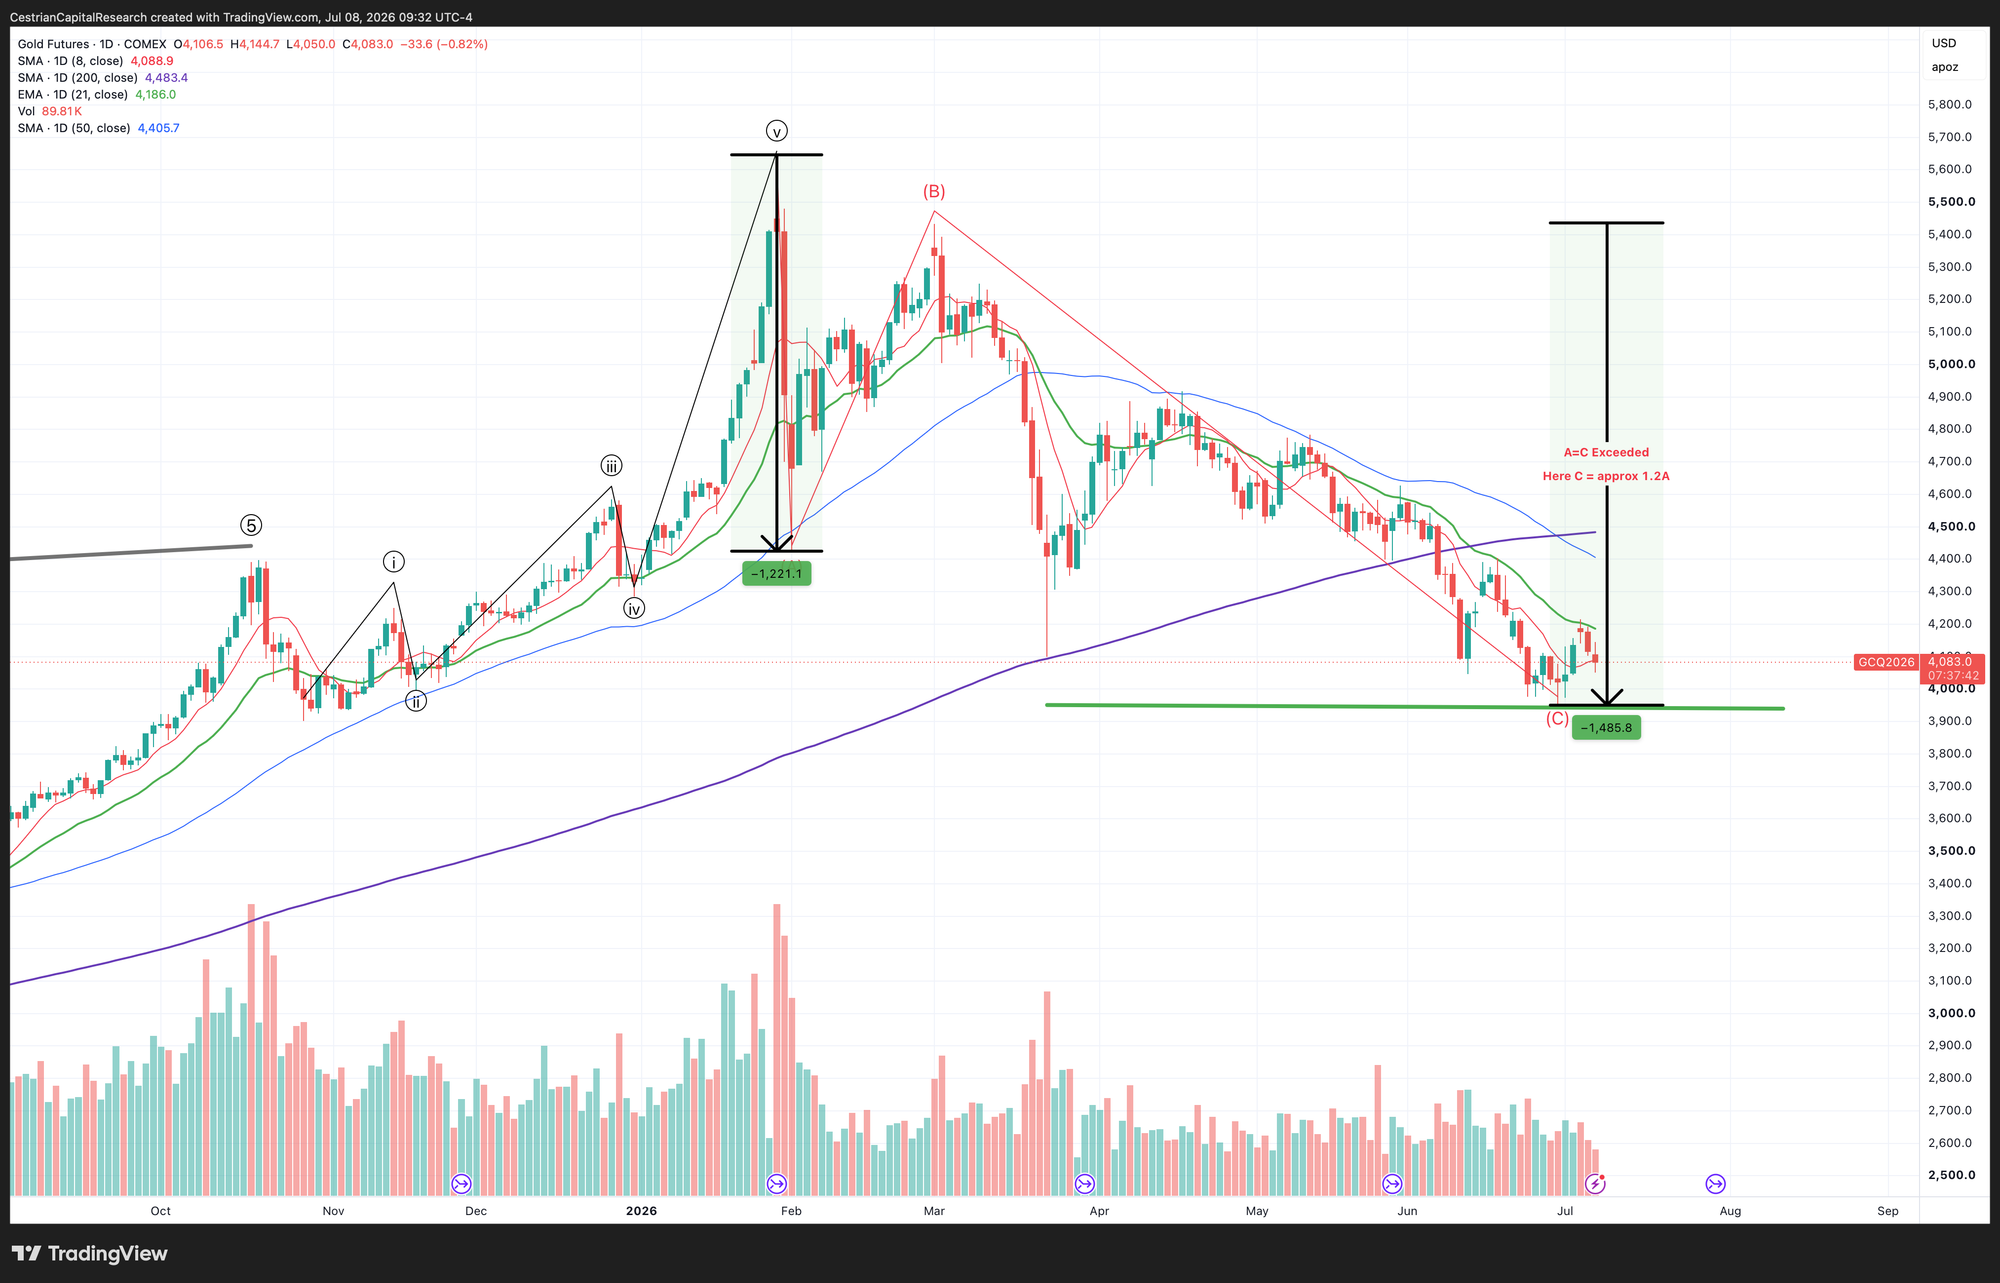
Gold
Needs to get up and over the 21-day EMA if this rally is to be sustained.
Disclosure: I am long $MAI and long $GLD.
Oil (USO / WTI / UCO)
Gapped up on the end-of-ceasefire news. But the chart already told you this was going to happen, if only you had eyes to see.
As above.
2x Levered Long (UCO) / Short (SCO)
Note - Leveraged ETFs. Read the fund documentation if you are considering using these instruments.
Look I don’t want to drone on about this, ‘cept I do; if you look at volume x price in SCO you will see that anyone who went short oil since 12 March has had the opportunity to exit at breakeven or better - right before SCO started falling again.
Even if you don’t like to trade these inverse levered ETFs, and there is every reason why they can be a bad idea … the signal they offer is sometimes unparalleled.
Disclosure: I am long $USO, $XOM, $OXY, $OBE, and $JOY.TO
For algorithmic signals in oil, gold and other commodities, learn more about our Commodities Algo Service.
Crypto Outlook
Bitcoin
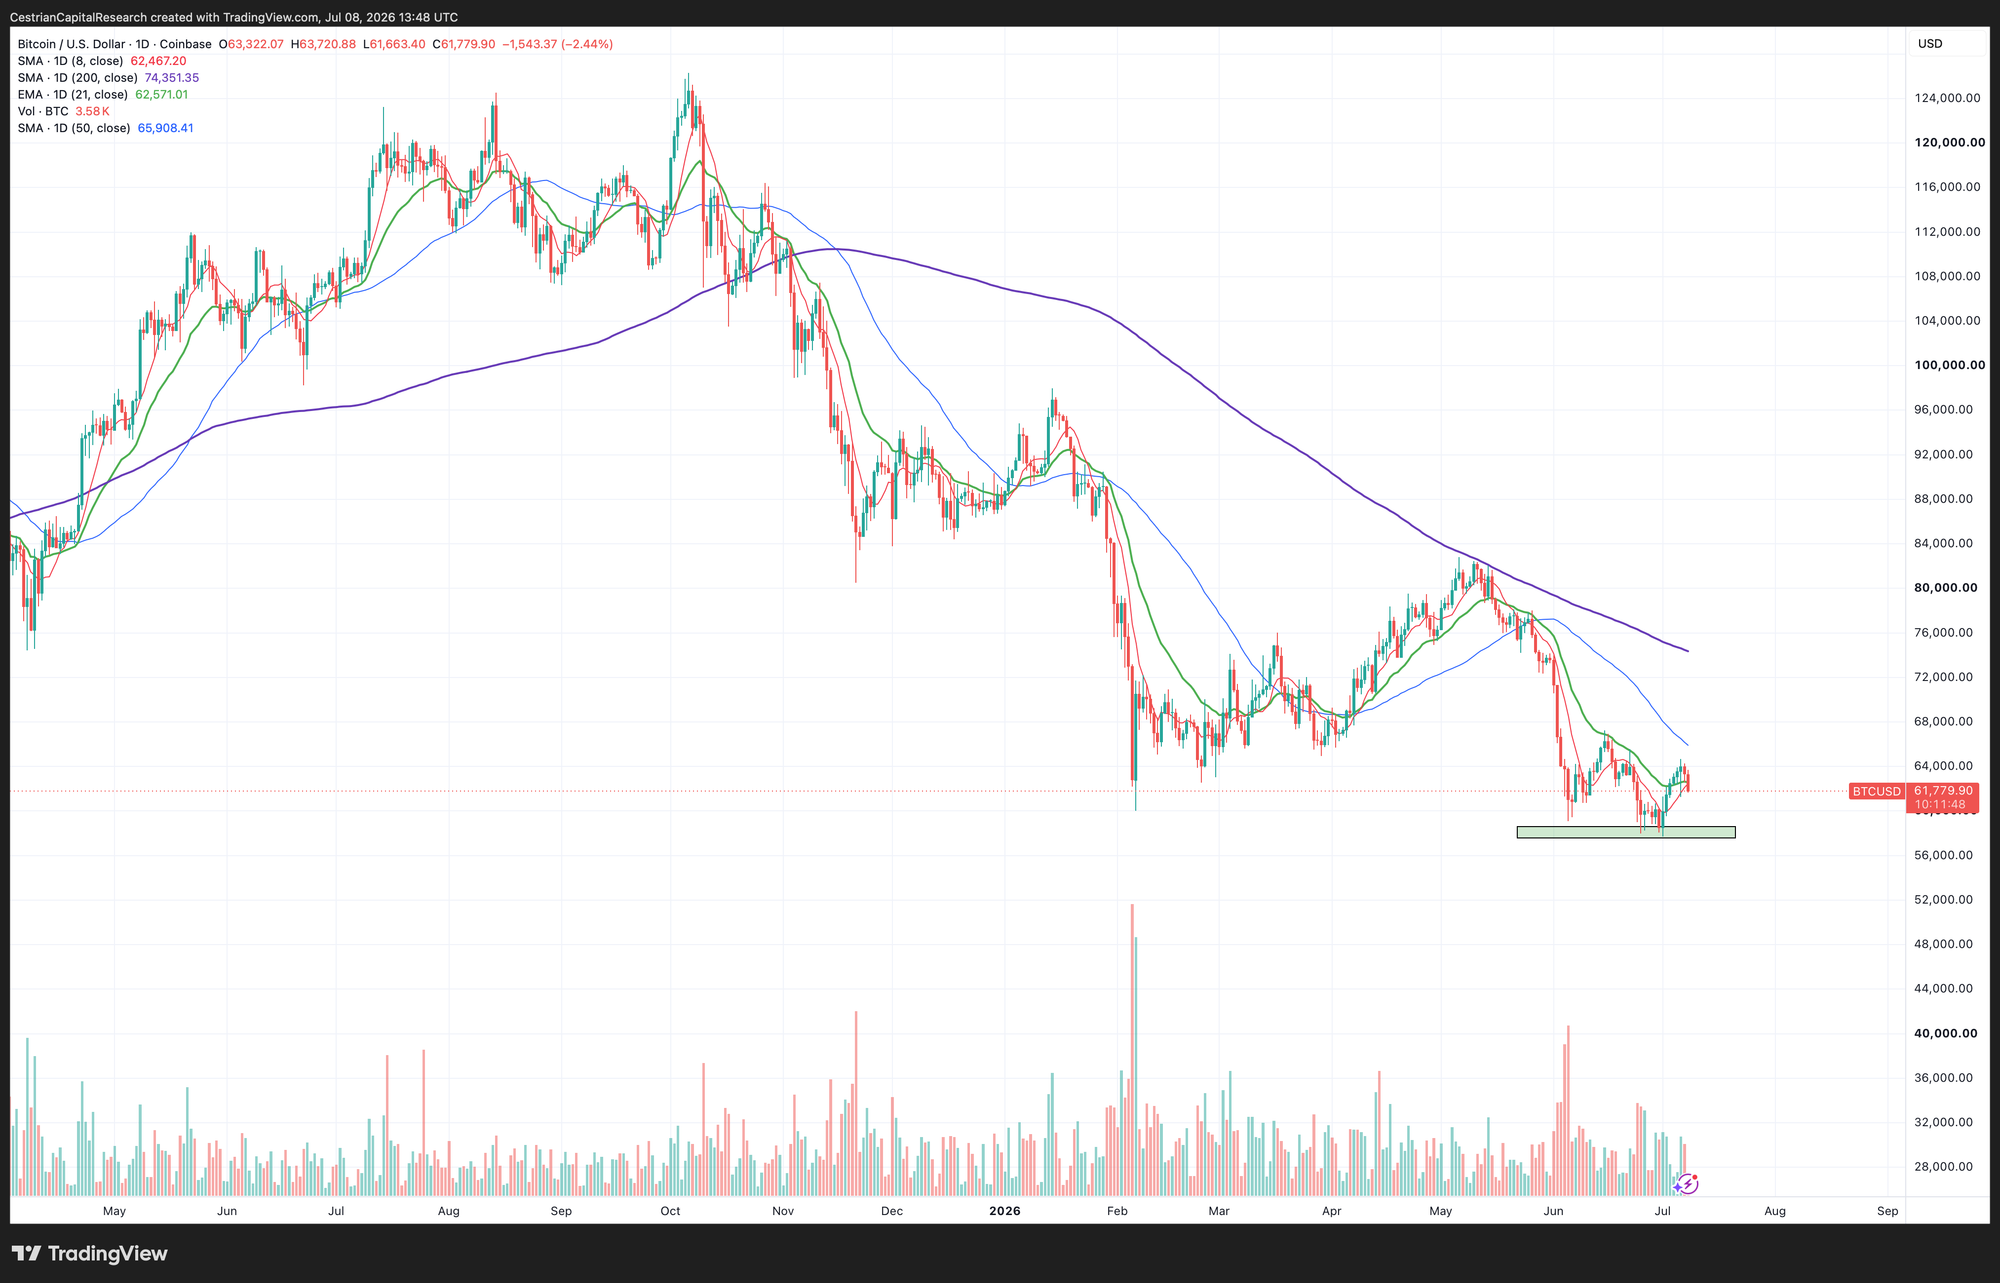
This recovery is, shall we call it, fledgling in nature.
Ether
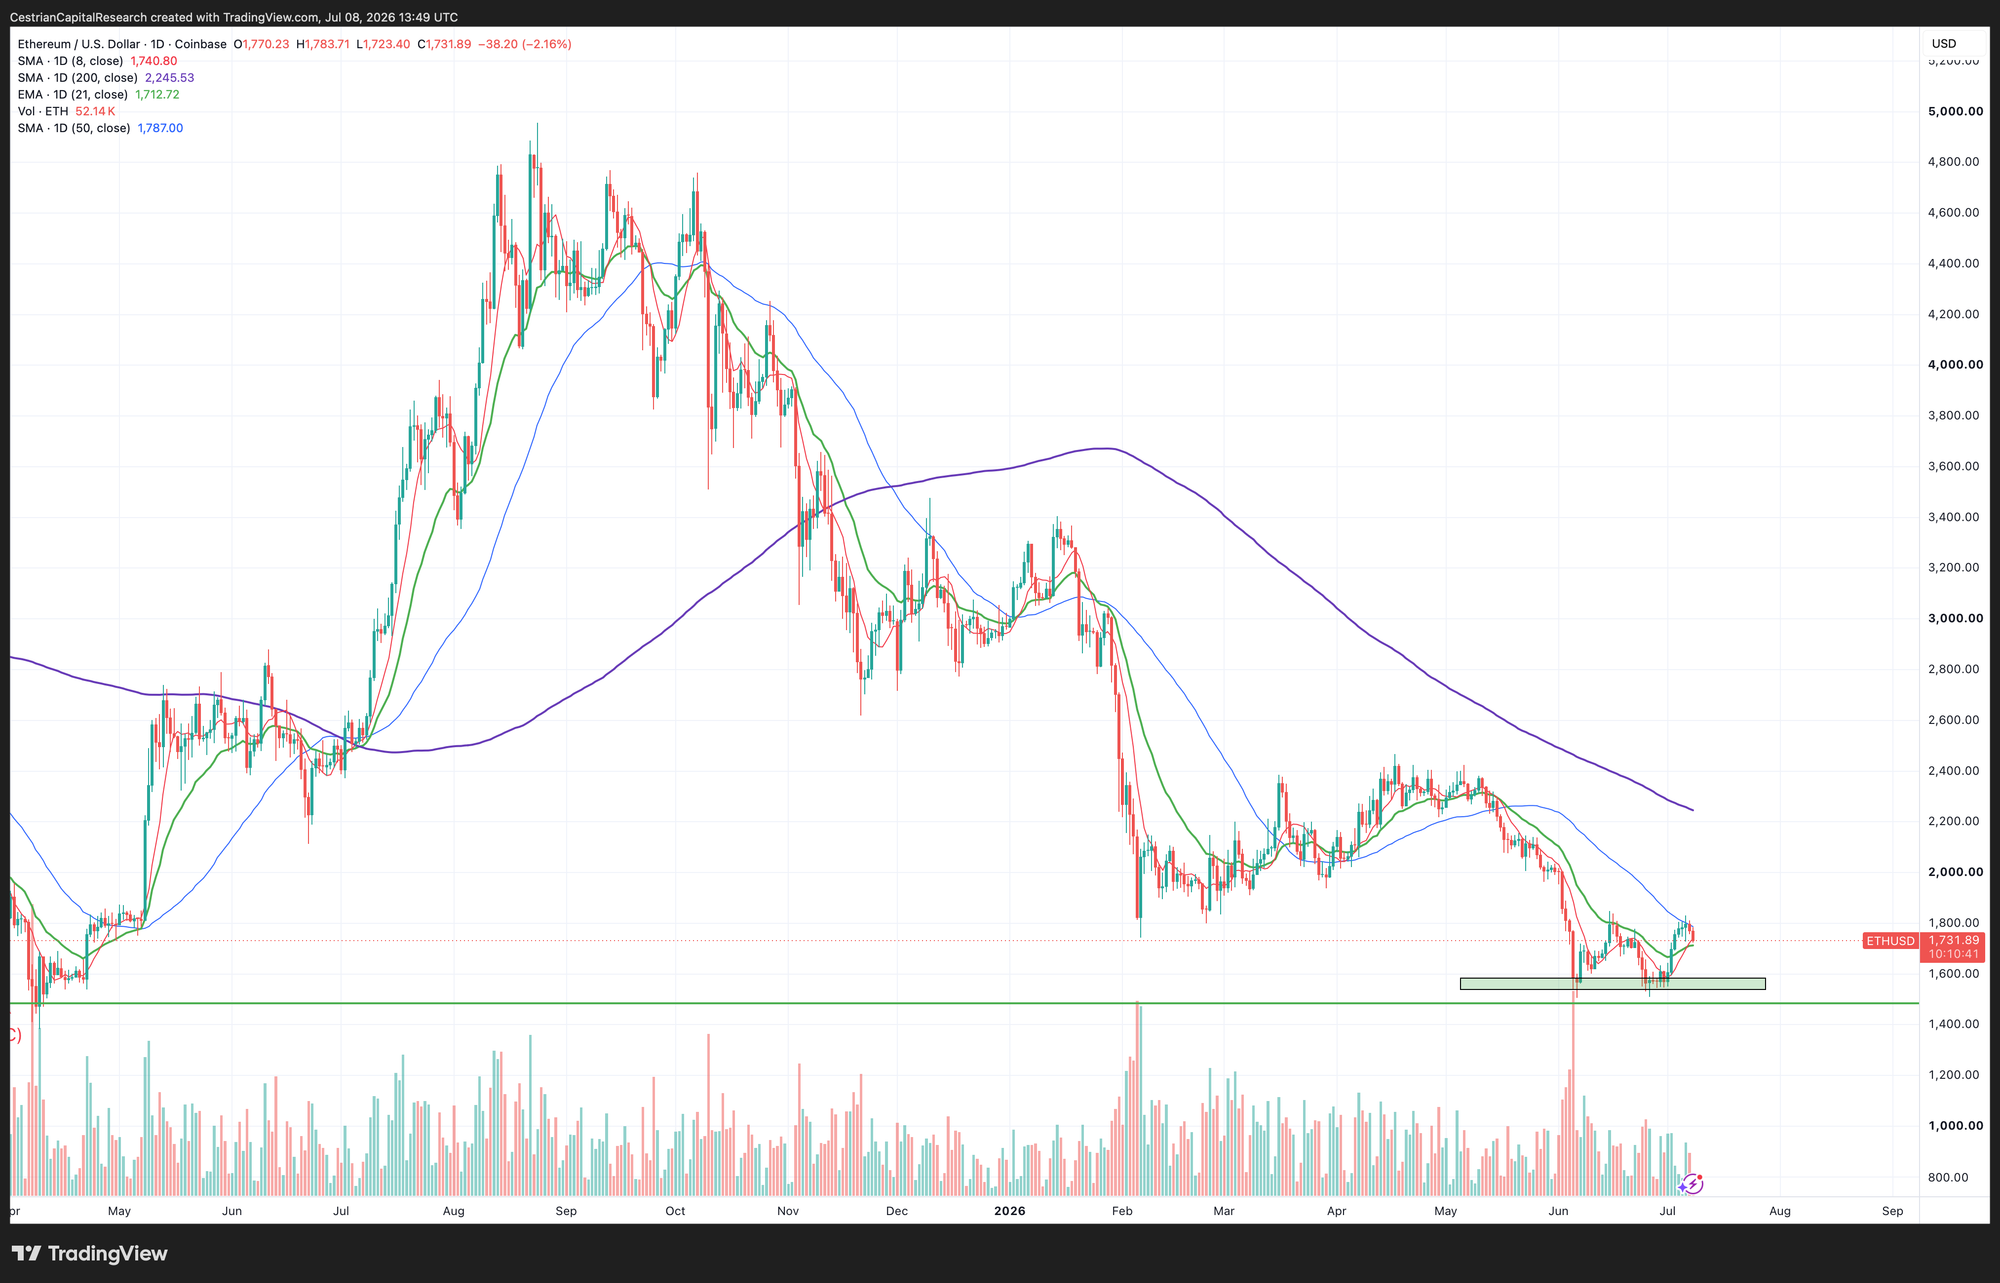
As for Bitcoin.
Disclosure: I am long $ETHA, $ETHT, $SBET, $BMNR.
US Equities Outlook
Equity Volatility
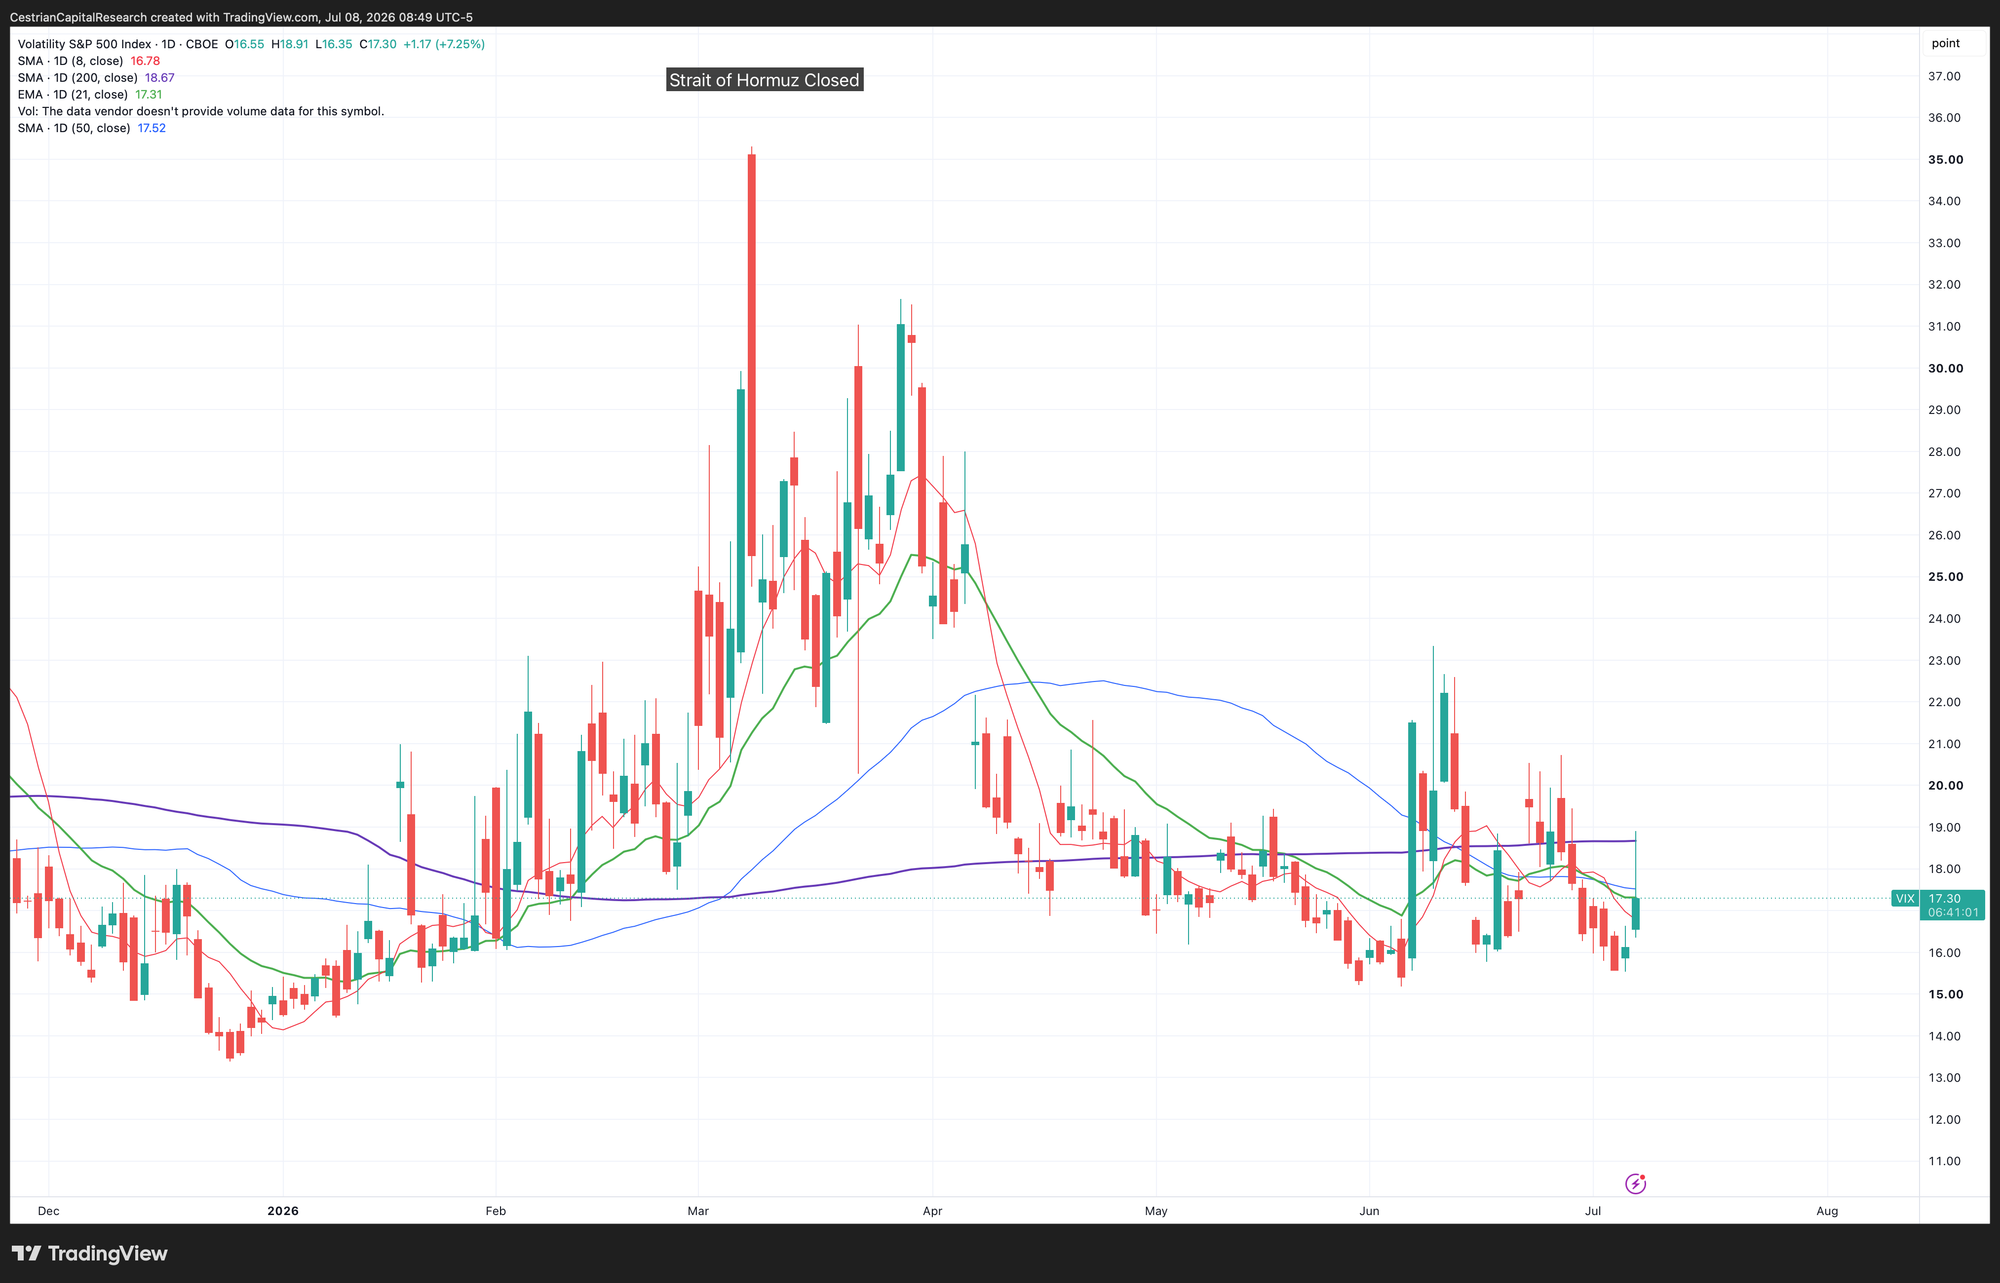
Today’s spikette is already fading.
Disclosure: Long Vix $17 strike calls for December by way of a modest hedge.
S&P500 / SPY / UPRO
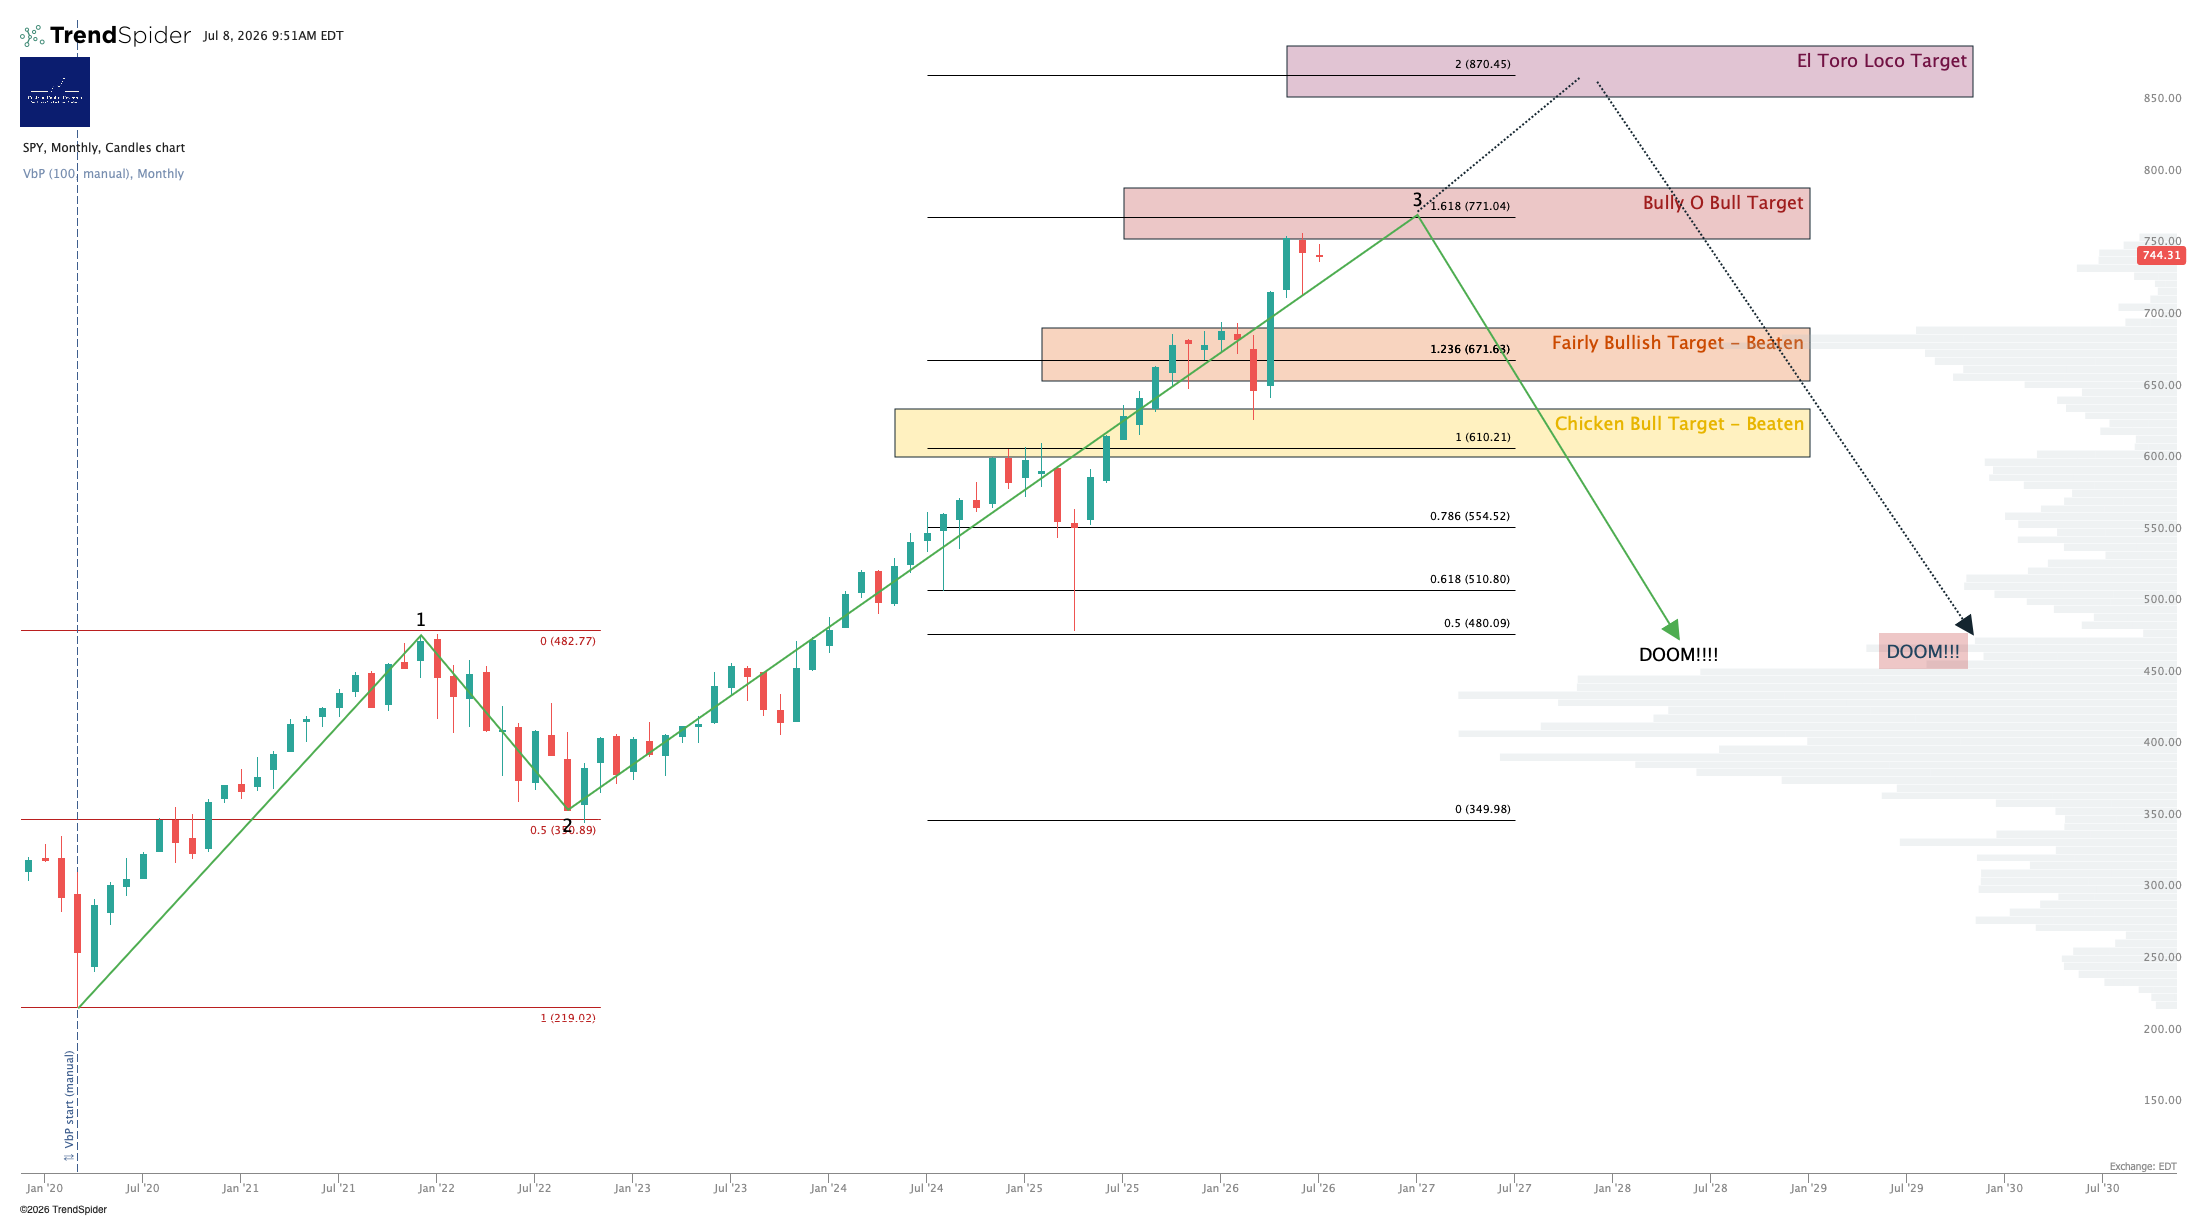
A nothingburger so far in July.
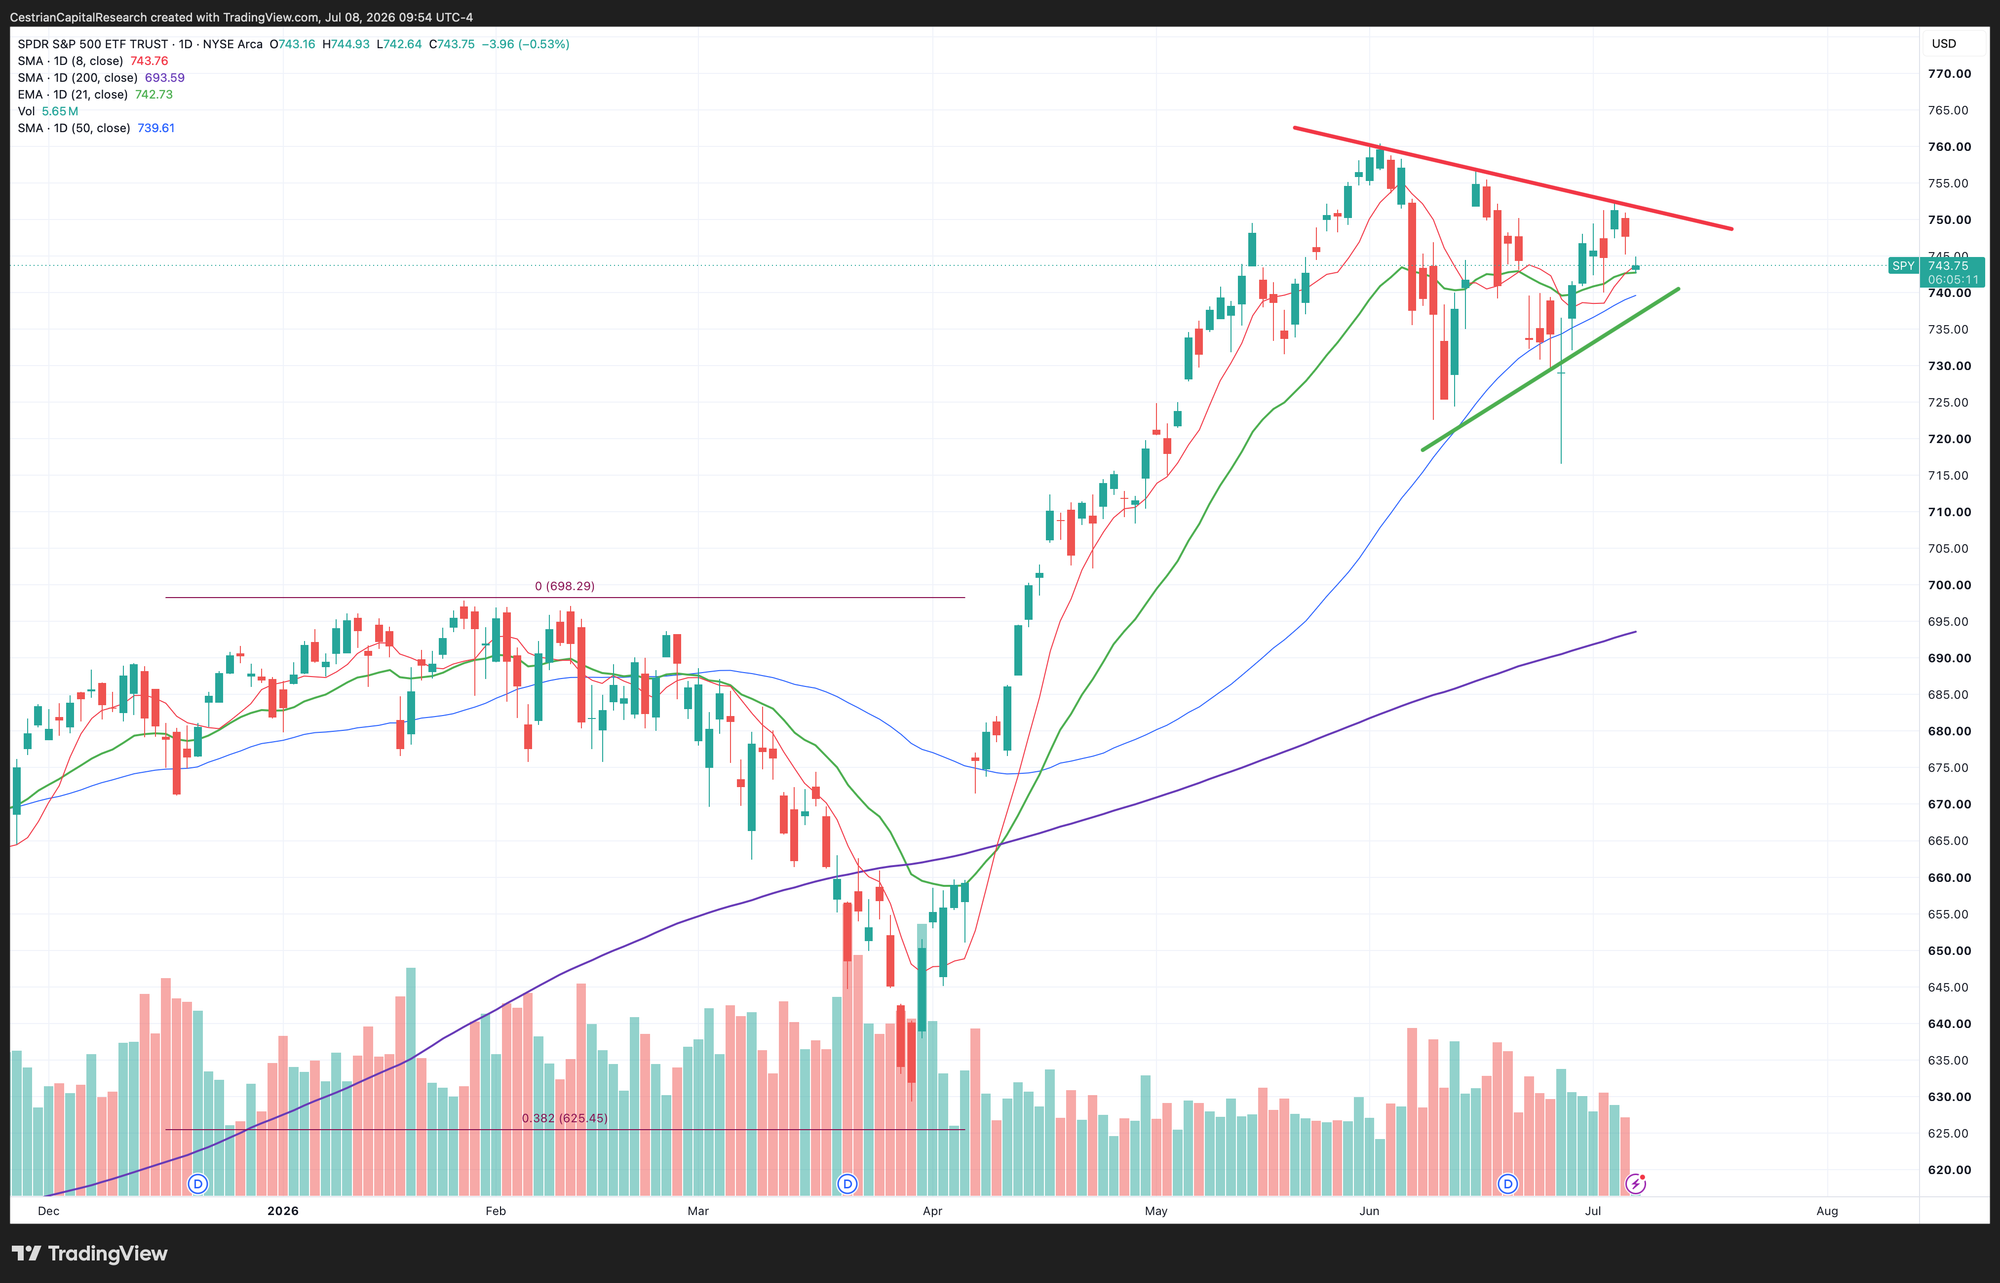
Still consolidating in the compressing range shown; over the 21-day EMA for now so retaining a bullish look.
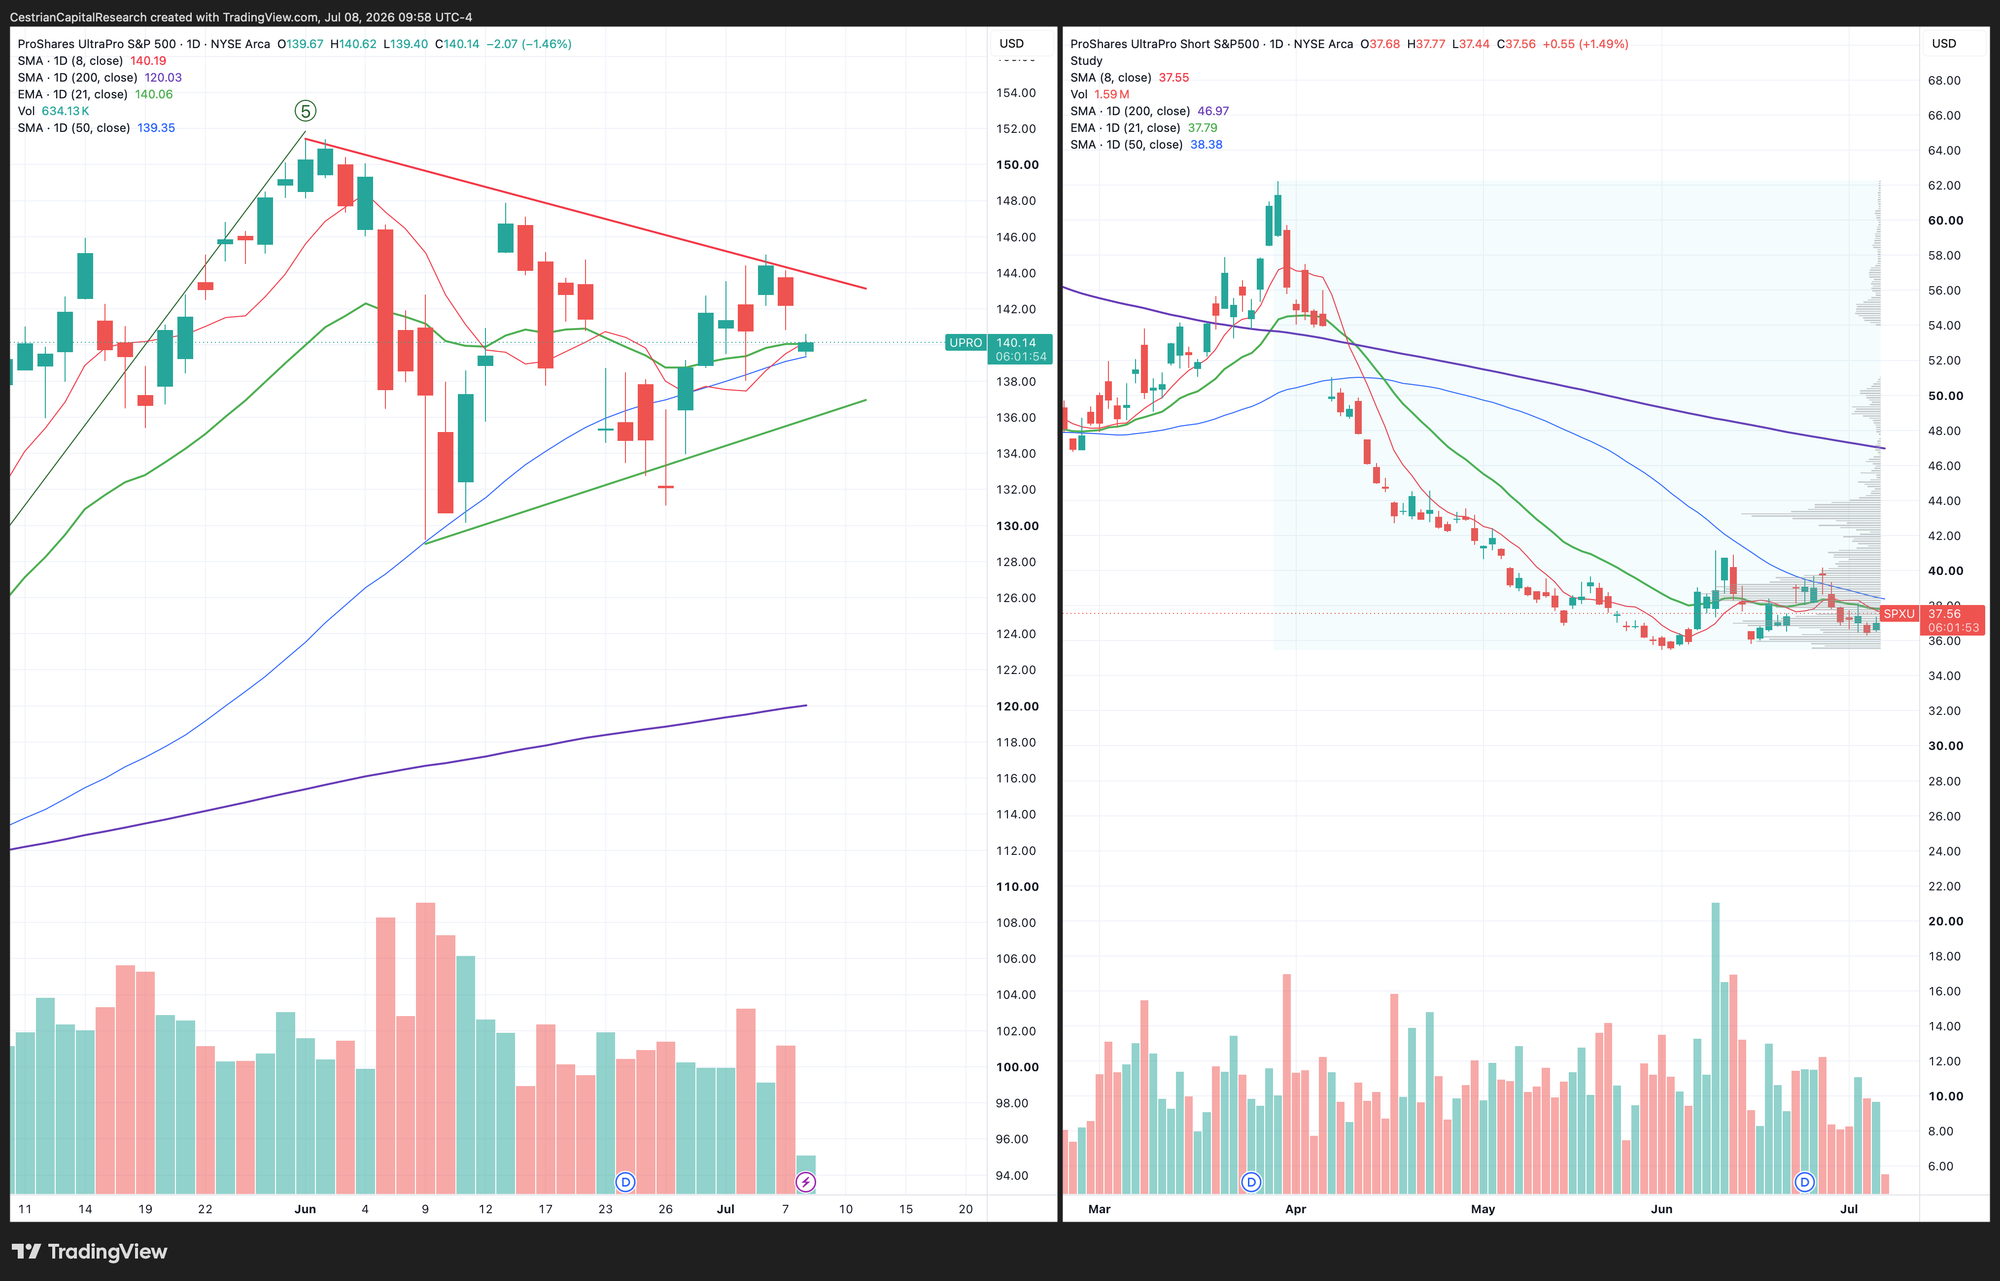
3x Levered Long / Short ETF - UPRO, SPXU
Note - Leveraged ETF. Read the fund documentation if you are considering using this instrument.
UPRO lost its 21-day EMA; remains in consolidation mode as you can see. Overall directionless in the levered SPX ETFs I would say.
For algorithmic signals in the S&P500, consider SignalFlow AI Long-Only For $SPY.
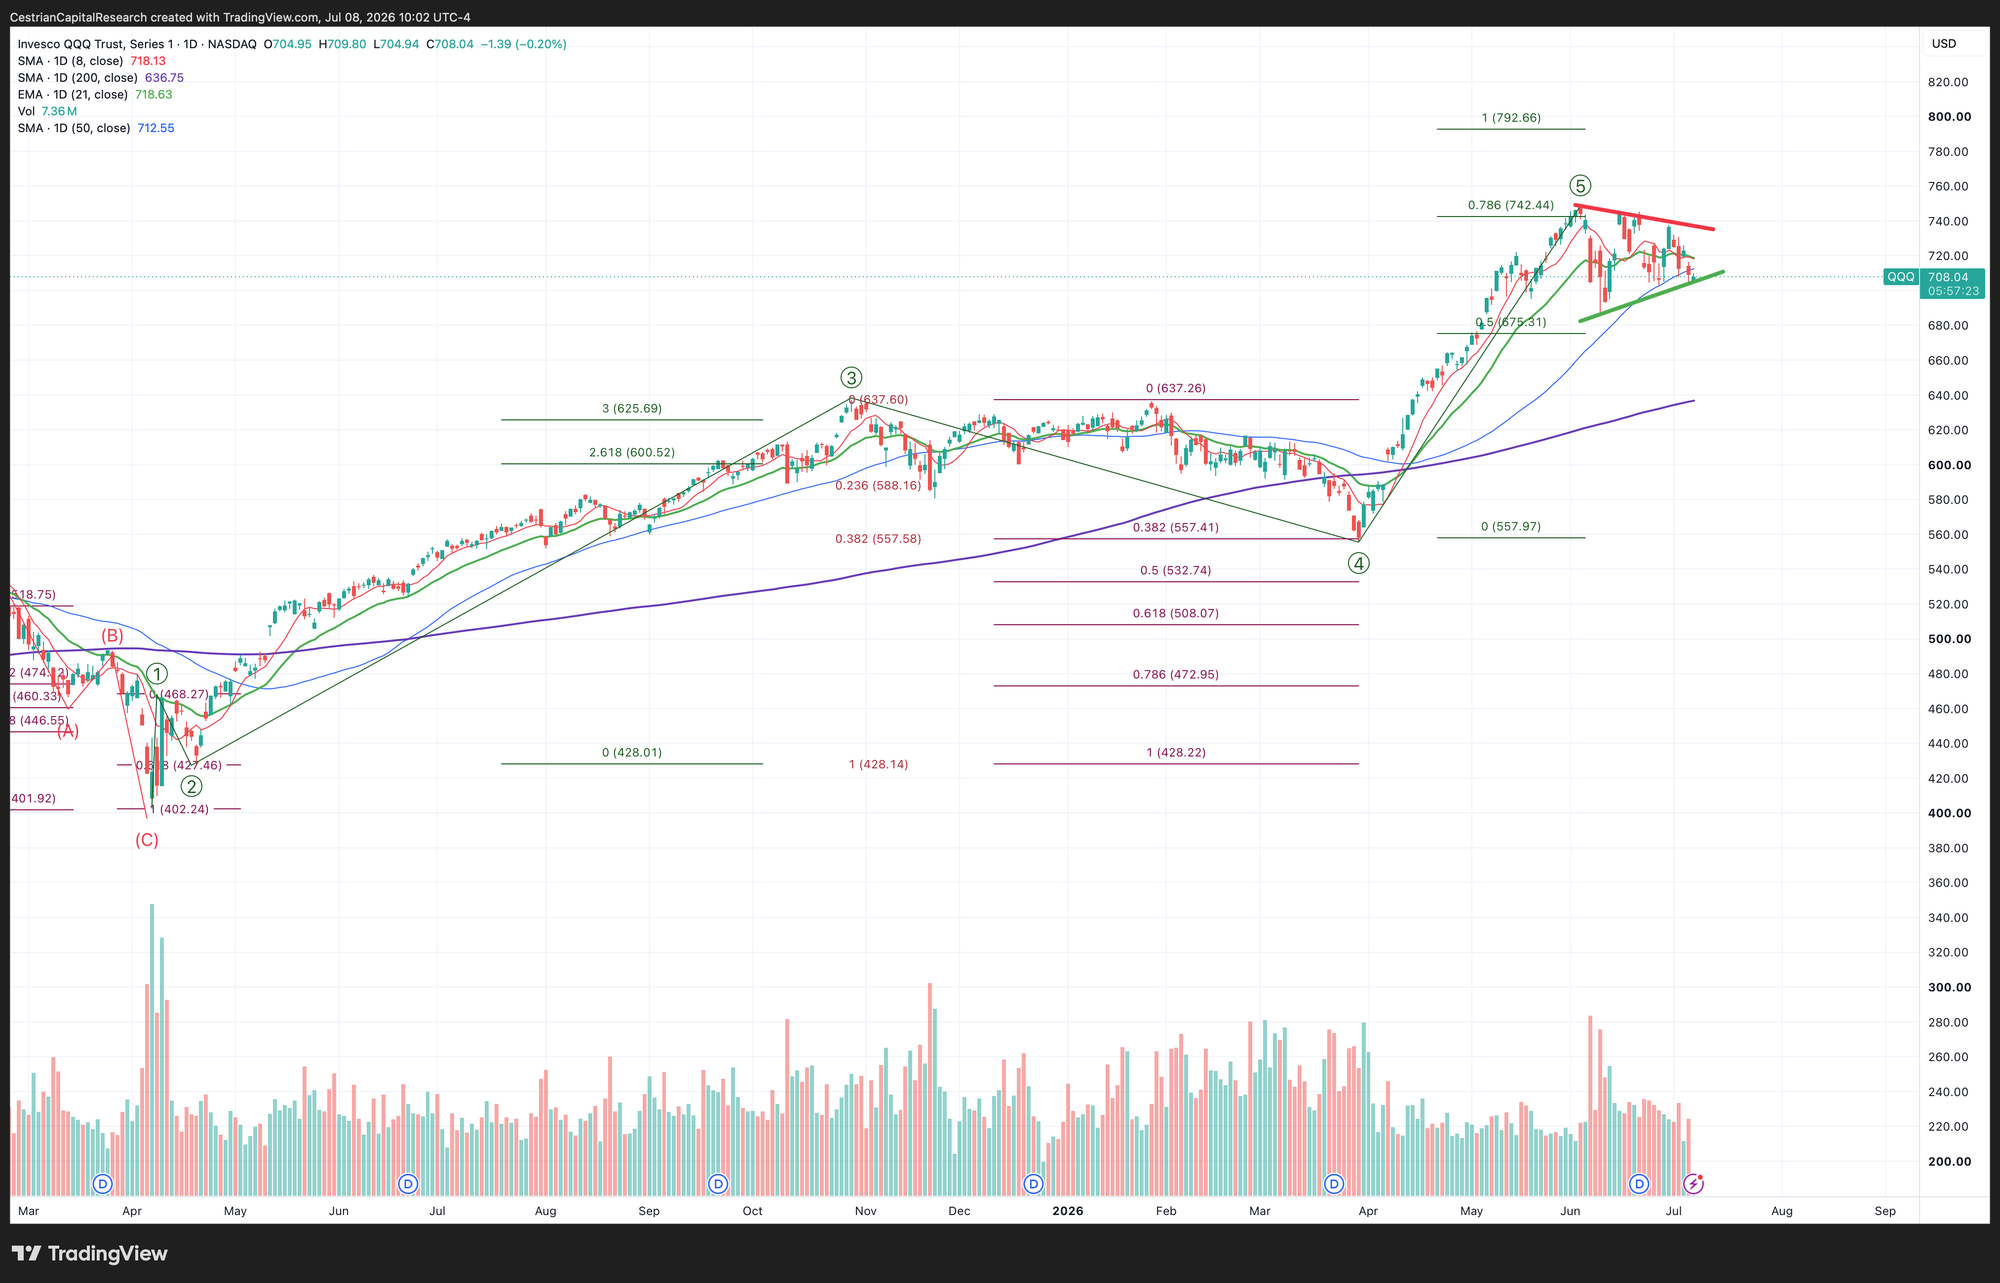
Nasdaq-100 / QQQ / TQQQ
Again - failed at the first test of that 200% Wave 3 Extension. Re-test on the way I think.
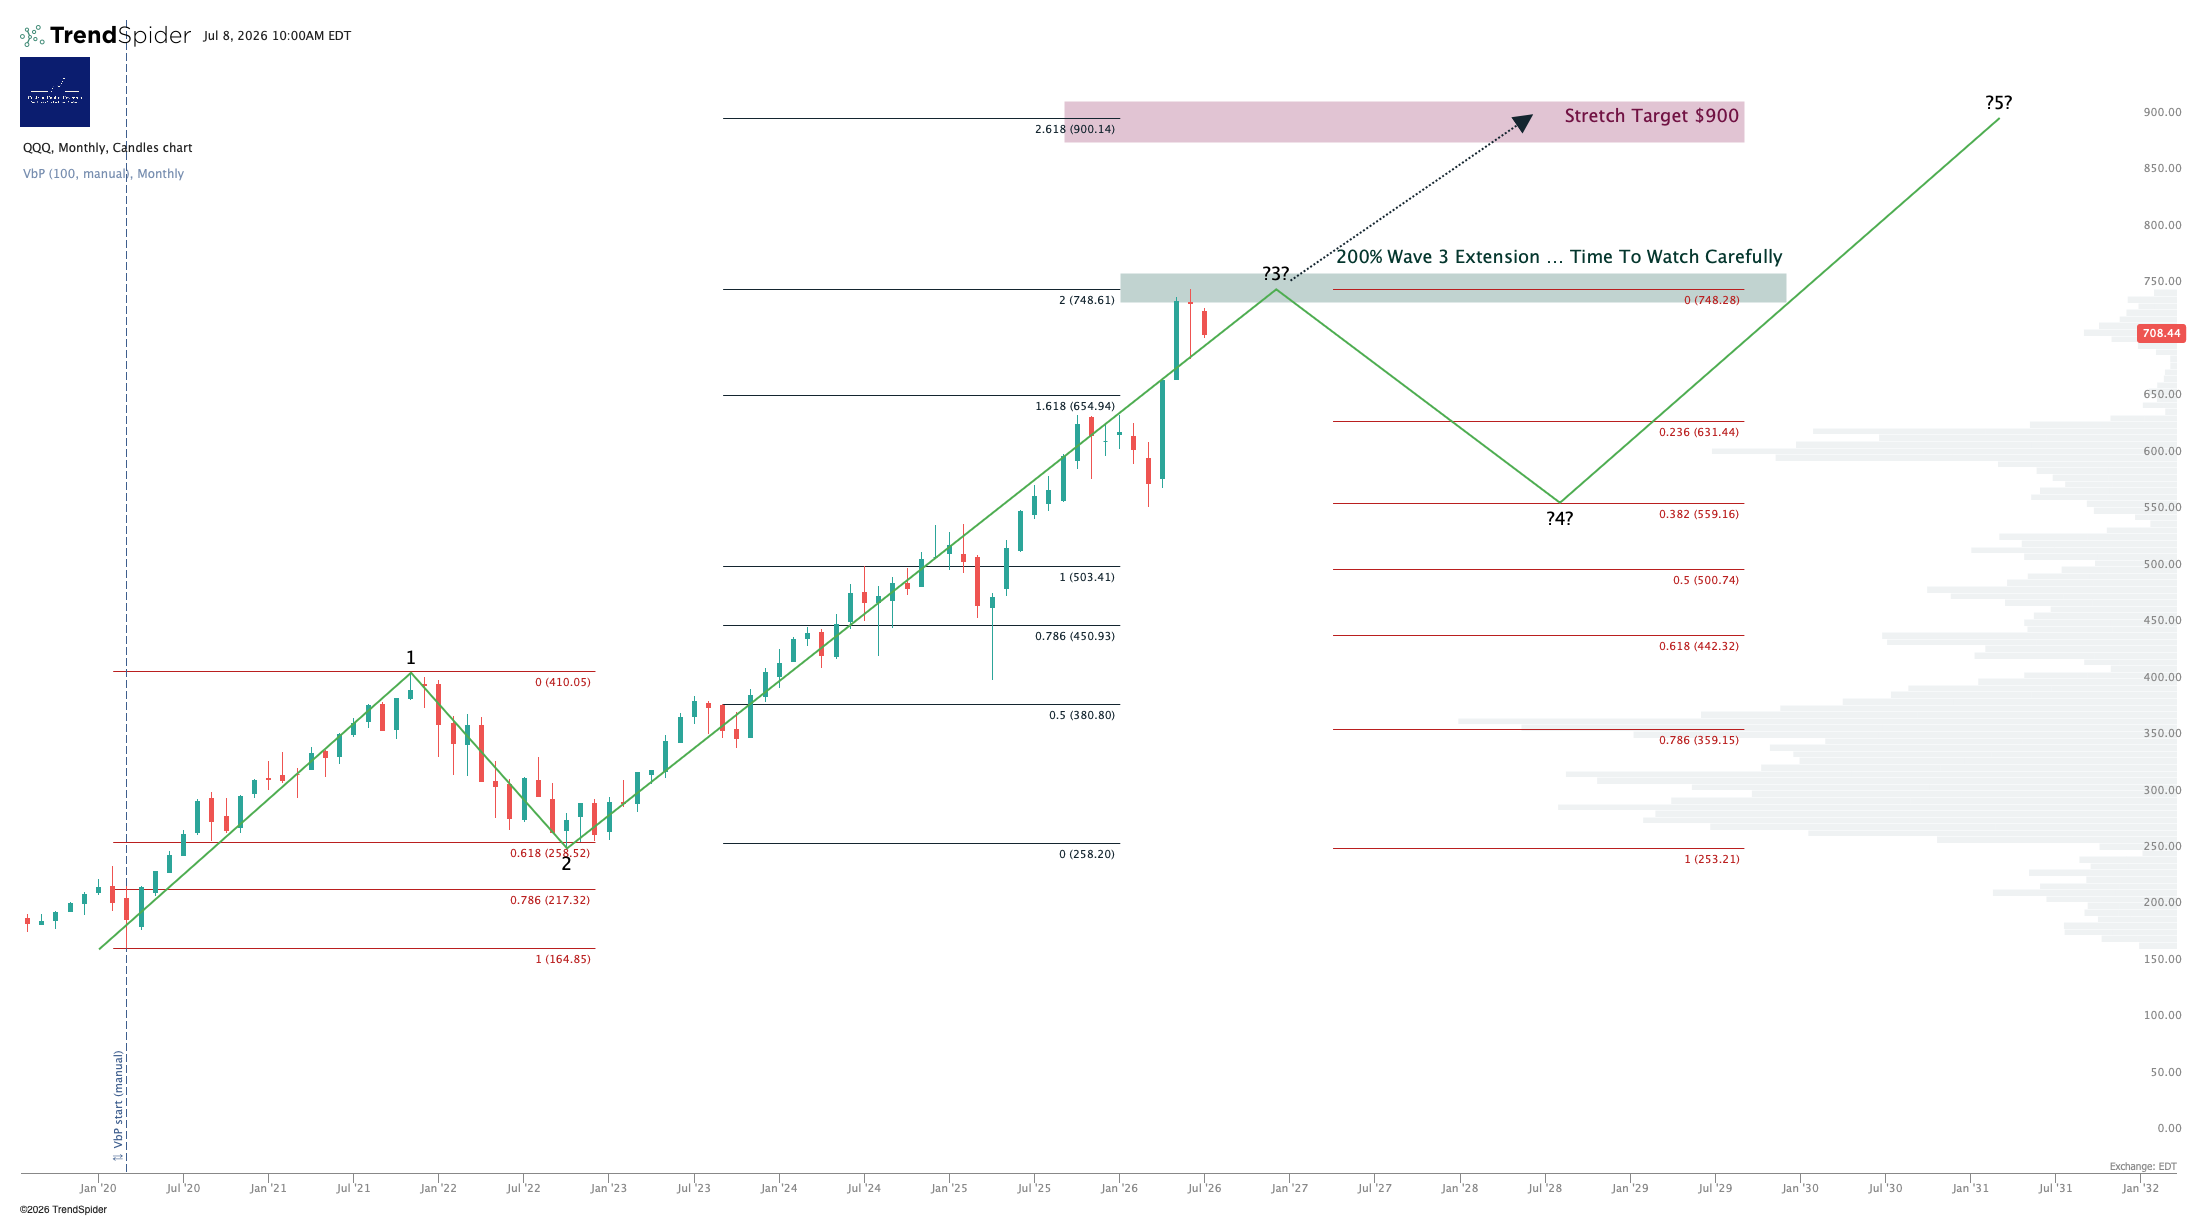
Still consolidating but below all the short-term moving averages we use; doesn’t look wonderful at this point.
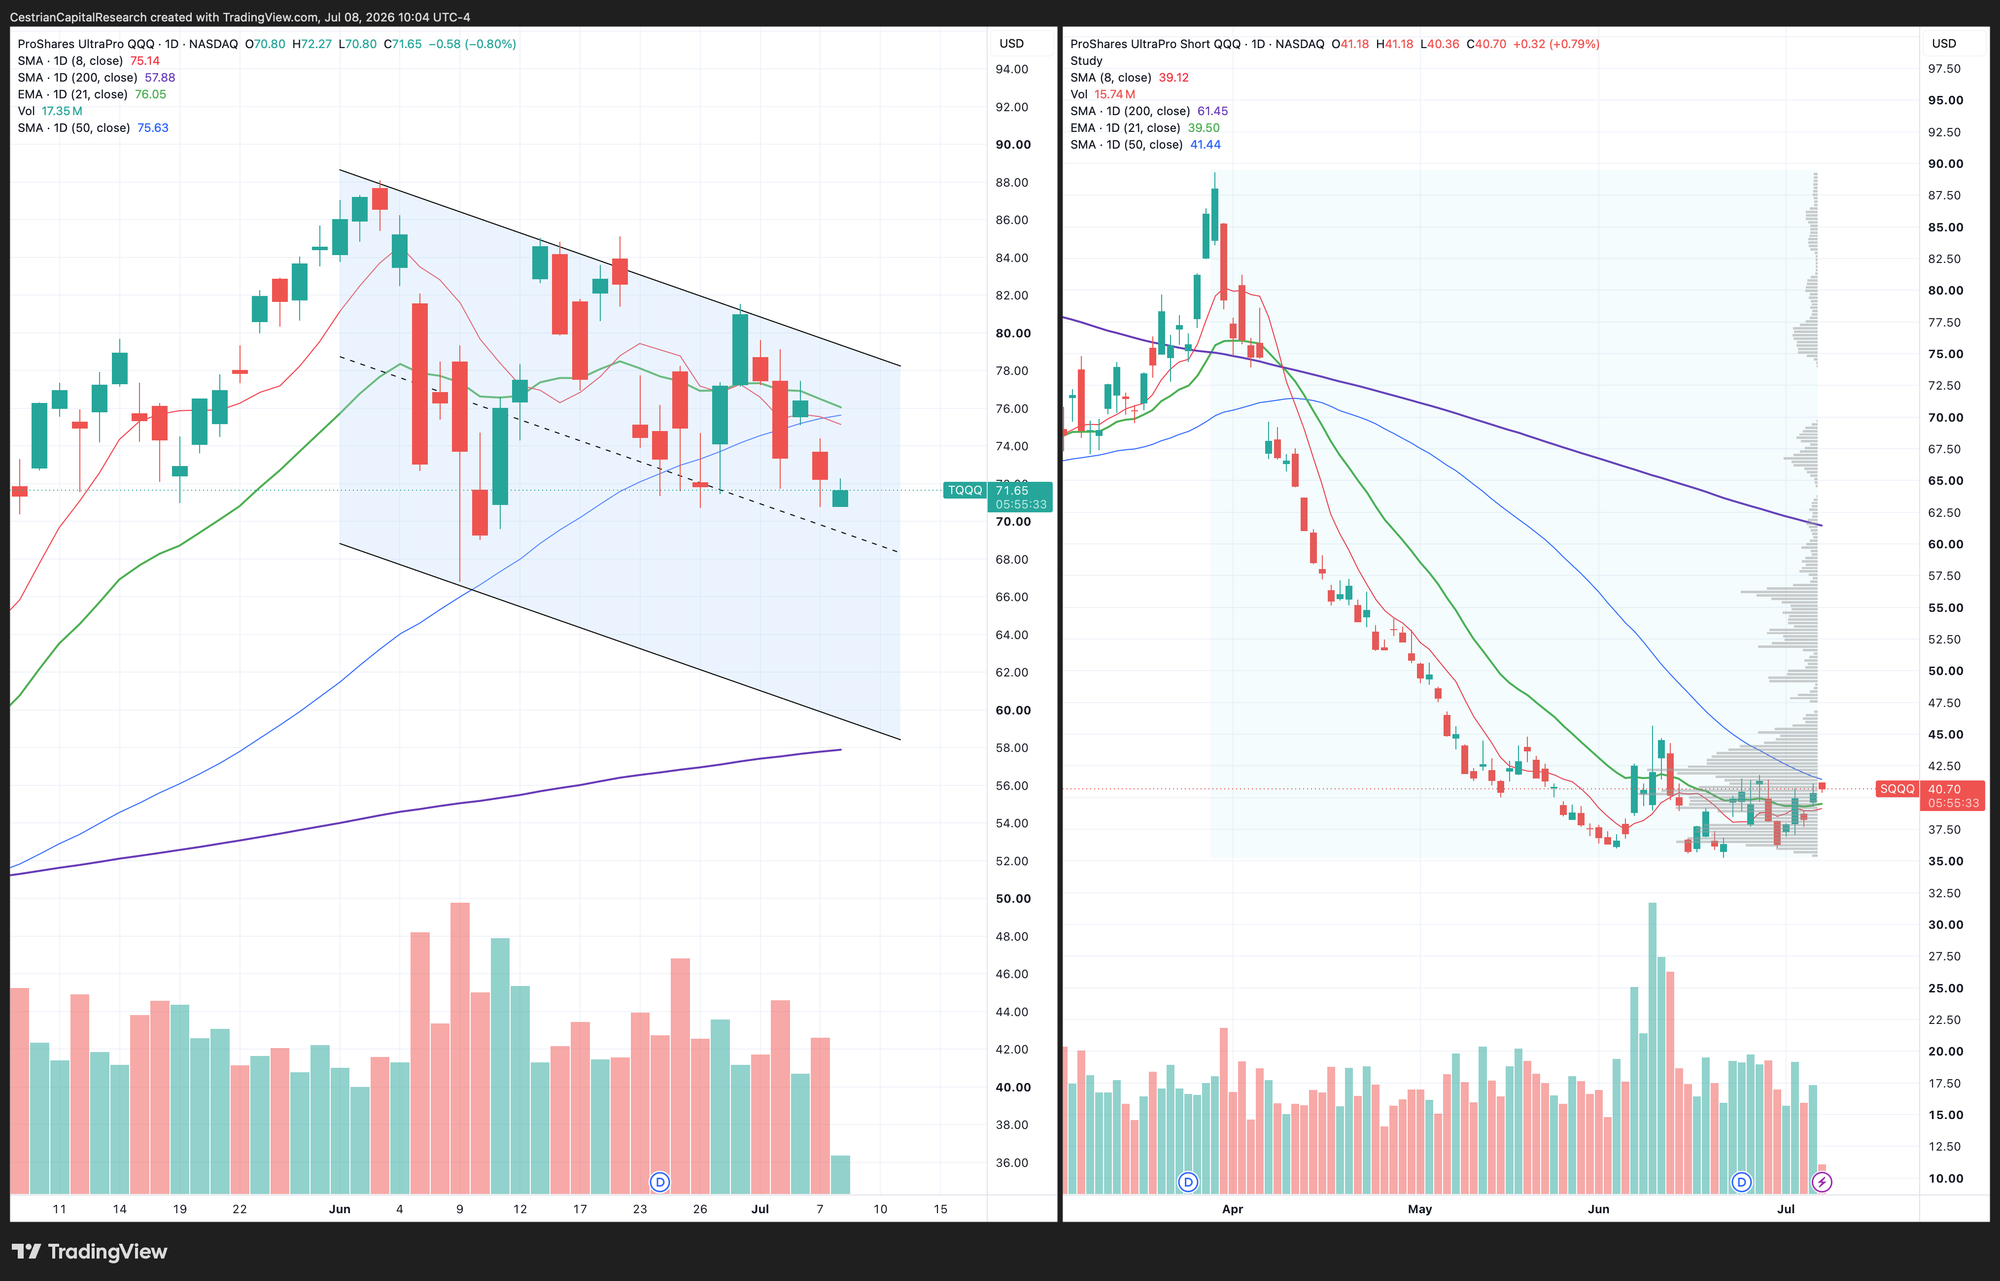
Levered Nasdaq - TQQQ Long / SQQQ Short
Note - Leveraged ETFs. Read the fund documentation if you are considering using these instruments.
A clear downtrend in TQQQ and volume x price picking up in SQQQ. If the NDX dumps from here we can’t say we weren’t told.
To improve your ability to make money whether the market is grinding upwards, or in freefall downwards, join our upgraded long/short service.
Dow Jones / DIA / UDOW
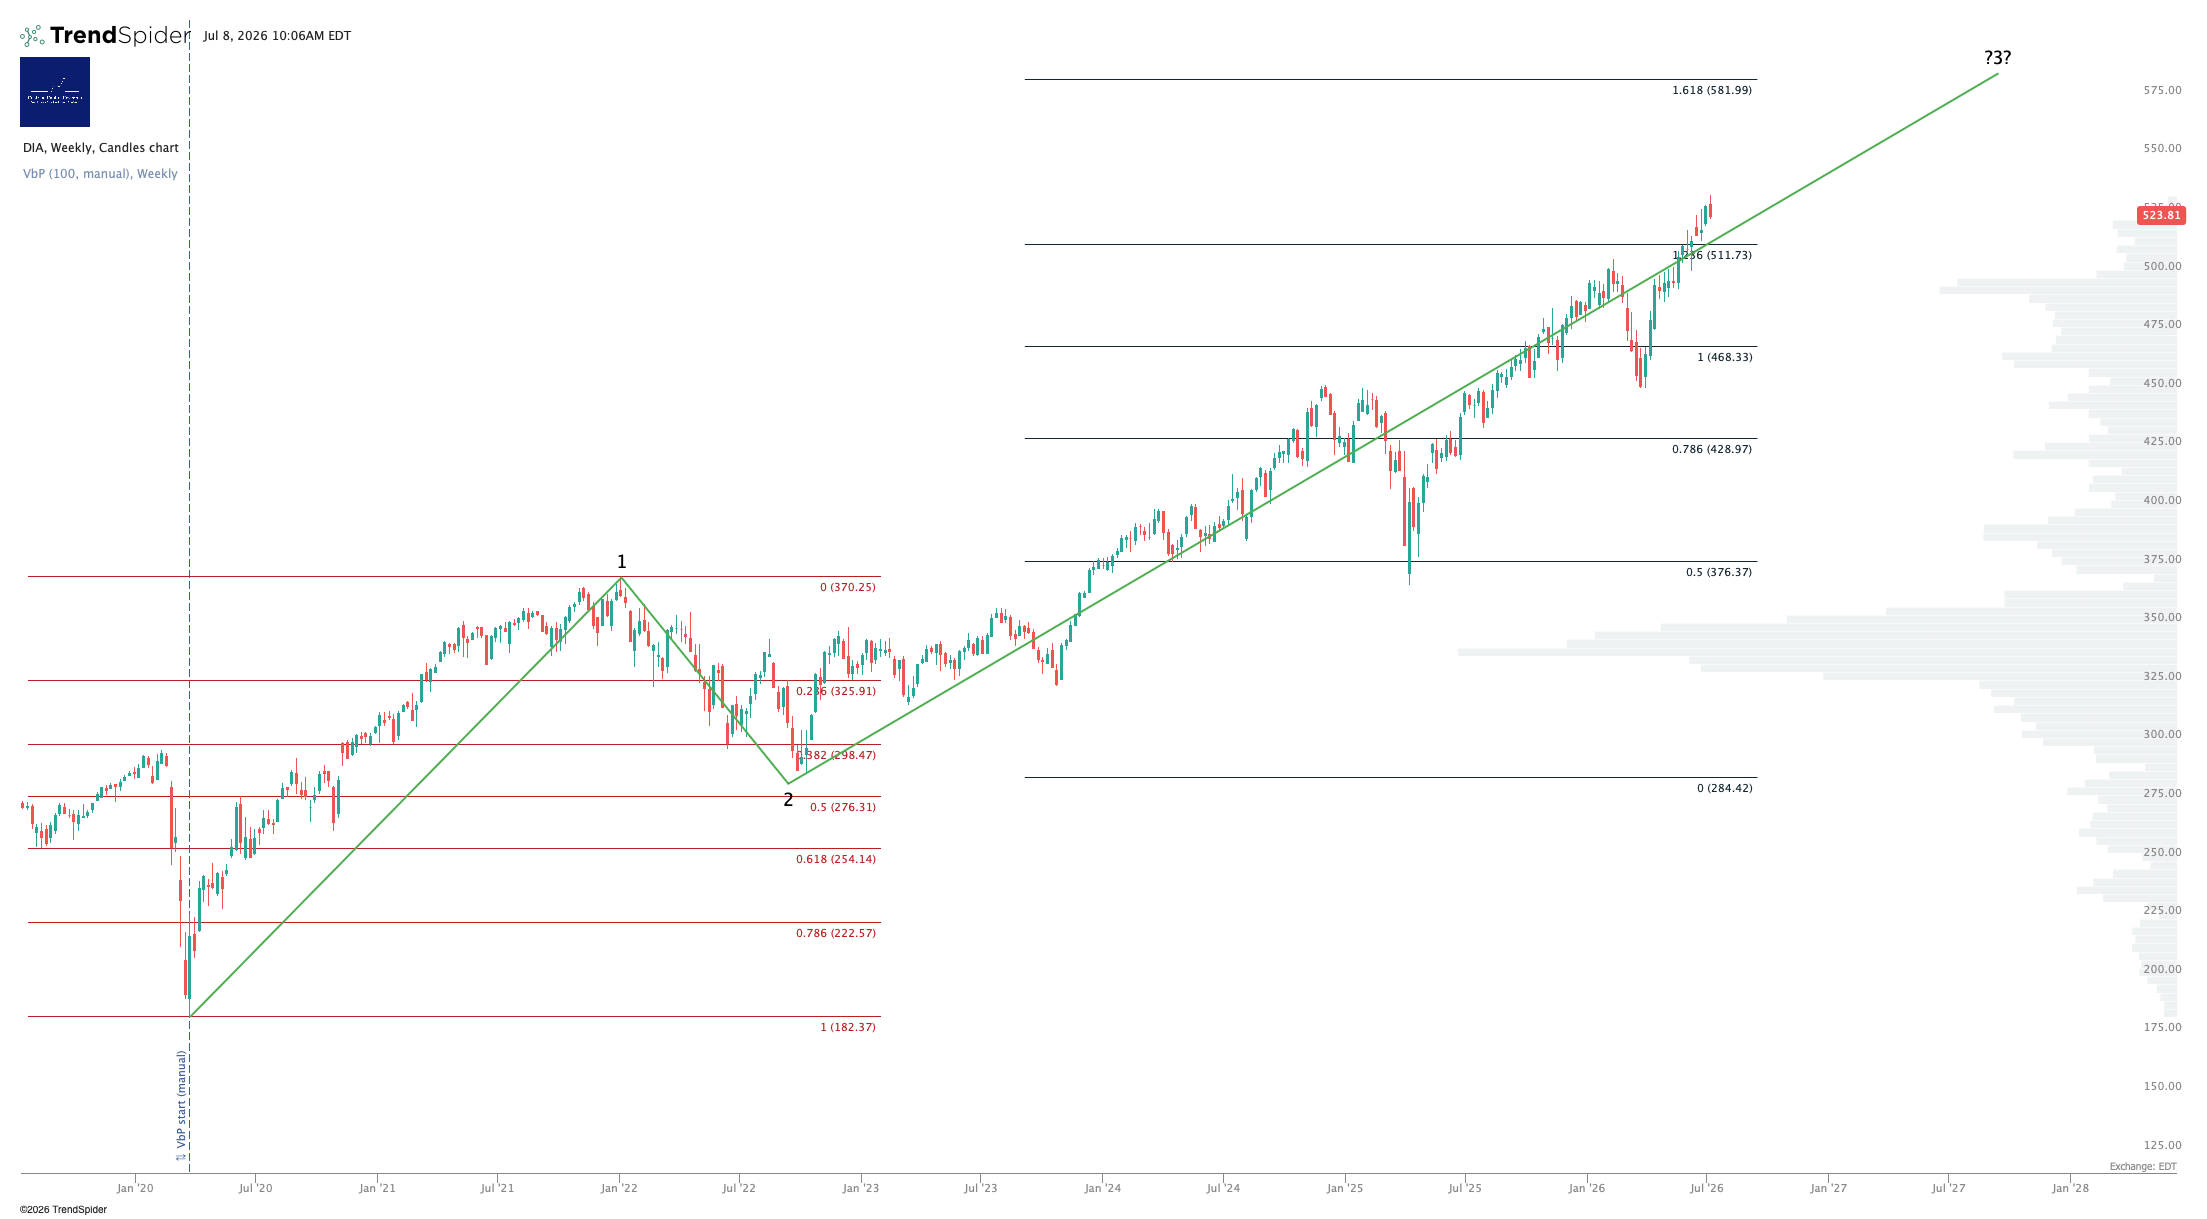
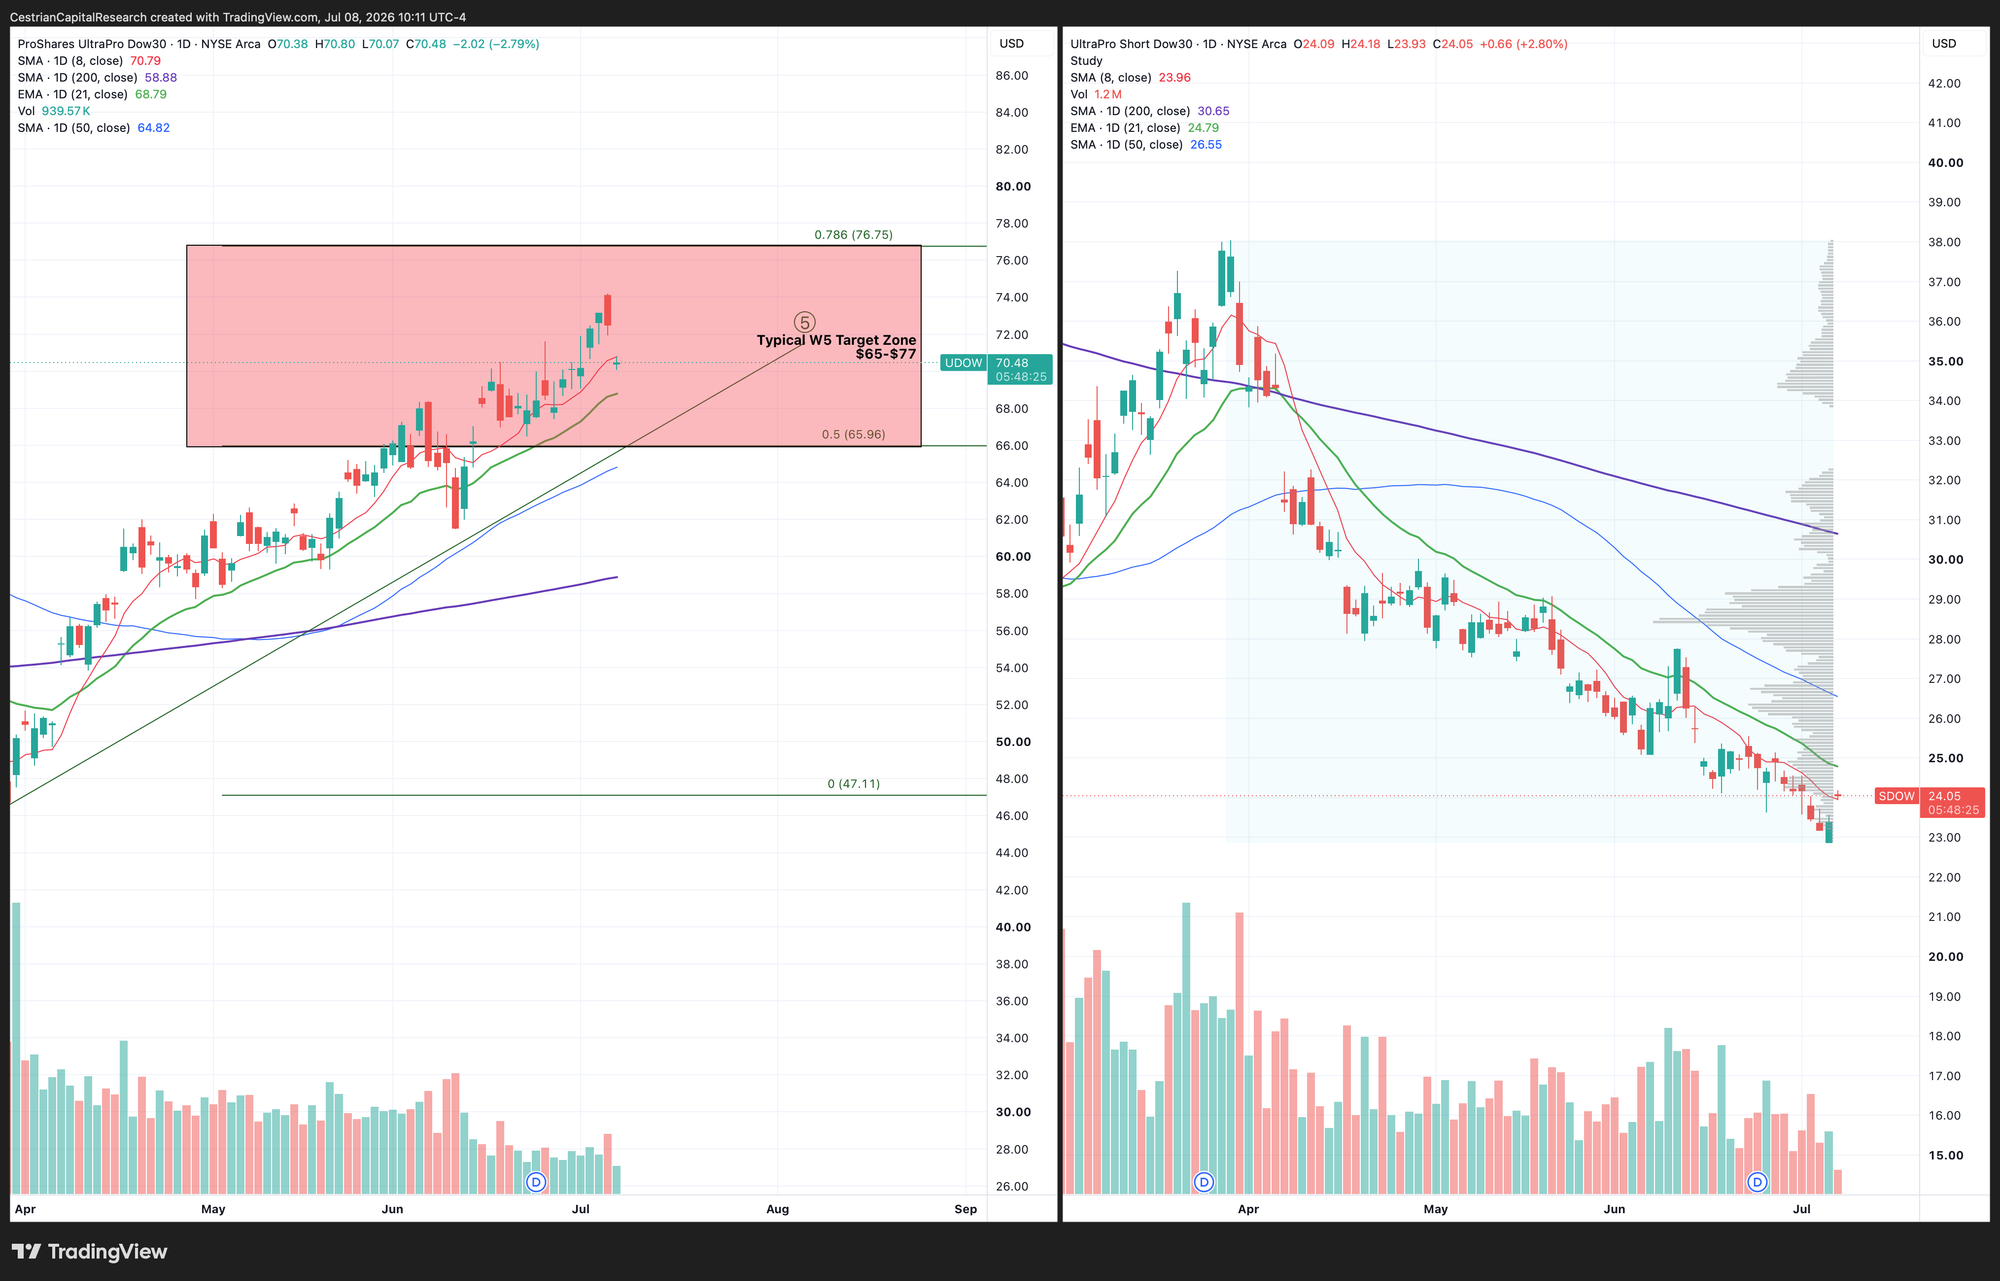
I wonder if the retrace has begun in the Dow.
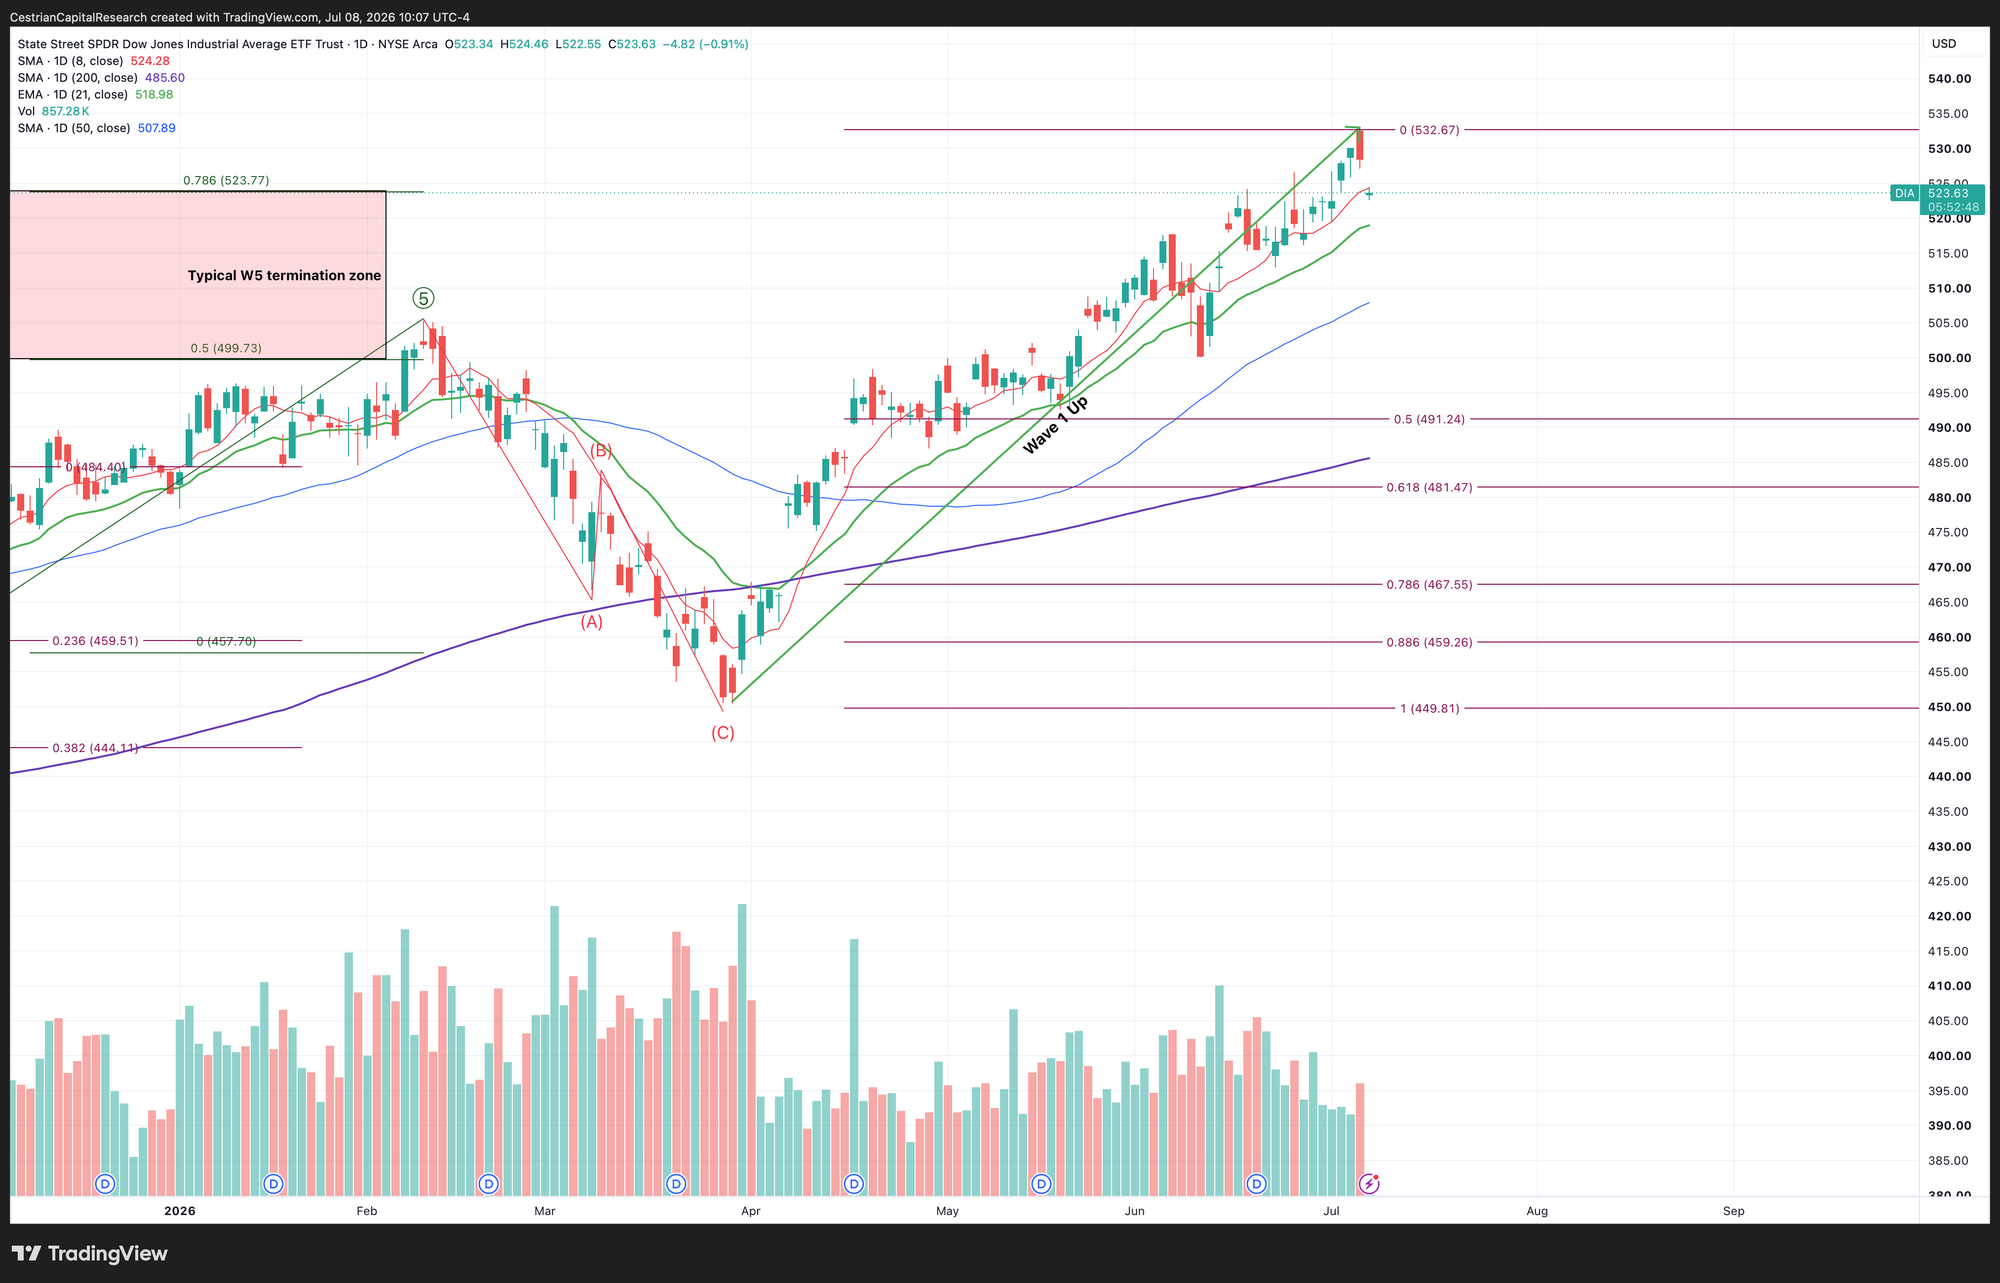
3x Levered Dow - UDOW Long / SDOW Short
Note - Leveraged ETFs. Read the fund documentation if you are considering using these instruments.
I opened a position in $SDOW this morning with a fairly tight stop; if the Dow makes new highs, my SDOW position will stop out with modest losses. If the Dow does put in a retrace of recent gains (see the DIA chart above) then there will be some value to be had in SDOW. I used a trailing stop so I don’t have to worry too much about exiting the short exposure if it does start to make money.
Here’s the disclosure from our Inner Circle service.

Sector Rotation
I flagged XLE as a long opportunity in this note on Monday. It’s working so far. A drop below the 200-day SMA (purple line on the chart below) would tell you it had stopped working!
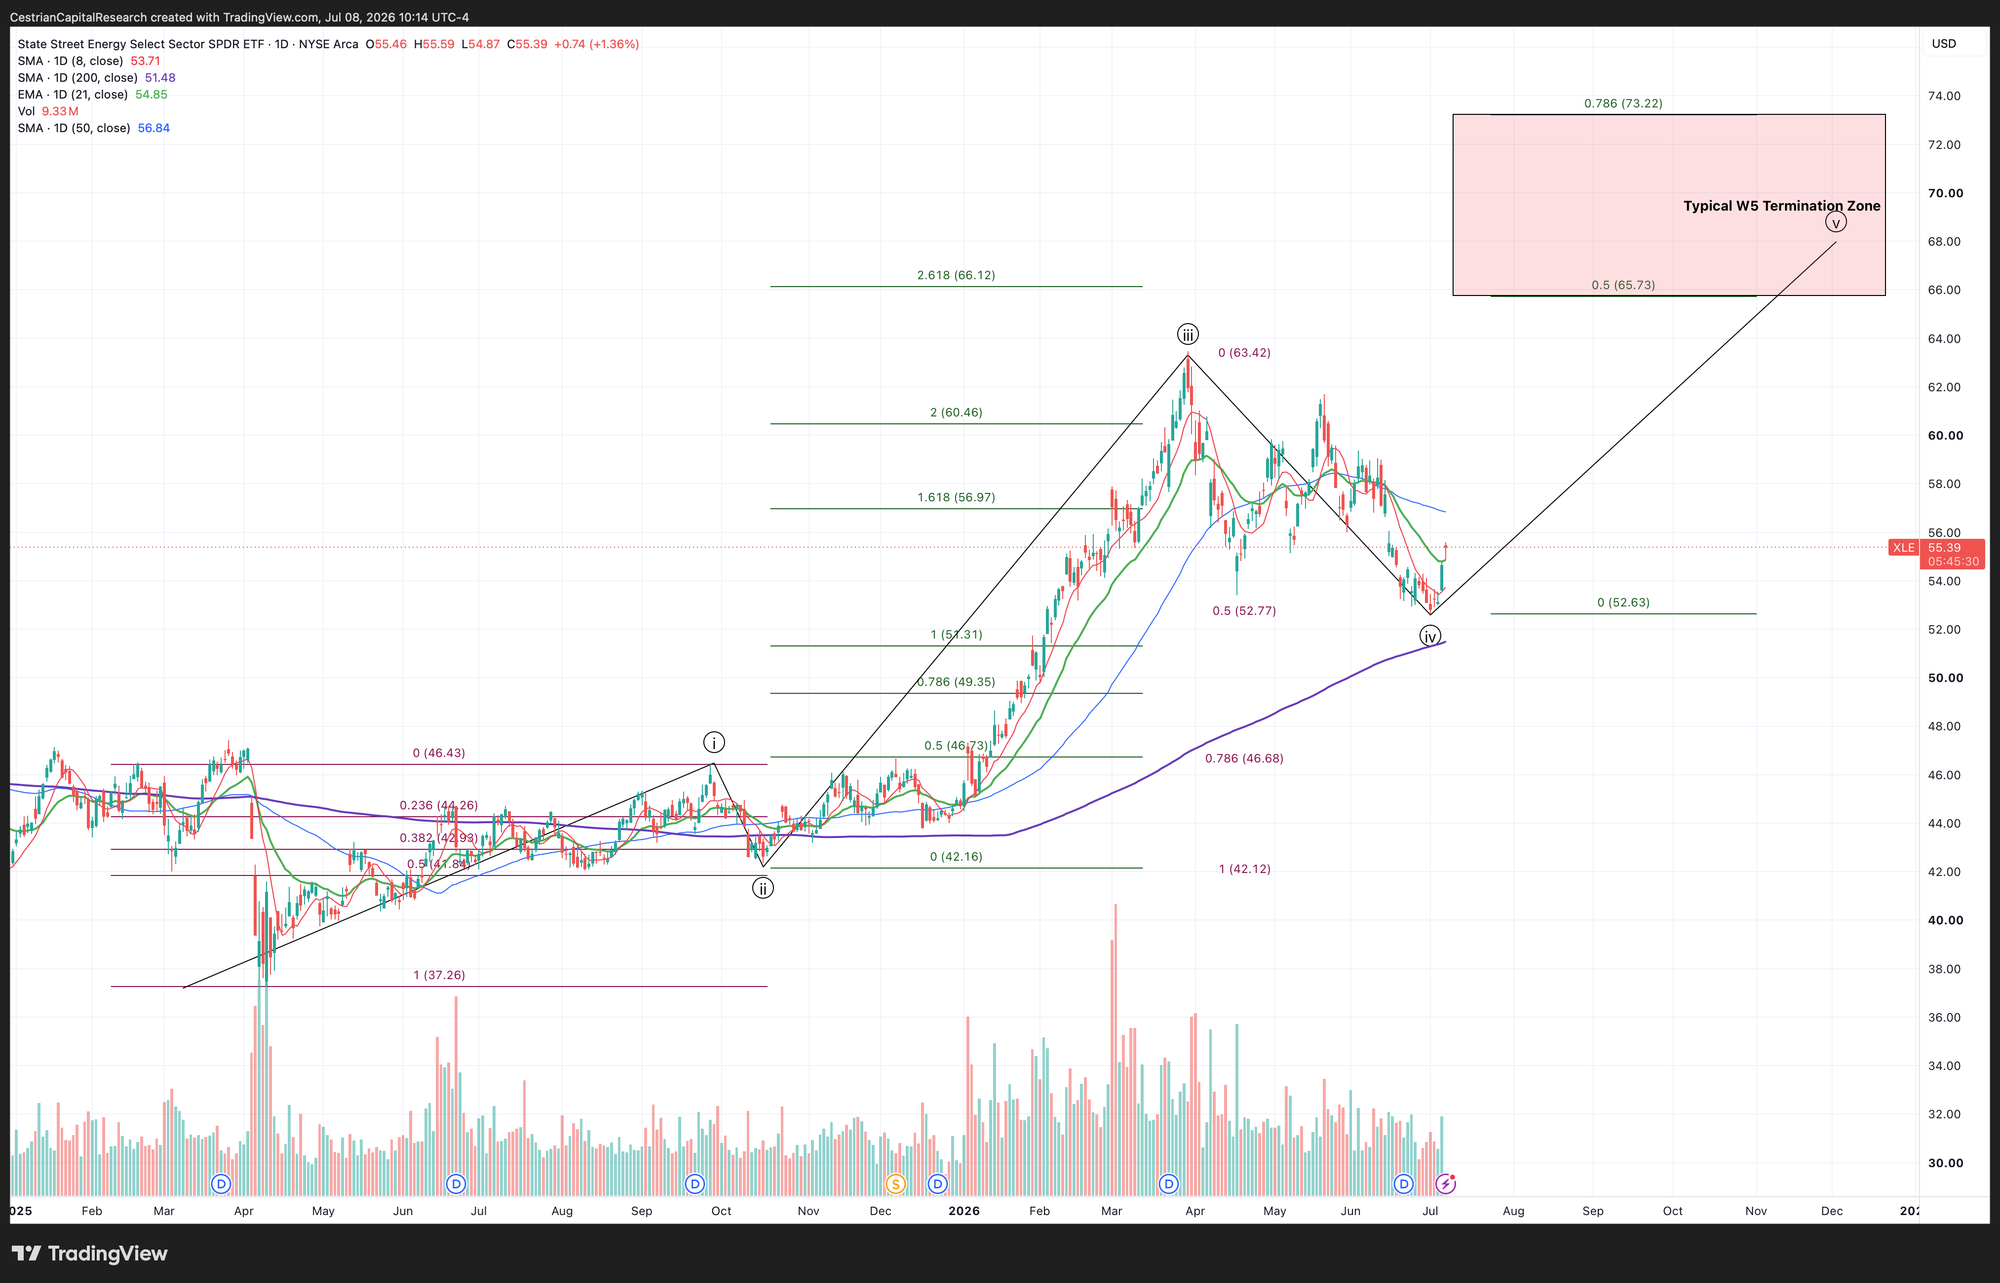
Disclosure - long sector ETFs according to our SignalFlow AI Sector Rotation service (see here)
International Equity Indices
The inevitable bear market in Korean equities - heralded (of course!) by the SK Hynix New York ADR listing.
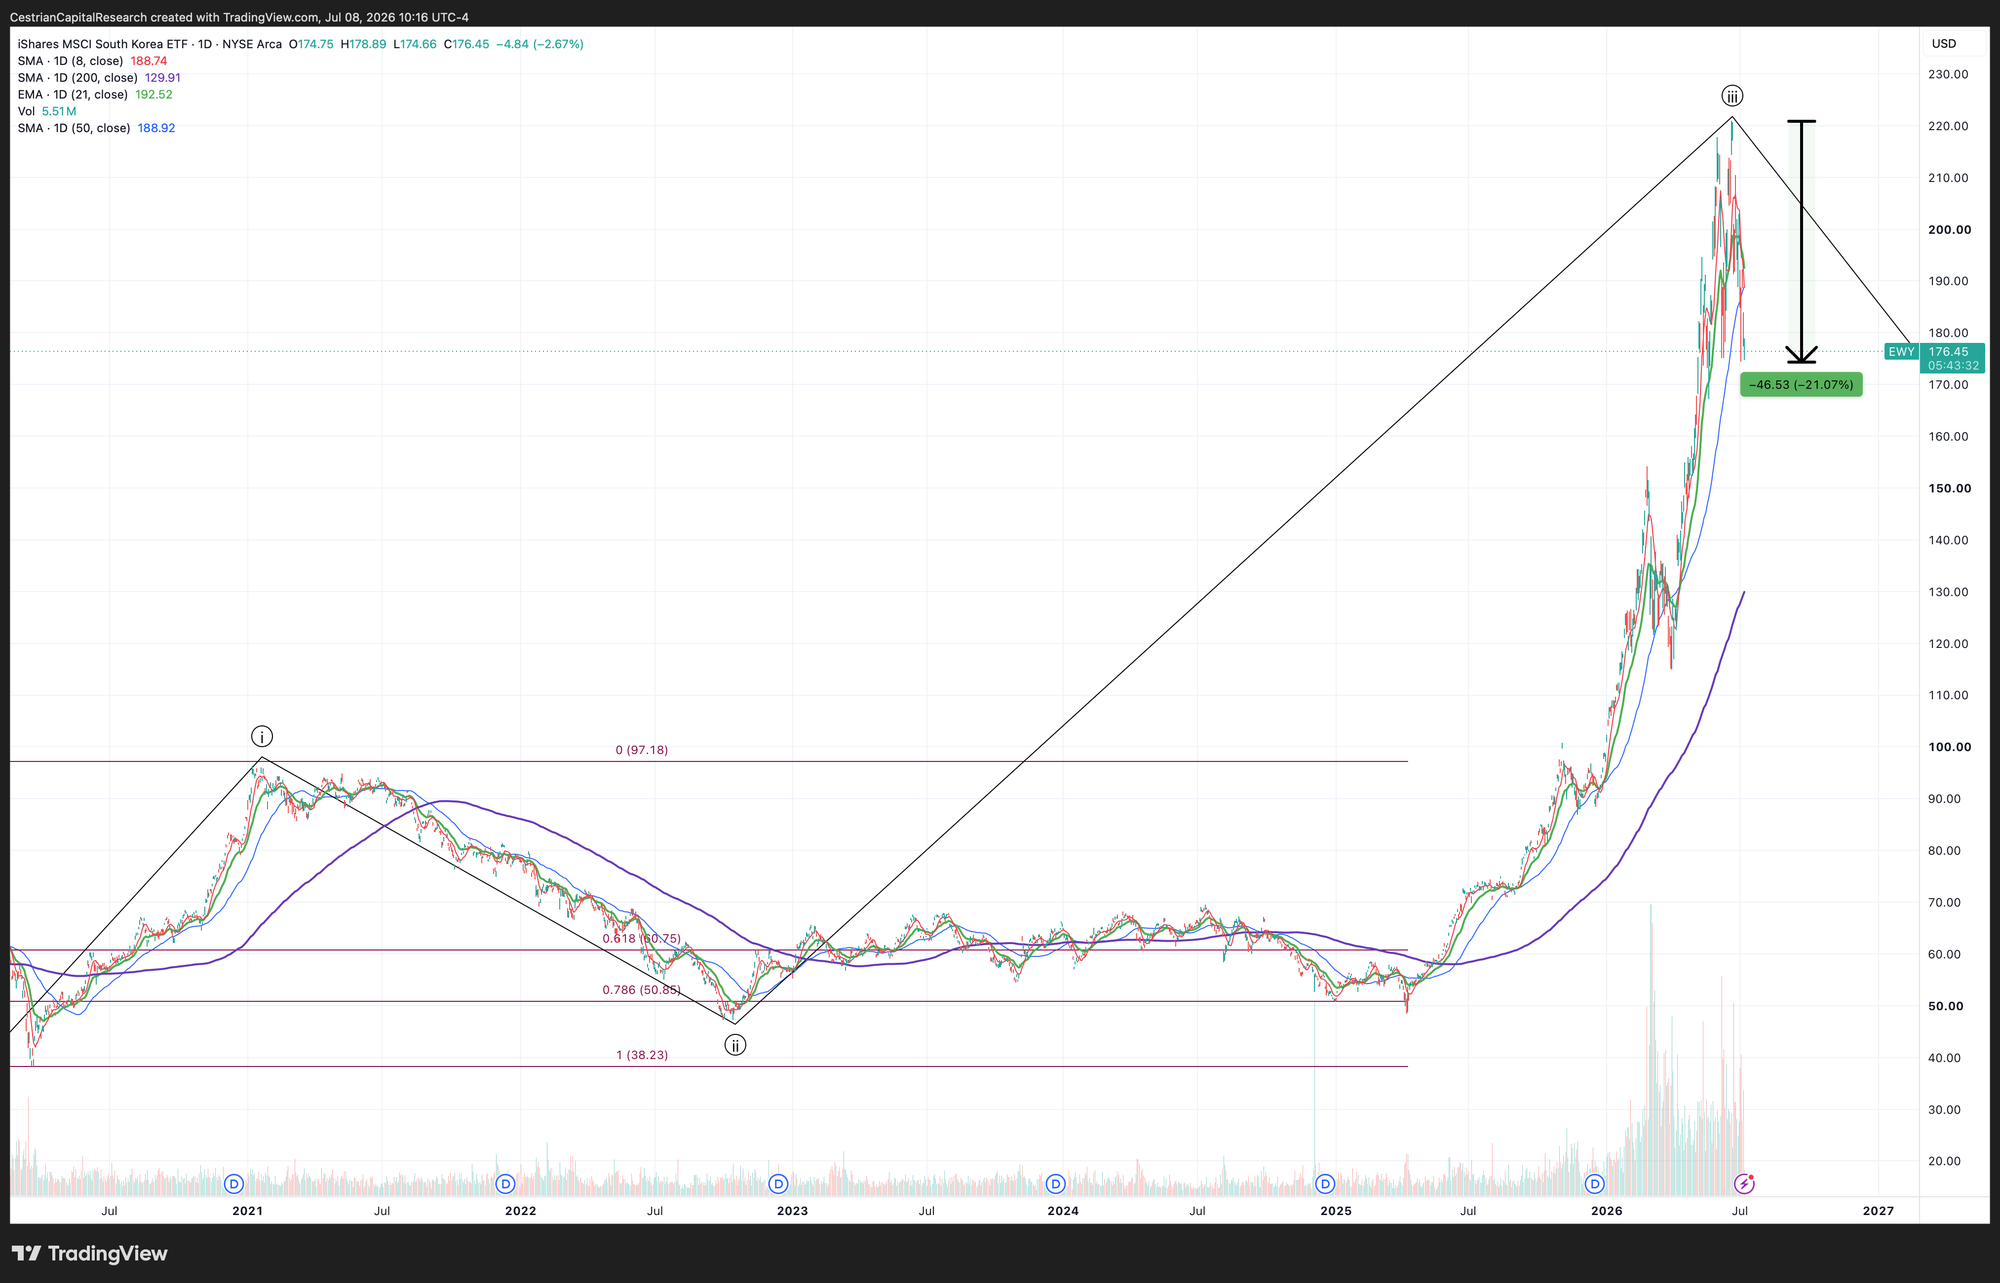
DISCLOSURE - I’m long country ETFs per the SignalFlow Global service.
Want help rotating through country ETFs to stay ahead? Take a look at SignalFlow Global.
Alex King, Cestrian Capital Research, Inc - 8 July 2026.