
New From Cestrian Capital Research: Our “Cestrian Options” Service.

DISCLAIMER: This note is intended for US recipients only and, in particular, is not directed at, nor intended to be relied upon by any UK recipients. Any information or analysis in this note is not an offer to sell or the solicitation of an offer to buy any securities. Nothing in this note is intended to be investment advice and nor should it be relied upon to make investment decisions. Read our full disclaimer, here.
Introduction – Alex King, CEO, Cestrian Capital Research, Inc
There are, it should be said, approximately 1.3 million options services available on the Internet. Most of them involve taking sizable risk and hoping for a good outcome. Hope isn’t really our style; we like to know the best and worst case outcomes of the trade ideas we publish, so that anyone who chooses to follow them knows how the idea should work and how to make it their own trade.
Our new “Cestrian Options” service is built this way. Led by longtime options trader Tony Pronk, it focuses on defined risk/reward trades. You can read about the goals of the service here.
In the meantime, we wanted to walk you through a typical trade idea setup in the service. I’ll hand you over to Tony for this.
$NVDA x The 200-Day
Tony Pronk, Lead Analyst, Cestrian Options
Last week we noted how $NVDA was trading at a critical juncture, just above its 200 SMA, make-or-break for this massively profitable business. We think chances are NVDA ends up surprising to the upside, but if it does not, we want it to be a small disappointment, nothing more. So, what's our strategy to go with that thesis?
Enter the broken wing butterfly (BWB) trade.
Simply, a BWB is two strategies in one. Let’s break it down.
On the one hand, we have a bullish call debit spread; you buy a call, and sell one with a higher strike price. Compared to a simple long call trade, this reduces cost and the negative effects of time (as you know, option contracts lose value due to theta decay as expiration approaches), at the expense of some upside.
In the worked example below, this involves:
- Buying a $220 strike call
- Selling a $240 strike call
- Each with the same expiration date
The profit and loss graph looks like this, at expiration:
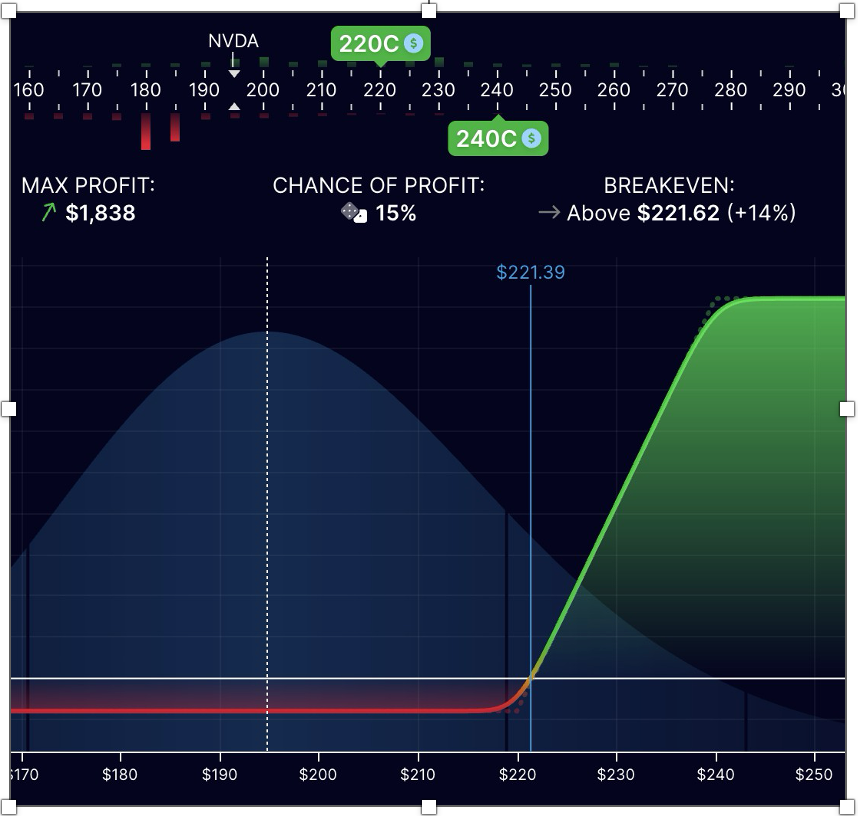
At the time of transaction this was priced at $1.62 quote price, or $162/contract – as you know options trade on the basis of a minimum of 100 shares under contract, meaning you must multiply the quoted price by 100 to calculate the actual dollar cost of each contract.
Now, using the ‘Broken Wing Butterfly’ strategy, we can reduce the cost of this trade. We can do this by selling a wide bearish credit spread ‘on the other side’ of the debit spread; call credit spreads are the exact opposite of call debit spreads.
In the worked example below, this involves:
- Selling a $240 strike call
- Buying a $270 strike call
- Each with the same expiration date
The profit & loss setup looks like this, at expiration:
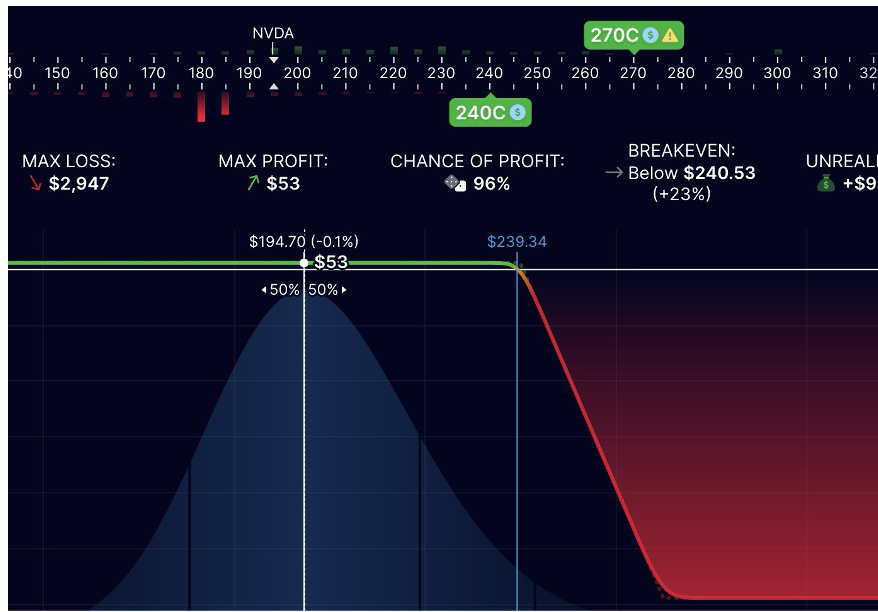
That gives us $0.53 credit, or $53/contract and reduces the cost of both together to $1.09, or $109 which is also our max risk per contract to the downside. We refer to this max loss per contract as the amount “on risk”.
So, putting it all together, this Broken Wing Butterfly strategy involves:
- Buying a call at a lower strike ($220 in this case)
- Selling two calls at a middle strike ($240 in this case)
- Buying a call at a higher strike ($270 in this case)
- Each with the same expiration date.
It models as follows, this time the current profile, not at expiration. (I show this ‘current profile’ on purpose because in the end we have no intention of keeping the trade on until expiration which is in general a bad idea. More on that topic in a future post).
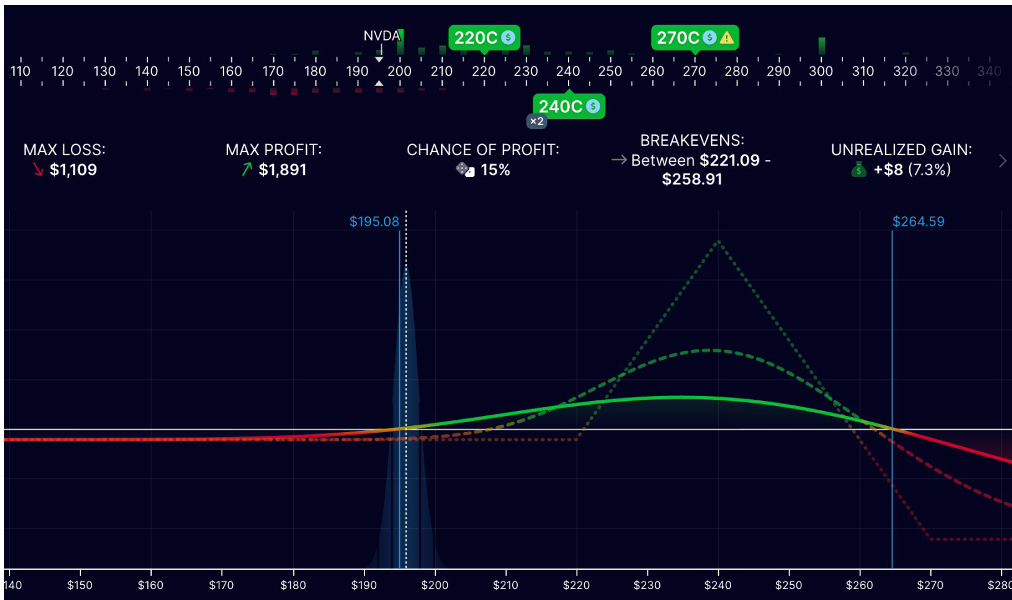
Ok so with that, we now have a relatively cheap set up which can quite easily gain 100-200% on the amount we have risked if NVDA makes a push up to $220/230, or, we lose max $109/contract to the downside.
Is there a snag? Yes, there always is: there is upside risk! If NVDA motors past the 'tent' in the returns curve above,the P/L begins to taper off and eventually goes negative. Because the spread is wider on the credit side – a $30 difference between the middle and the higher strikes of the strategy vs. a $20 difference between the middle and the lower strikes - the risk to the upside is much larger than to the downside to the tune of $1100 at expiration – because at expiration the bear credit spread will be at max loss and the bull debit spread at max profit. And the difference between those is in this case $1100/contract. By the way an easy way to calculate this is the difference of the width of each spread + the debit paid.
However, this is NVDA; it is not realistically going to jump 30 to 40% in one day, alas, those times are over for NVDA. So, if and when NVDA makes a move into our 'tent', we simply close it for 100 to 200% or more on the amount at risk, depending on when it moves.
Remember: whoever tells you that trading options is easy, is lying or ignorant or both, but with some help, a willingness to learn and practice, these considerations do eventually become second nature.
In our live service, we already flagged the opportunity to take 30% profit on half the position after a couple of days in this trade. (I took such gains personally. Most trade ideas we publish are those which I actually trade with real money). As a result, there is now very little downside risk in the trade and we have until August for Jensen to showus what he's got. We are waiting, but we are not stressed.
Tony Pronk, Lead Analyst, Cestrian Options - 6 July 2026