
NO PAYWALL: What On Earth Is Going On In Crypto???

DISCLAIMER: This note is intended for US recipients only and, in particular, is not directed at, nor intended to be relied upon by any UK recipients. Any information or analysis in this note is not an offer to sell or the solicitation of an offer to buy any securities. Nothing in this note is intended to be investment advice and nor should it be relied upon to make investment decisions. Read oursfull disclaimer, here.
Time To Level-Set
by Alex King, CEO, Cestrian Capital Research, Inc
Right now, US equity indices are down a little from their all-time highs. A non-event, really. Some of the high-beta cray-cray stocks are down a good bit more than that. And crypto? Crypto is in the basement digging for victory.
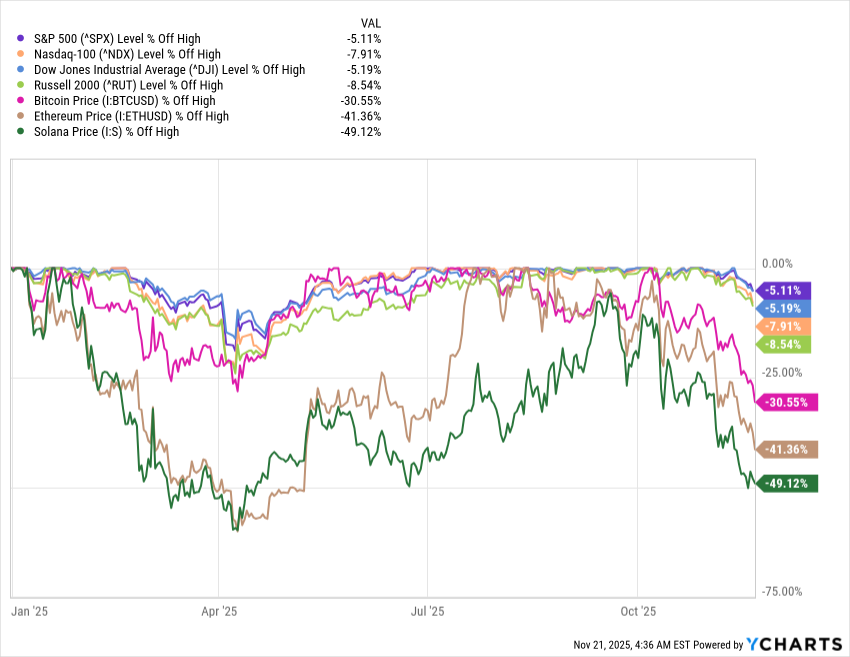
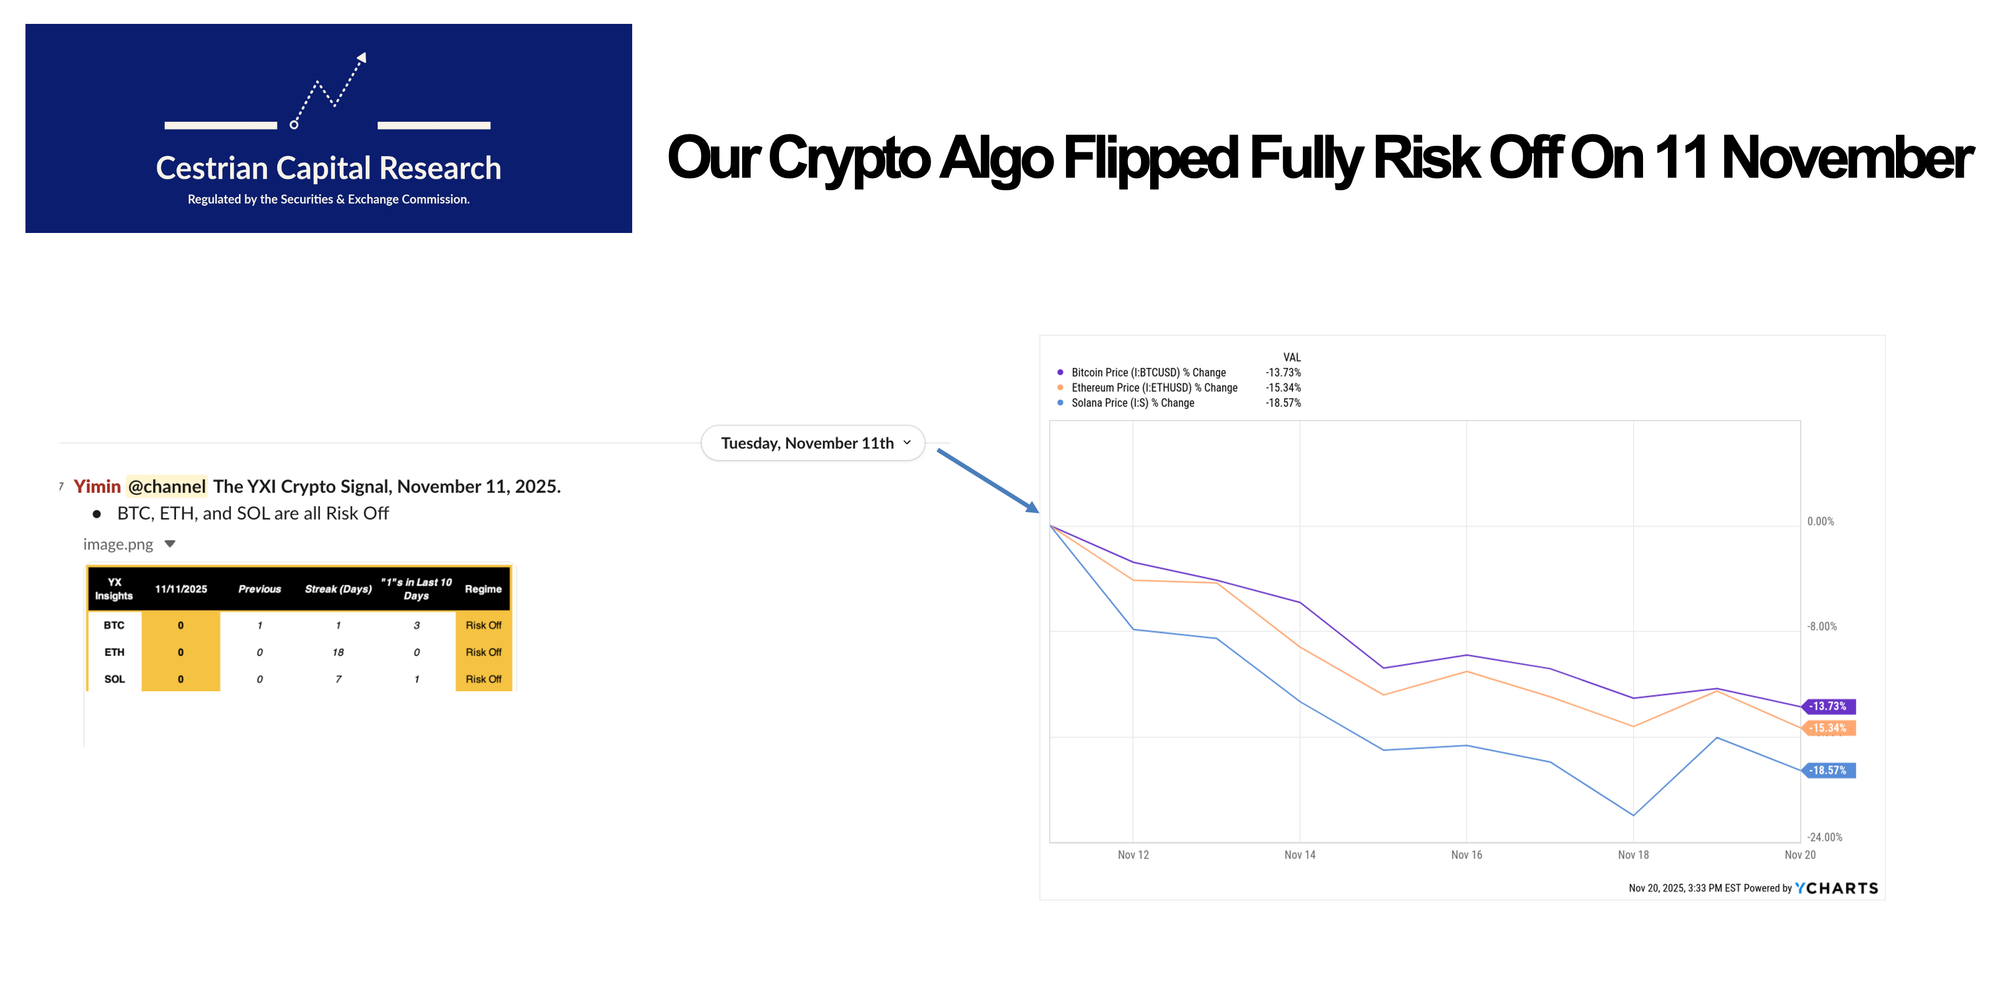
I think it’s time to re-set our expectations of crypto, to level-set our charts and see where things stand. Before I do, though, allow me to extend a warm round of applause to our Crypto ML Signal Service which has been risk-off in crypto for most of this selldown and flipped hard risk-off on 11 November in each of the three coins we cover (Bitcoin, Ether, Solana).
If this dump has left you bruised and battered, or even just irritated, may I suggest you get yourself a robot buddy who doesn’t feel anything when markets sell off or anything when markets run up. It just tries to follow the trend, and it does so pretty well. You can sign up for our crypto algos here if you’re an independent investor, and here if you’re an investment professional.
Let’s take a look to see if we mere humans can see what the algos see. The weakness of our trend-following algos is that they think only one step ahead, whereas as calm, rational humans (right??? we’re still calm RIGHT???? RIGHTTT????) we can try to see a little further in the future.
I want now to step through Bitcoin, Ether and Solana zoomed out and zoomed in to see if the price action fits typical longer-range patterns. So here goes.
Bitcoin
This chart goes back to the Covid crisis lows, and it’s a weekly chart. You can open a full page version, here.
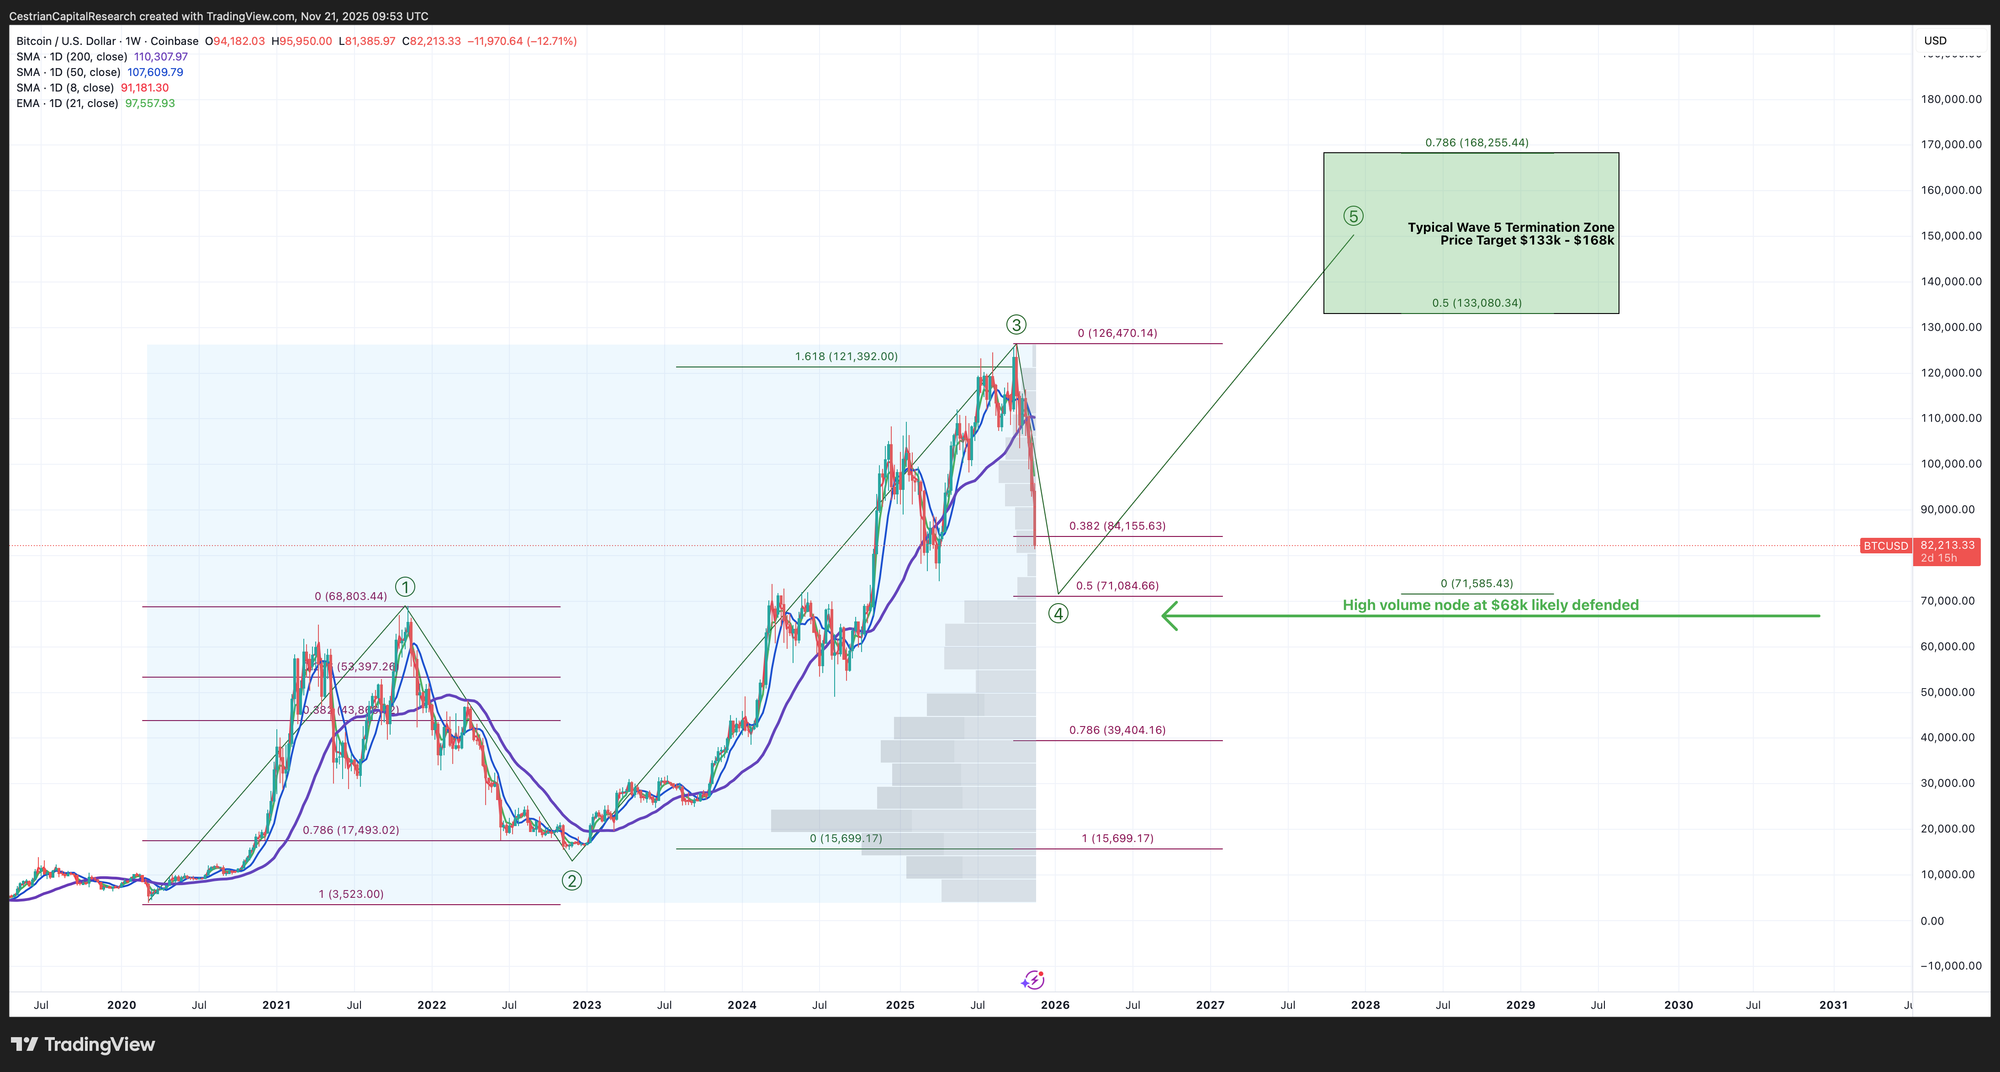
The recent ATH at $122k looks now like a Wave 3 high, in which case the current decline is a Wave 4; such waves tend to hold over the prior Wave 1 high which in this case was just shy of $69k. In addition we can see in the volume x price profile - that’s the gray horizontal bars - that there is a ‘high volume node’ aka a lot of buying - around that $68-69k level. If the decline in BTC price is to arrest it seems likely to me that this $68-69k level is the backstop. And if that happens we may then see a Wave 5 up - such waves tend to reach a peak somewhere between the .5 and the .786 Fibonacci extension of the prior Waves 1-3 placed at the Wave 4 low.
Nothing is certain of course, and this is just standard securities-pricing pattern recognition applied on a forward looking basis. But that is a nice clean pattern which suggests to me that we may see something like that play out. Support can be found anywhere between here and that $68-69k and the chart would remain bullish - indeed we would have to raise our Wave 5 target zone - but one thing I would say is that I think the next bull move in Bitcoin is probably the final push up. After a Wave 5 high in general one can expect a major, major correction.
Ether
Ether is a little less clear even when zoomed out, but my best guess goes something like this - (full page version, here).
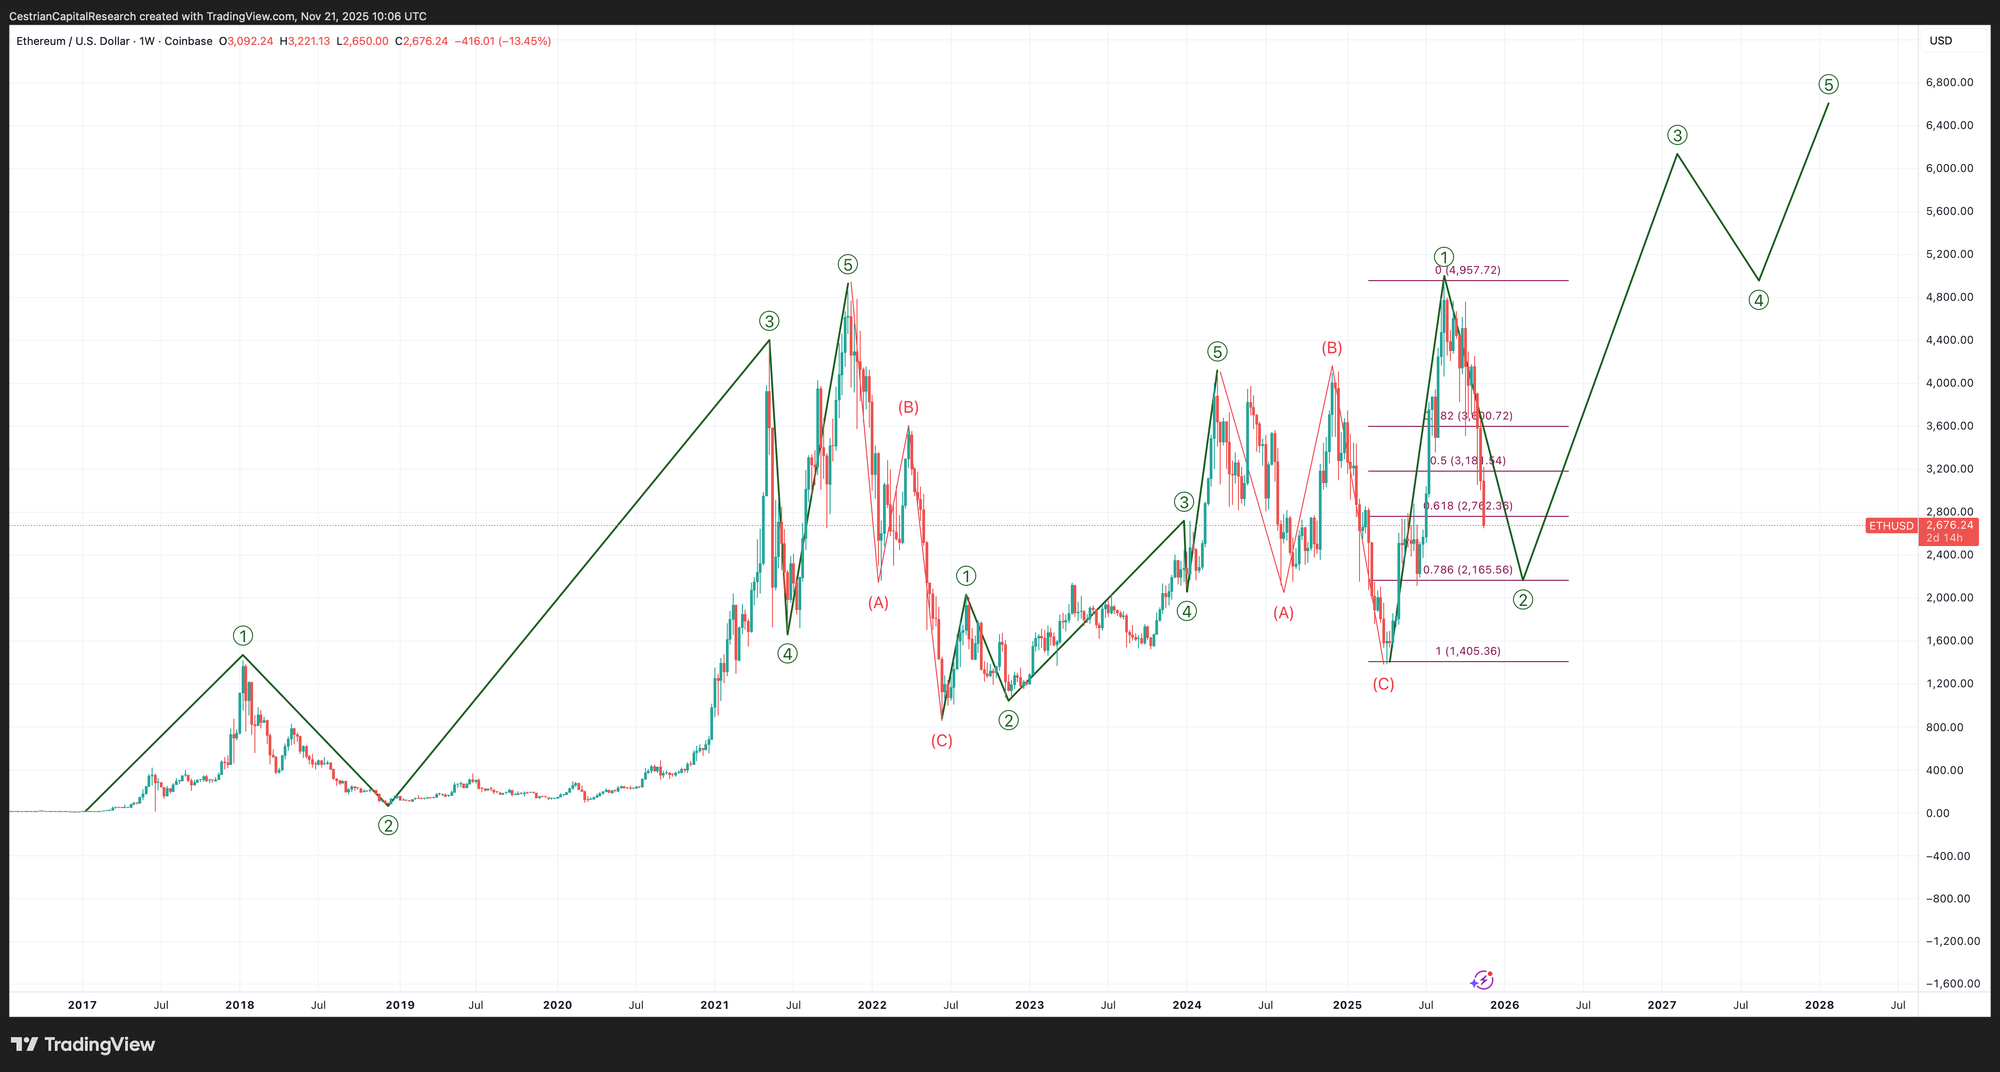
Those wave patterns do fit standard securities industry ebbs and flows, though they are brutal in their volatility as you can see. Ether is I think highly likely to be in a larger-degree Wave 2 right now because the drop in price is precipitous and feels like it will never end. That’s just how Wave 2s are. The bad news is that the decline could go as far as 2165 and it would still be in this overall bullish pattern. I will say that if you can catch a Wave 2 low as a buy, they can deliver dramatic upside results. I am watching our Crypto Algo Signals closely for when they flip back to Risk On in Ether; they are designed to catch an uptrend early in its formation but only once that uptrend is confirmed, the idea being to not try to catch falling knives. The price target for Ether if this chart is correct is … very high. Far in excess of $5000, and to a level which would just look ridiculous if I wrote it down here, so rather than printing dreams let’s just see if this move down is arrested at a level confirming a likely Wave 2 low. And then we can start to look upwards.
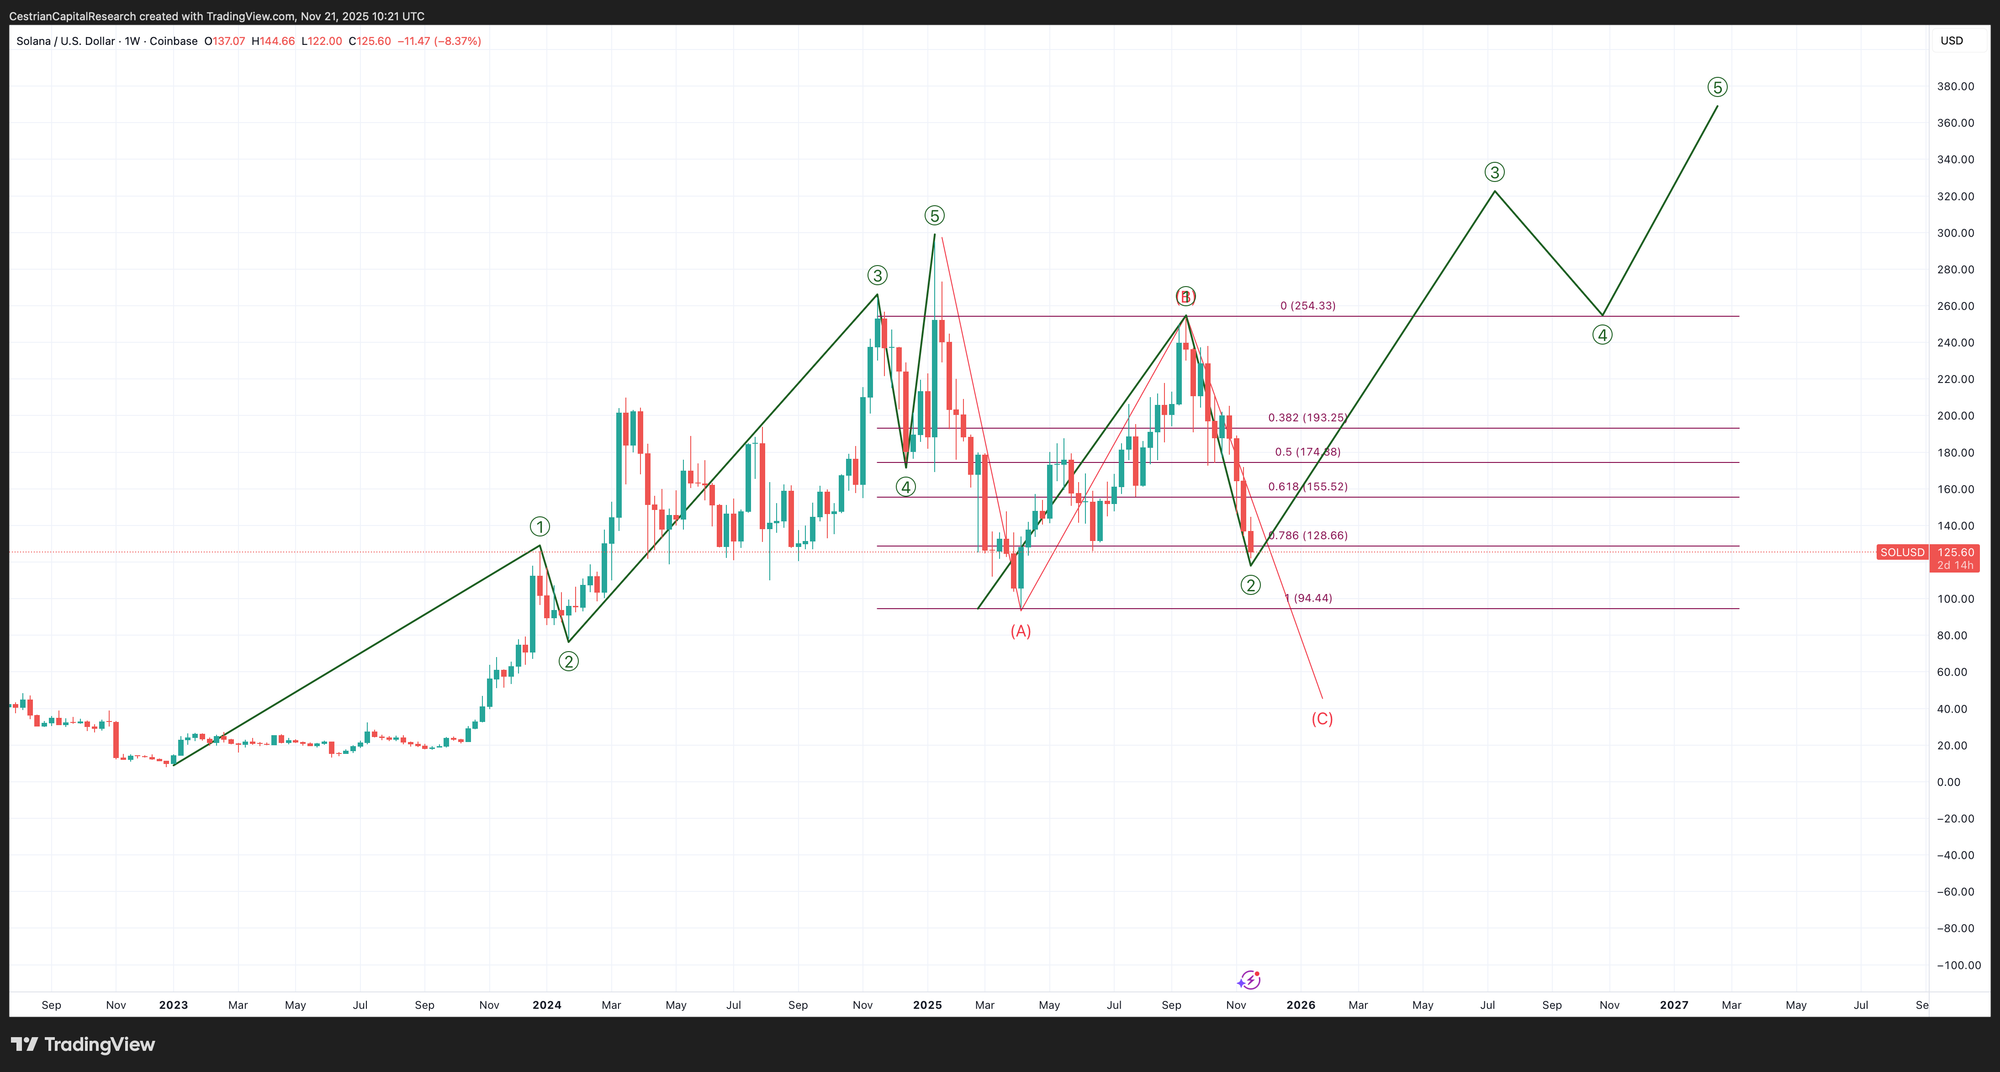
Solana
The smaller the market cap of the coin, the less adherence its price movement has to standard securities industry patterns. I confess I have no firm view on Solana (which is why I don’t own long or short positions in it). We may still be in an A-B-C correction with further to fall, or we may already be at or around a Wave 2 low. “Altseason” theory would suggest that when liquidity floods into the system (which believe it or not is starting to happen as the Treasury General Account starts to disburse funds which were held back during the government shutdown) it benefits the highest-beta names disproportionately. So maybe we get a big bull run in Solana. Maybe. I am not convinced, not least because Solana has neither the ownership base of Bitcoin nor the institutional utility (tokenization) of Ether. Full page version, here.
How To Catch The Bull Run When It Starts
Obviously I have a dog in the fight here, which is that we sell the algo services. But we sell them for a reason, which is that they have been working so well.
You can sign up for our crypto algos here if you’re an independent investor, and here if you’re an investment professional.
Alex King, CEO, Cestrian Capital Research, Inc - 21 November 2025.
Disclosure: Cestrian Capital Research, Inc staff personal accounts have long positions in Bitcoin and Ether via $IBIT, $ETHA, $SBET, $BMNR, $ETHZ.