
Occidental Petroleum (OXY) Q4 FY12/25 Earnings Review

DISCLAIMER: This note is intended for US recipients only and, in particular, is not directed at, nor intended to be relied upon by any UK recipients. Any information or analysis in this note is not an offer to sell or the solicitation of an offer to buy any securities. Nothing in this note is intended to be investment advice and nor should it be relied upon to make investment decisions. Read our full disclaimer, here.
Can Oil Stocks Keep Running Up?
by Alex King, CEO, Cestrian Capital Research, Inc
So this is what we said in December when reporting on Occidental’s Q3:
23 Dec 2025: We rate $OXY at Accumulate between $40-52/share, because it looks like Big Money is accumulating in this range - per the volume x price profile (gray horizontal bars on the right hand side of this next chart).
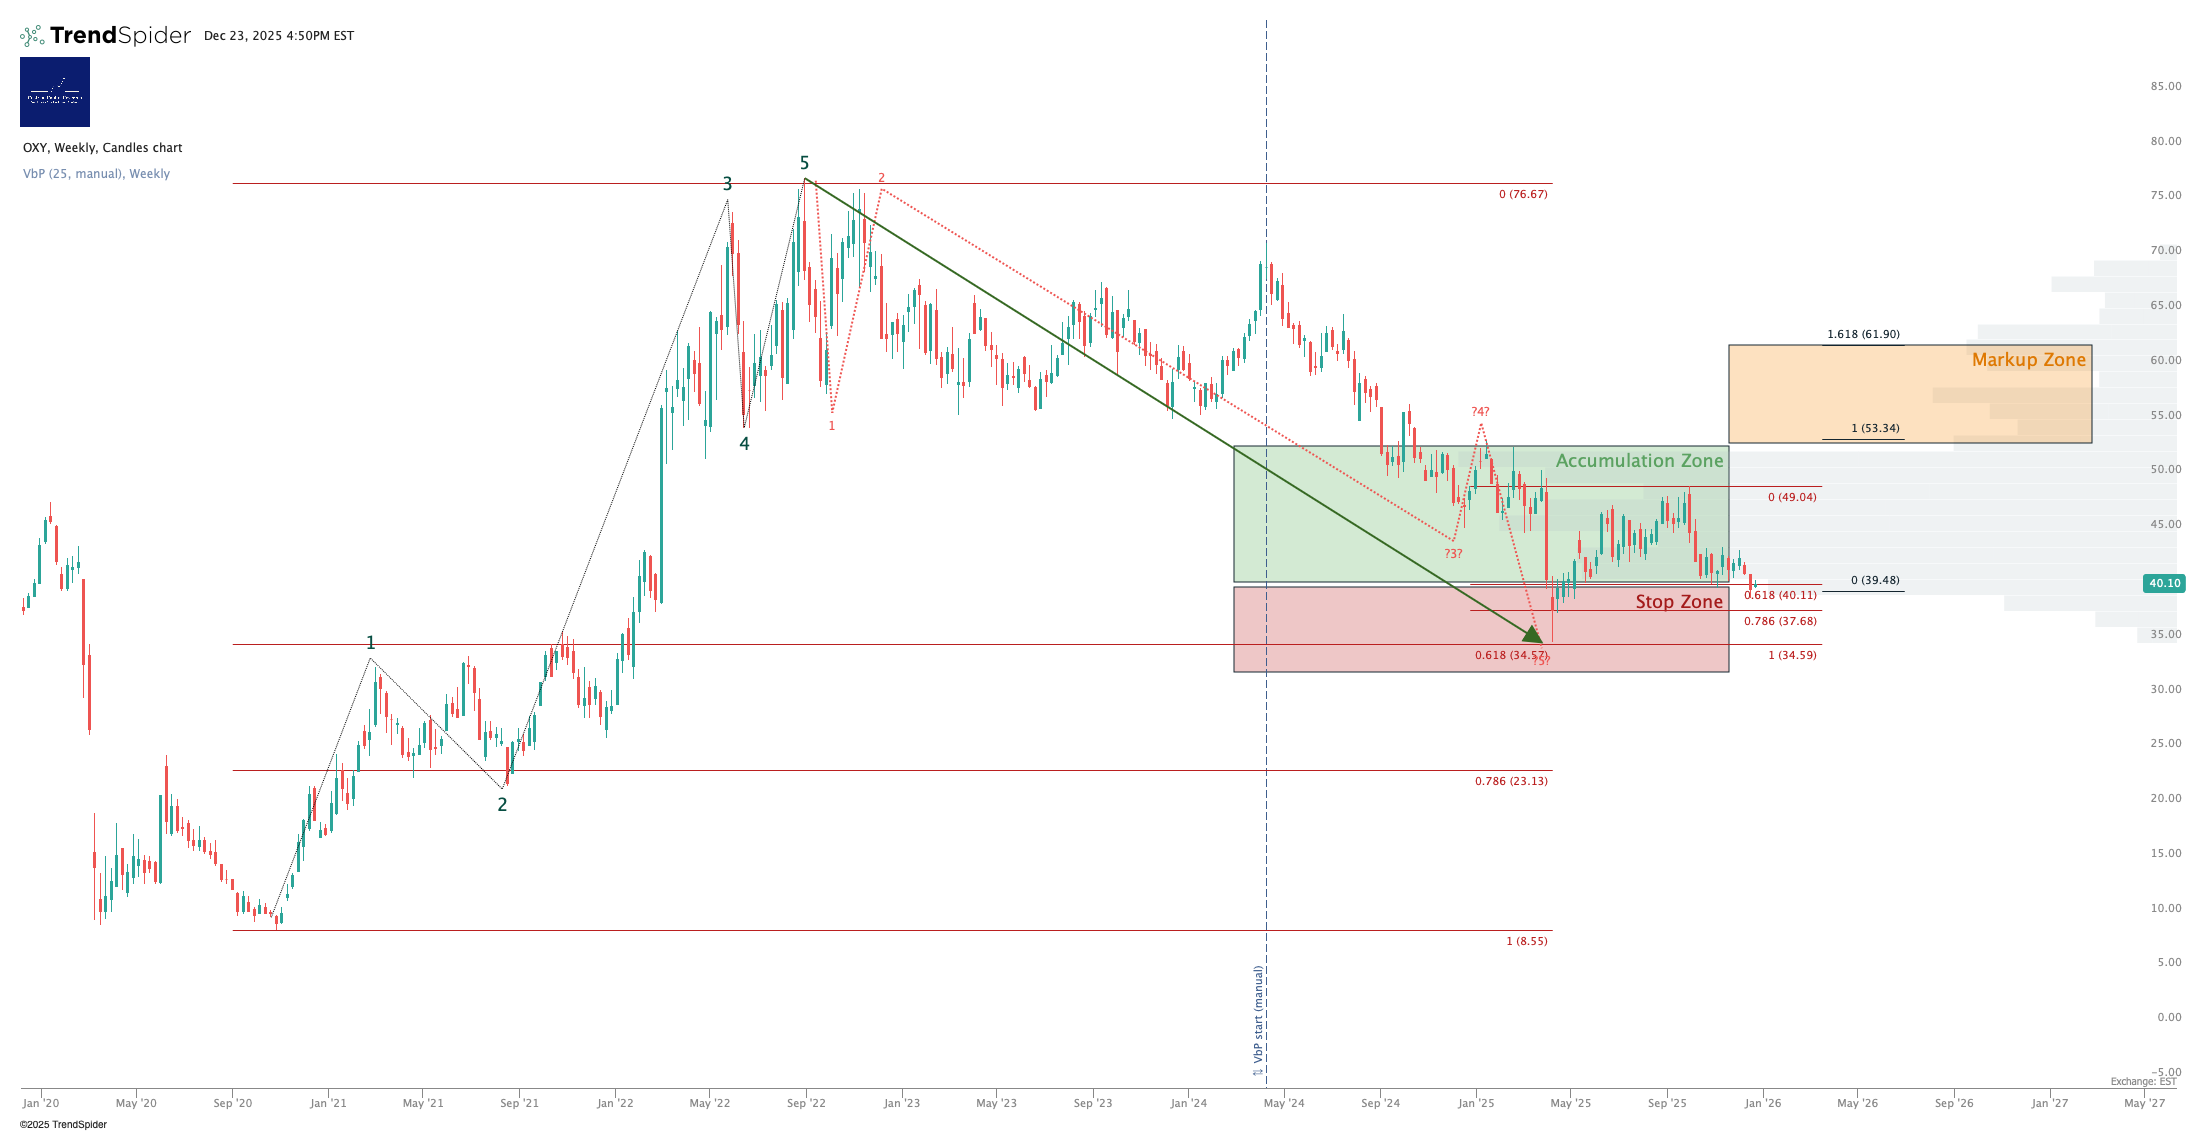
If the stock reaches $53 we’ll move to Hold in anticipation of the stock moving up through the lower-volume (= less supply of stock from sellers) Markup Zone outlined above.
This is where the stock sits now (full page version, here):
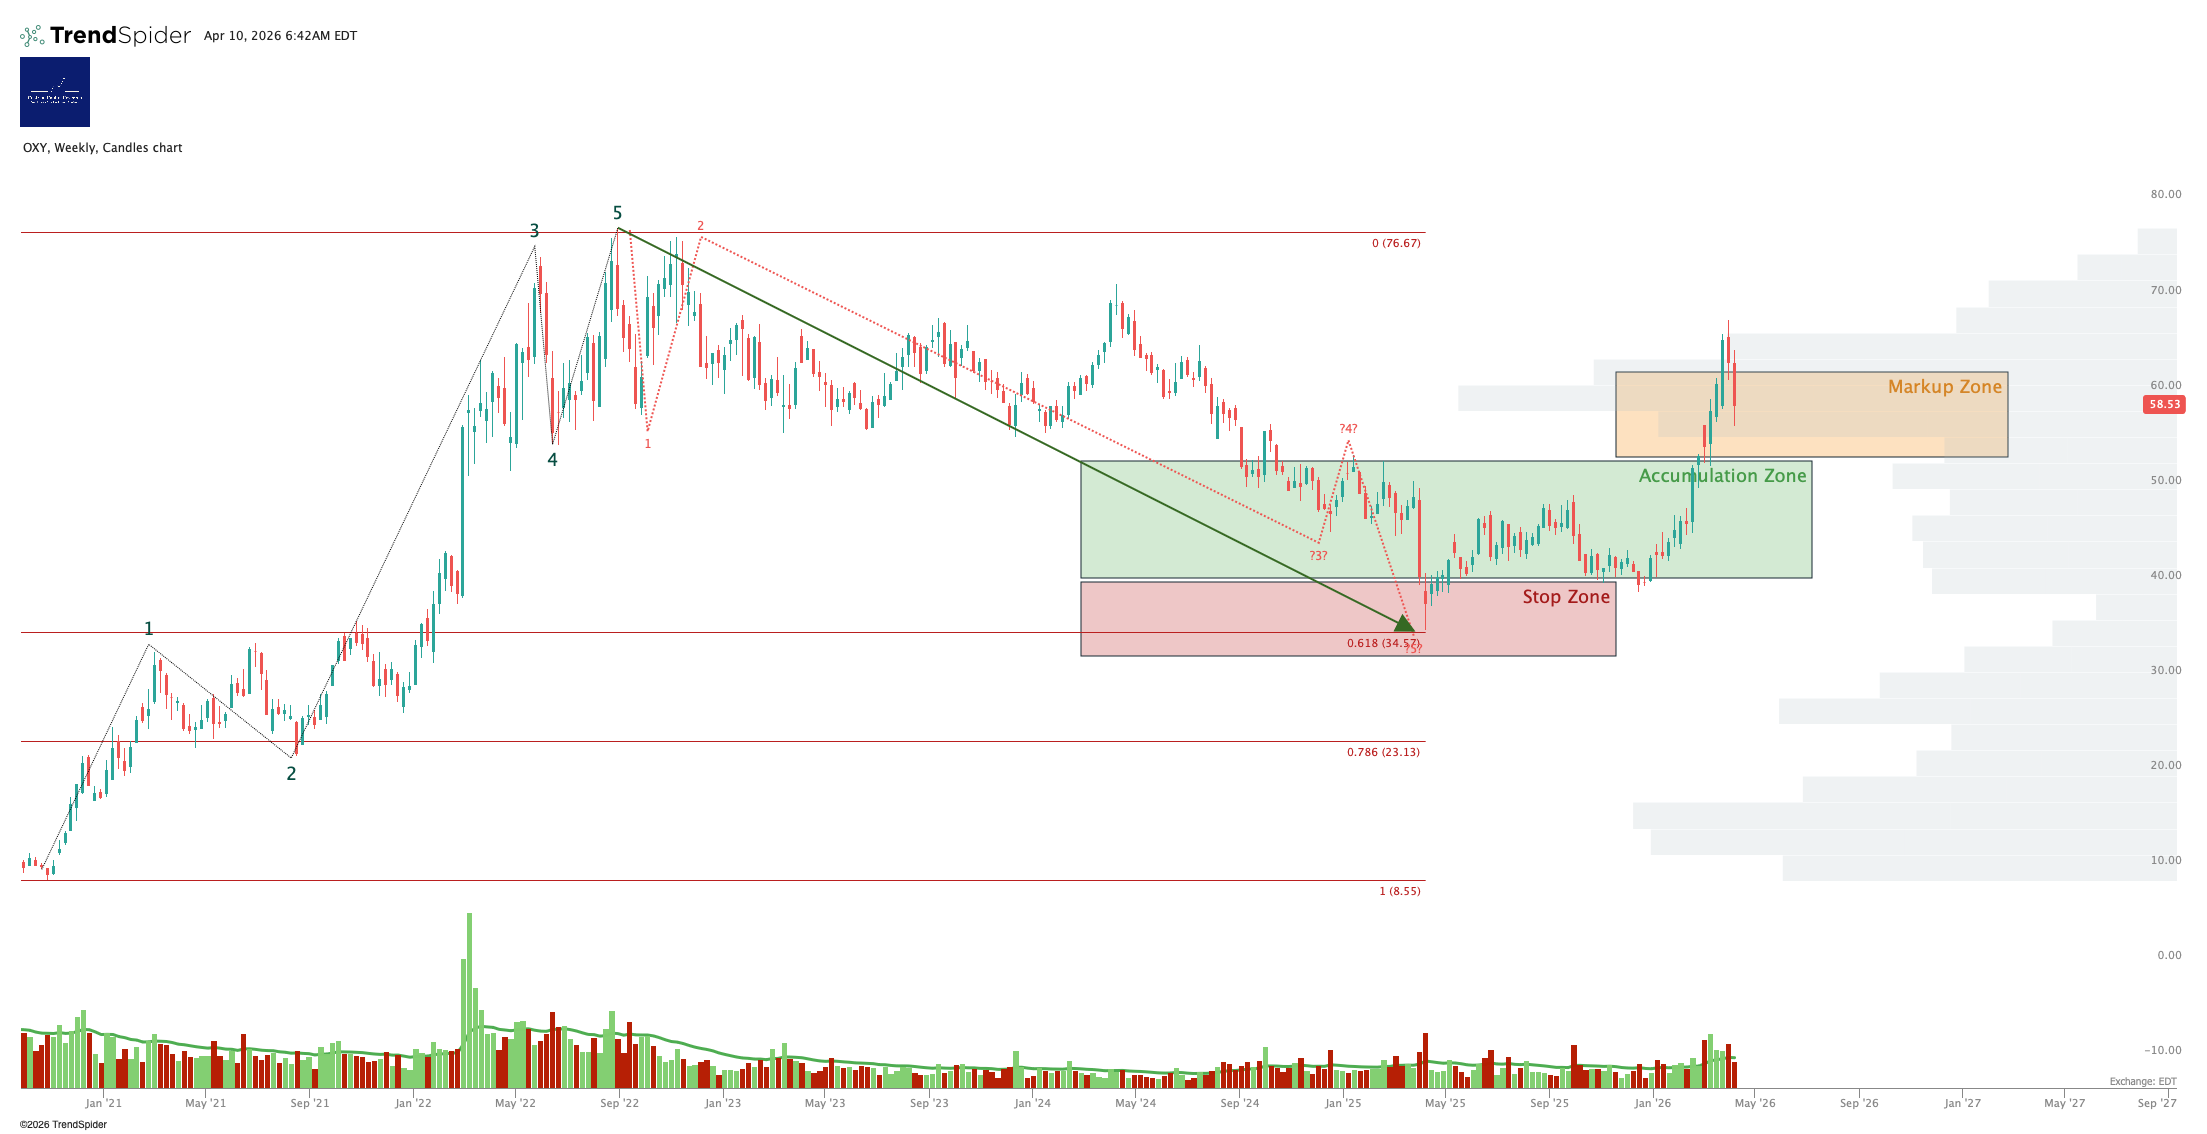
From $40 at our “Accumulate” rating on 23 Dec to a high of $67 and presently sat at $56, so, +40% since that call.
All well and good, victory lap etc, but, where now? All energy stocks ran up on the Iran War news; can they sustain due to supply shortages and the consequent inflationary impulse, or will sentiment collapse and see capital rotate out of these stocks regardless of fundamentals?
First let’s look at the numbers in Q4.
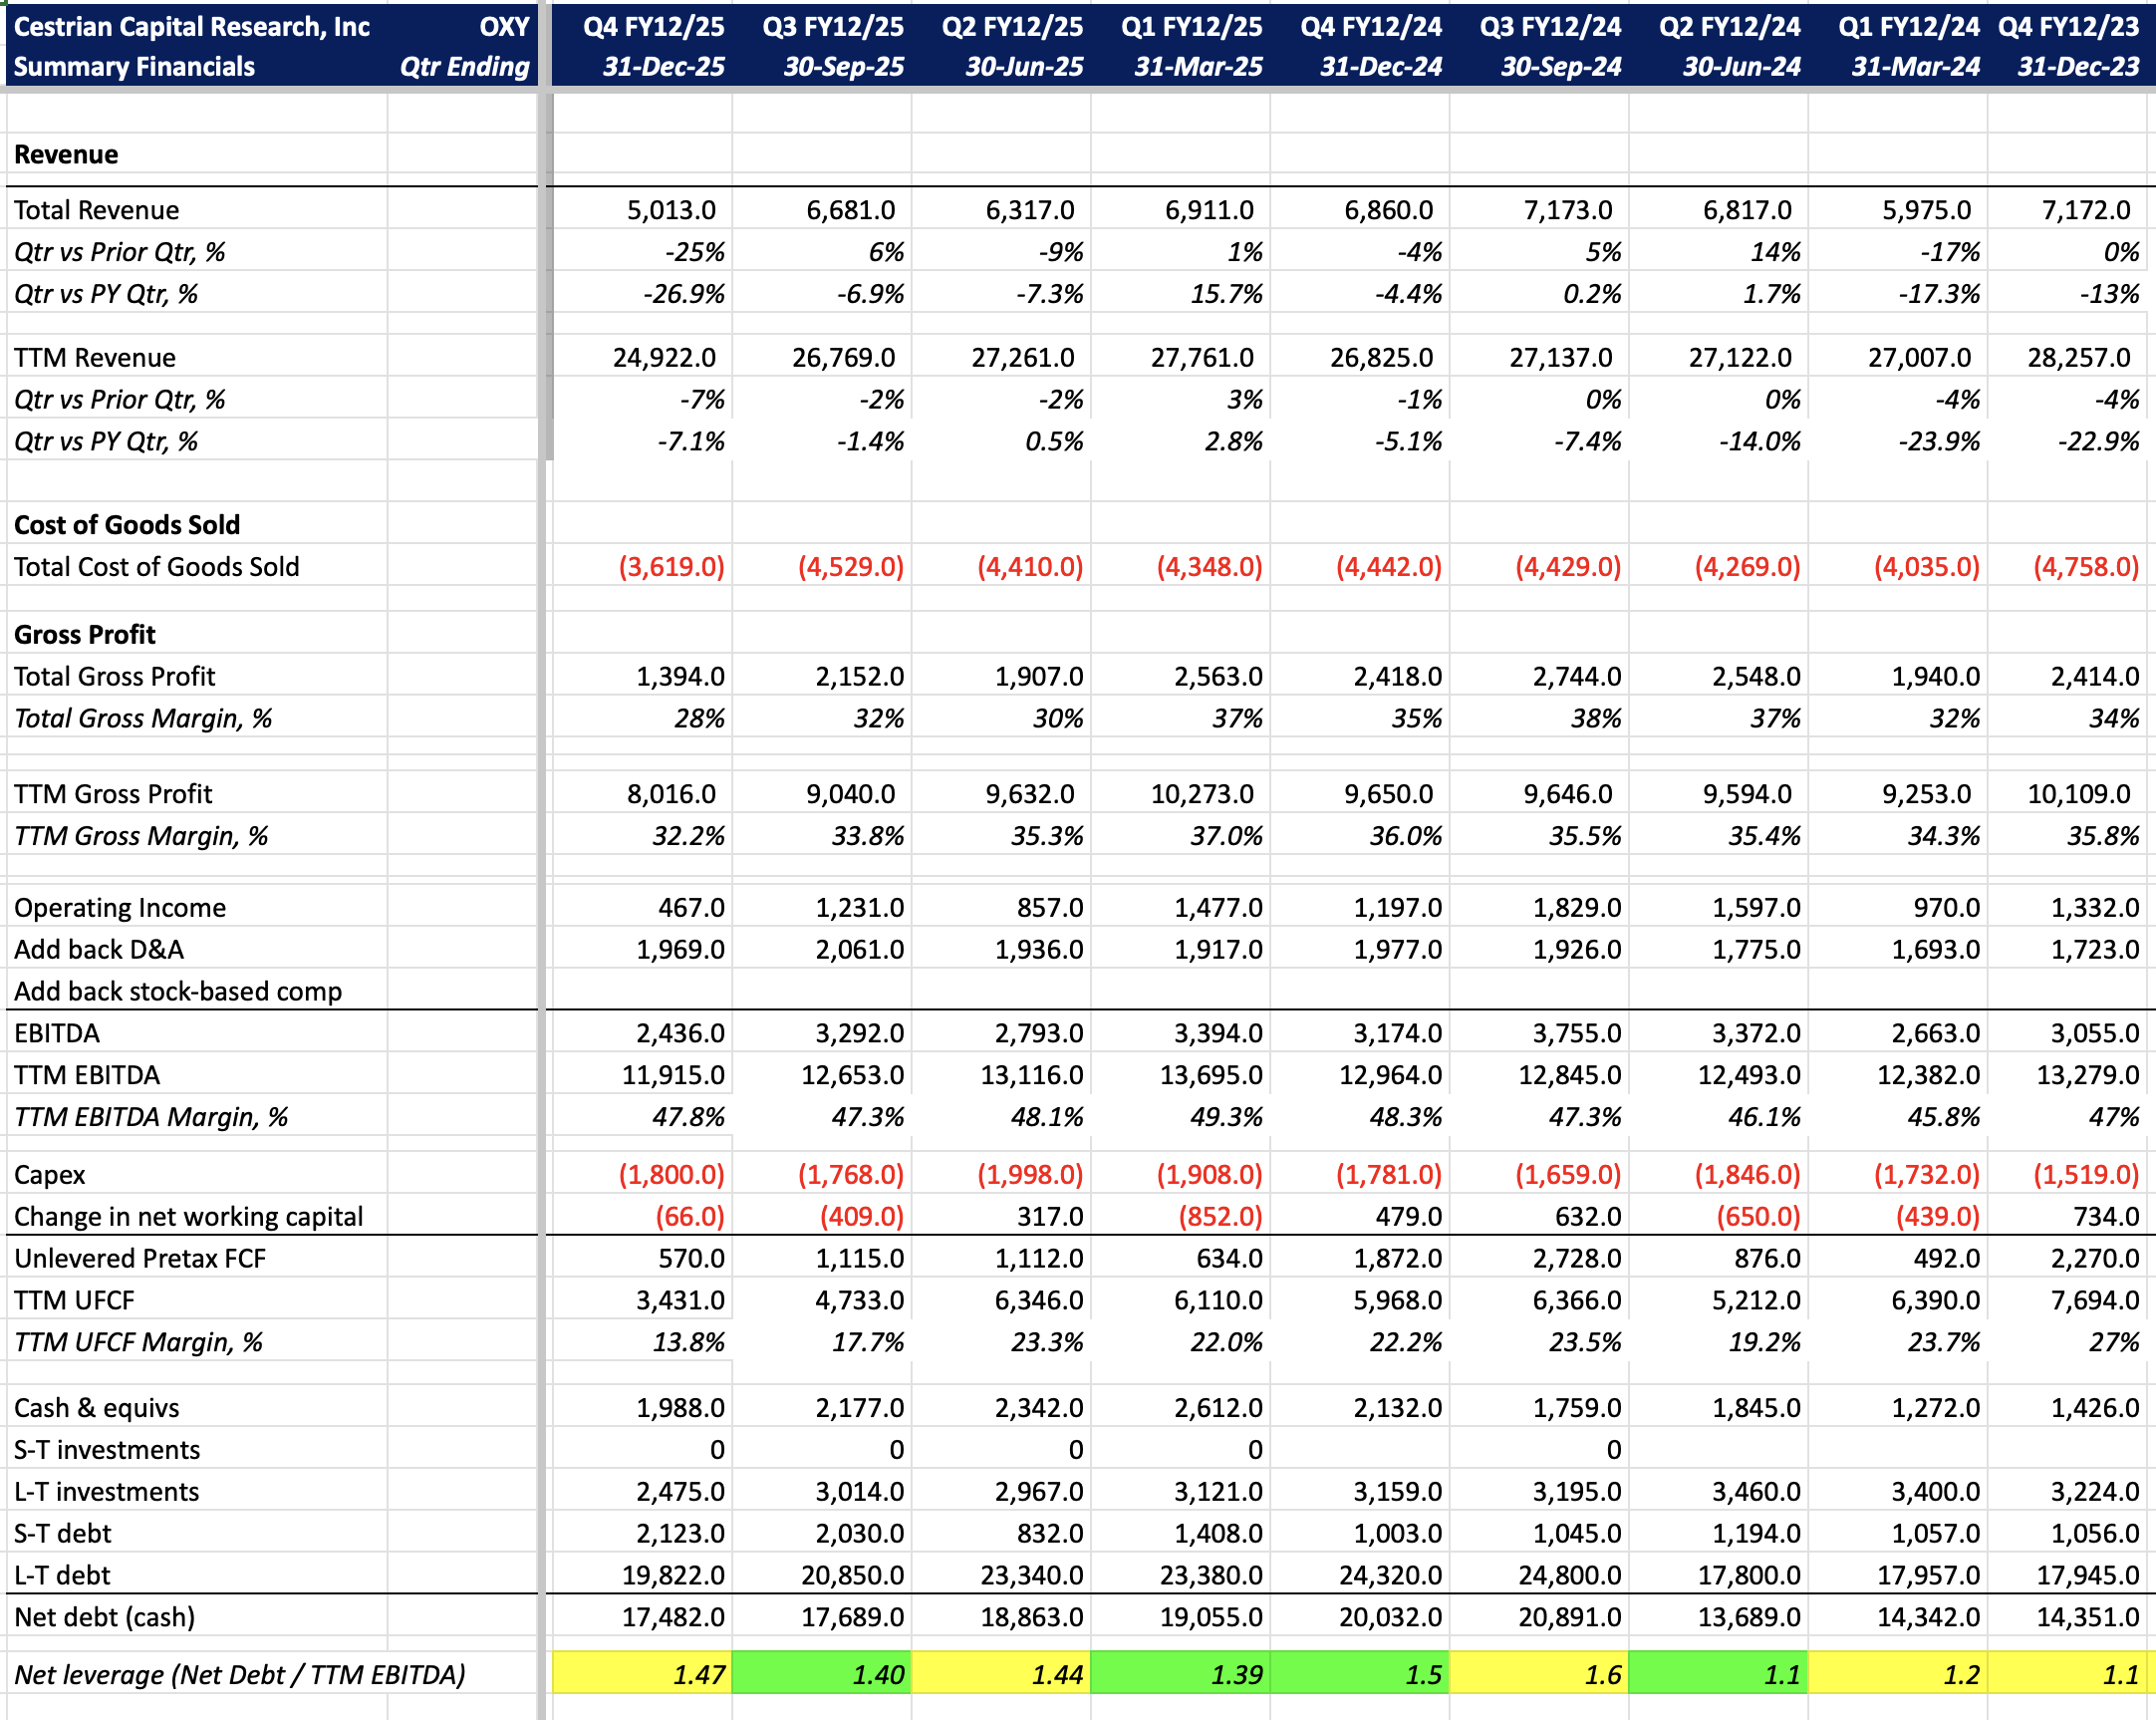
$OXY Fundamentals
A note on numbers. The sale of the OxyChem unit closed January 2, 2026, and its results have been reclassified as discontinued operations for all periods. Data in this table reports continuing operations only, so the Q4 figures exclude OxyChem revenue and costs. Prior quarters in the sheet still include OxyChem. This means the QoQ decline of ~25% and YoY decline of ~27% in revenue are largely driven by the reclassification rather than pure operational deterioration. Gross margin similarly drops from ~32% to ~28% partly for this reason. Net leverage ticked up to 1.47x from 1.40x prior quarter — also flagged red. This should improve going forward once the OxyChem sale proceeds flow through.
M&A intensive businesses are hard work to track through their fundamentals unless you can sit next to the CFO to build your model. If that’s not available to you, better to focus on the stock chart in my view.
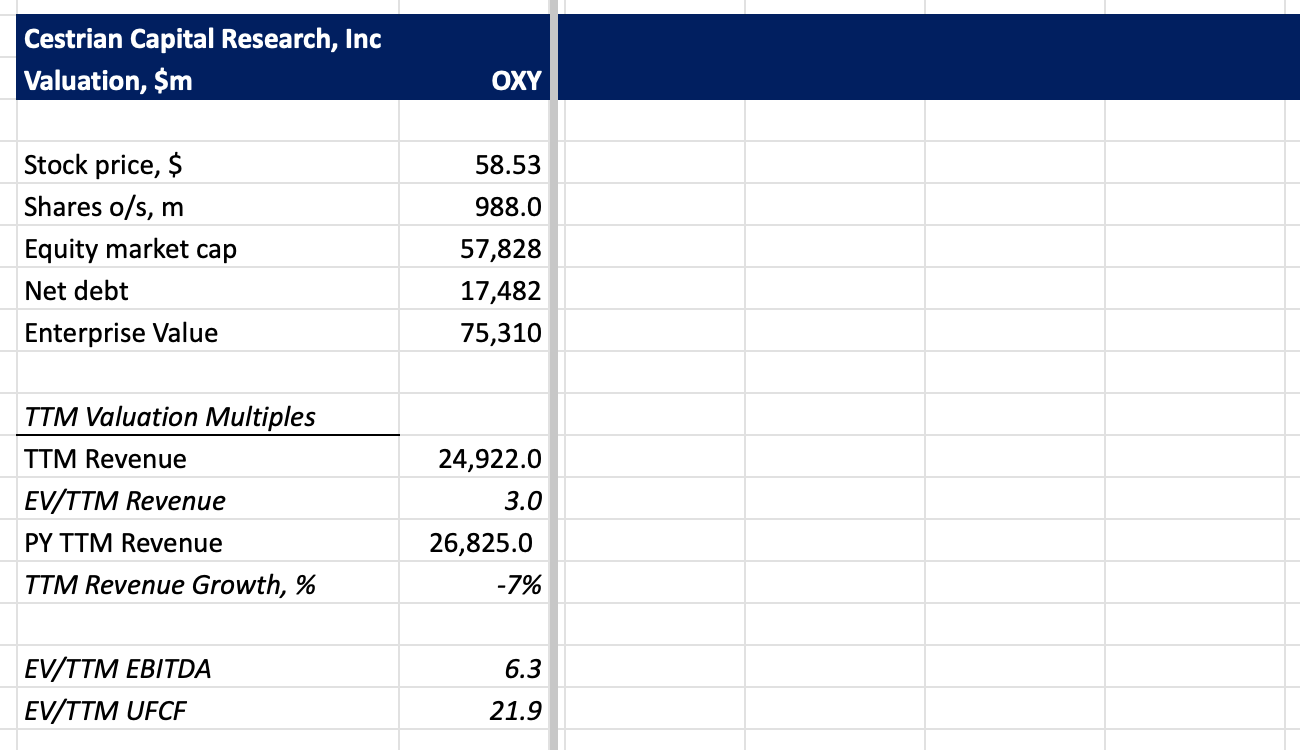
$OXY Valuation
$OXY Chart And Rating
Let’s zoom in a little to look at the current price setup.
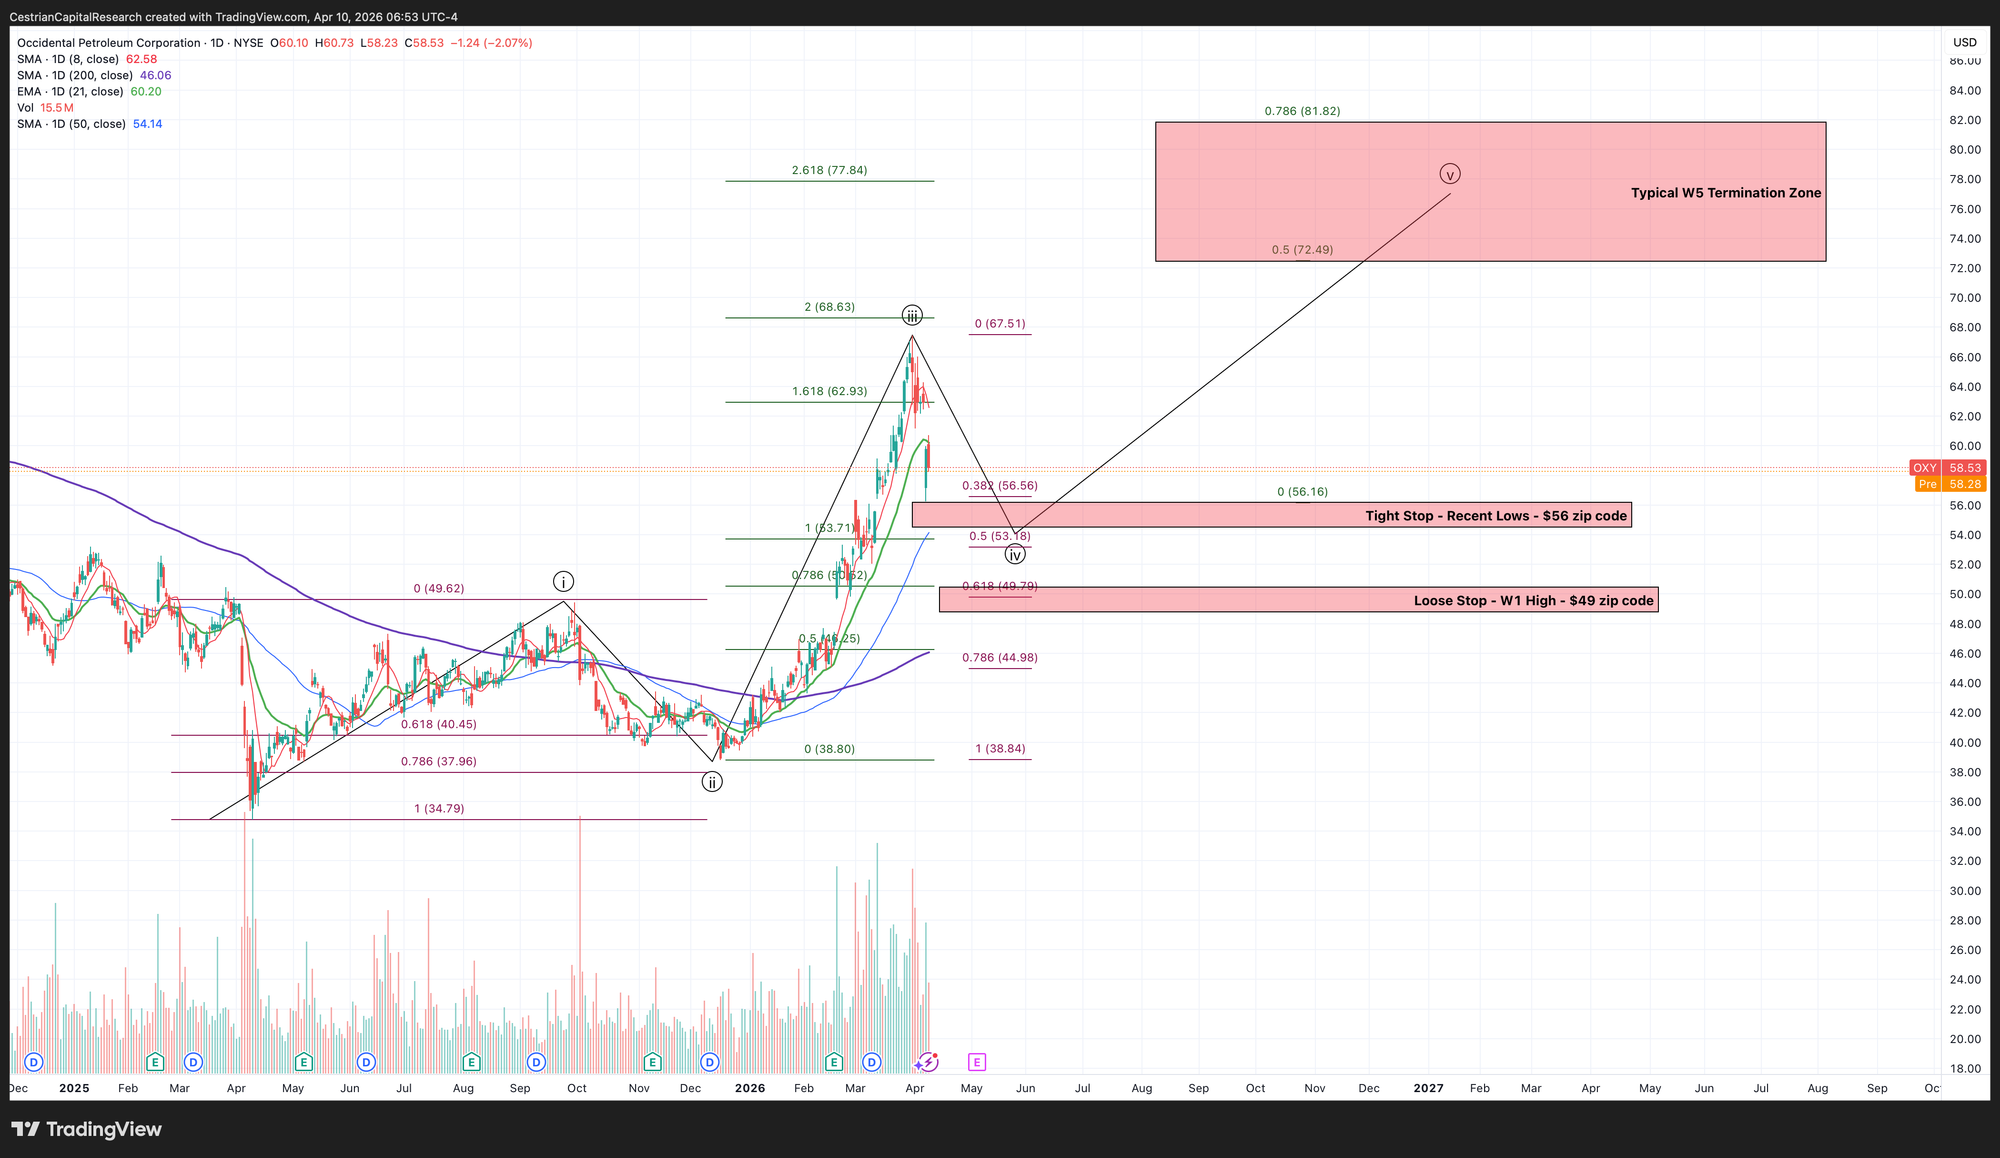
It's possible that OXY has found a Wave 4 low already - you see the bounce this week - in which case the stock has a shot at making a run to $72-81/share. Risk management? My best view on tight and loose stops in the chart above.
We rate at Hold, subject to those stops.
Alex King, CEO, Cestrian Capital Research, Inc - 10 April 2026