
Oil Is In Everything And Everything Is On Oil.
DISCLAIMER: This note is intended for US recipients only and, in particular, is not directed at, nor intended to be relied upon by any UK recipients. Any information or analysis in this note is not an offer to sell or the solicitation of an offer to buy any securities. Nothing in this note is intended to be investment advice and nor should it be relied upon to make investment decisions. Read our full disclaimer, here.
Market On Open, Friday 6 March
by Alex King, CEO, Cestrian Capital Research, Inc.
Oil, as everyone knows, is in everything. Even if you think you don’t buy oil, you buy oil. Because “oil” is basically a proxy for “unholy admixture of complex hydrocarbons we pull out of the ground or from under the sea in order to get our hands on endlessley manipulable molecular structures from which we can make pretty much anything that anyone wants”. You have a big ole truck and oil-fired heating? You know this already. But for the HCrefuseniks of this world…. your EV? Whole bunch of oil went into making it. The dashboard is made of oil. The seats are made of oil. Heck parts of the battery are made of oil. And what about the optoutoors …. you’re vegan and live off the grid using energy only from the Sun? You think no oil went into making your solar panels or your inverter or the cables that connect them? Man. Wake up.
So this matters:
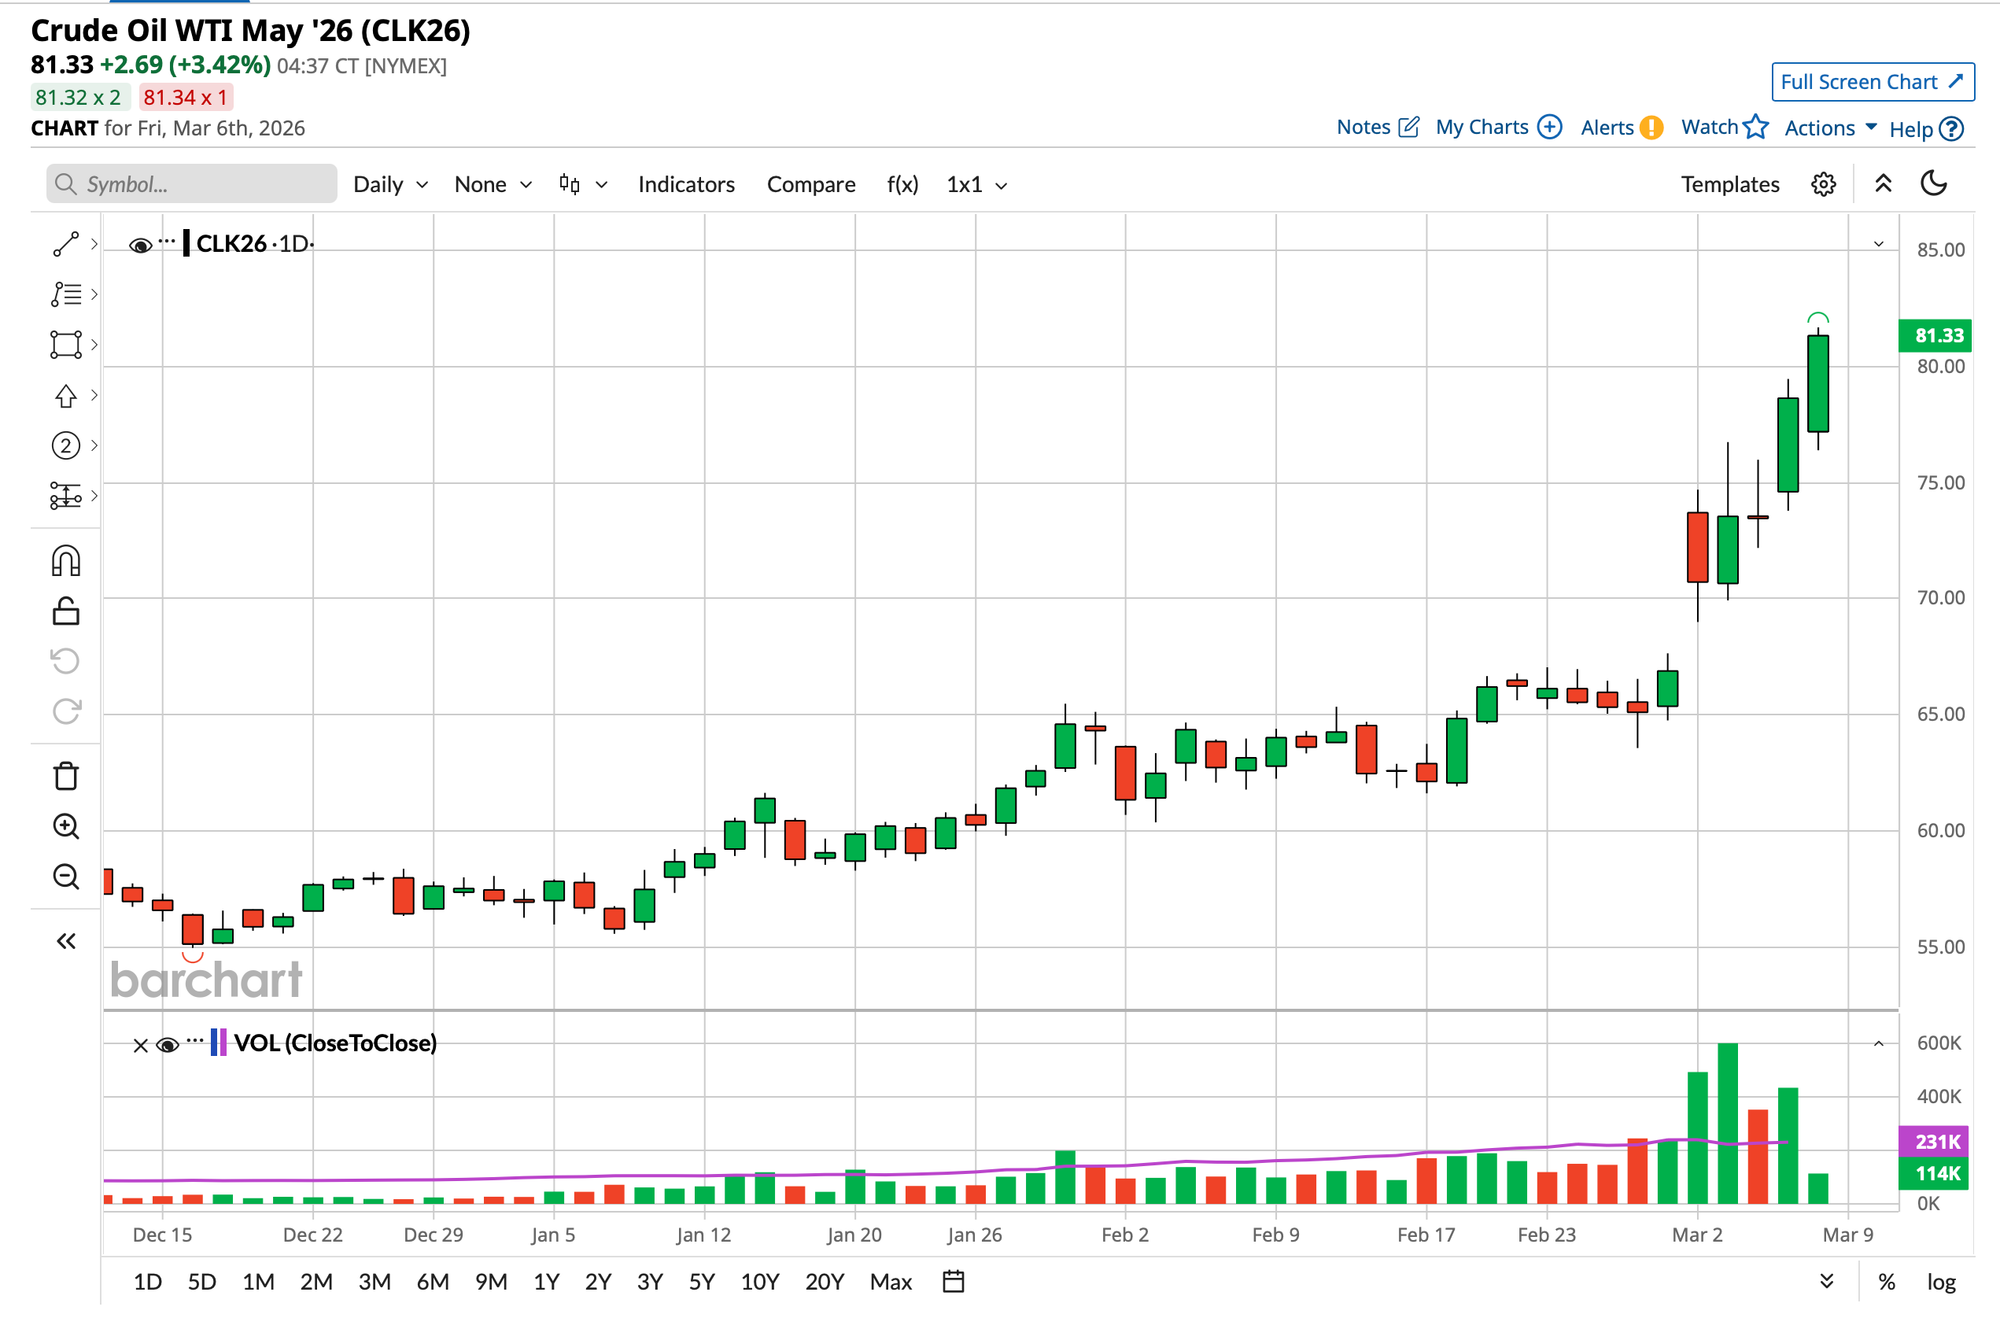
This is the chart that will determine most other things in the economy and the market for a little while. The oil price is up, of course, because deliverable output is down. Many factors can and will impact the price; it can fall because of relaxing of sanctions on some sources of oil, it can fall because production is increased in non-compromised geographies, it can fall because of subsidies from producers, and it can rise for a bunch of reasons too.
Sec. Treasury right now has two charts on his desk. The first is the oil price, and the second is the U.S. Treasury yield curve. Actually just one chart, because they are the same thing. Oil up, because oil is in everything, means inflation expectations up; that means bonds down, yields up; that means each successive new bond auction by the Treasury will be priced with the coupon a little higher than it otherwise would have been, and that means higher interest payments than might have been the case. Yields up means cost of money up means risk assets down, all other things being equal. So in this way oil up = bad for everyone.
We will see all manner of methods to cap the oil price = keep ahold of inflation expectations = keep ahold of risk asset markets in an election year. What those methods are and how they are presented, there are many capable and wise folks in DC and NYC working on that right now. But I am in no doubt that they will appear.
So the push and pull of markets right now is: war up, oil up, inflation expecations up, bonds down, equities down - vs. stimulus up, oil maybe up still or maybe not, inflation expectations tempered, bonds up or flat, equities up probably. And then the tail outcomes are (i) war ends or is suspended in which case risk assets will enter a veritable face-ripping rally vs. (ii) war gets more intractable in which case malaise or worse will haunt the markets.
This is, it has to be said, Not Easy To Navigate. But fear not, because as always our Inner Circle service will help you. Today’s note is available to Inner Circle members only.