
The Other Economy And How To Profit From It

DISCLAIMER: This note is intended for US recipients only and, in particular, is not directed at, nor intended to be relied upon by any UK recipients. Any information or analysis in this note is not an offer to sell or the solicitation of an offer to buy any securities. Nothing in this note is intended to be investment advice and nor should it be relied upon to make investment decisions. Read our full disclaimer, here.
by Alex King, CEO, Cestrian Capital Research, Inc
with thanks to Inner Circle member “Stockteller” for stock ideas here.
You hear a lot about the “K-shaped economy” and if you live in the upper leg of the K, as most likely does everyone reading this, then life has been pretty good this last 15-20 years or so. Inflation, cited as the universal boogeyman, is in fact a boone to the Upper K, because with it comes rising asset prices. Why? Because inflation means dollars become worth less, so any asset priced in dollars becomes worth more, without anything else happening. Simple as that.
If you live in the lower K, life has been extremely tough these last couple decades, very specifically since 2008 when rich folk inverted socialism as a way of transferring wealth from the poor to the rich by means of the money supply.
Here’s a simple visual to illustrate the K.
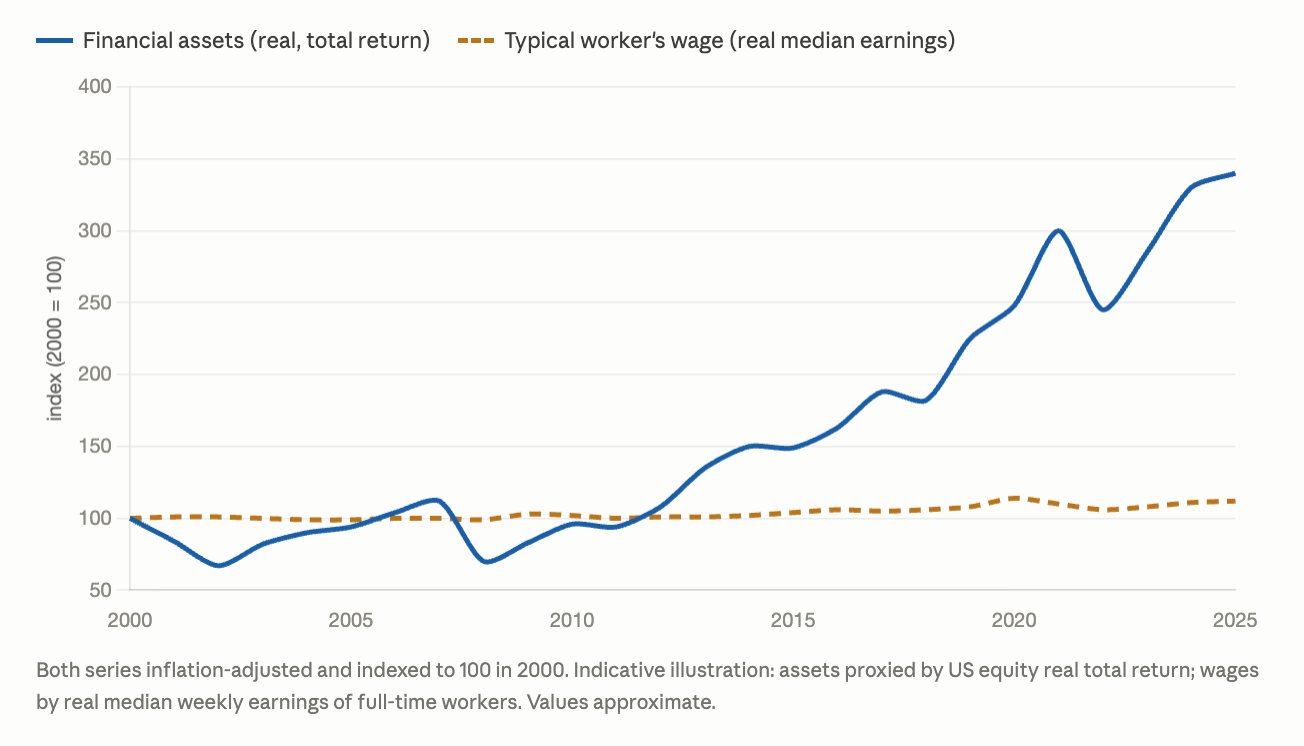
In short: if you own assets or earn your living from assets, all good. If you sell your labor to a customer unconnected with assets, bad.
Now, this trend looks to me as if it is going to continue and as a result, I think it’s good to be long assets; the S&P500, gold, U.S. bonds, all that. But it is also a time where the companies who sell to the wider labor force have seen their stocks absolutely dumped in recent years, as investors sought to ride that upper leg of the K. A number of these stocks seem to have bottomed - better, are close to their multi-year lows but are turning up, meaning that a stop-loss can be placed quite close by to limit pain, but the upside may be considerable. That is the kind of setup I like, because it can be played with a trailing stop, sized according to the maximum loss the investor chooses to bear, and then left to play out how it will.
Below I walk through four stocks that I think can benefit from the situation that continues to face the lower leg of the K. None of these stocks are investment ideas that have any particular benefit to the residents of the lower K. That is not our purpose here. Our purpose here is to try to see the world as it really is, not as it appears to be (more Marxism!) and therefore to come up with solid risk-reward setups in U.S. securities.
So here goes.
Four On The Floor
The four stocks I want to cover today are:
- Conagra Brands, $CAG
- The Campbell’s Company, $CPB
- General Mills, $GIS
- Cracker Barrel, $CBRL
Each of them is way down from their highs.
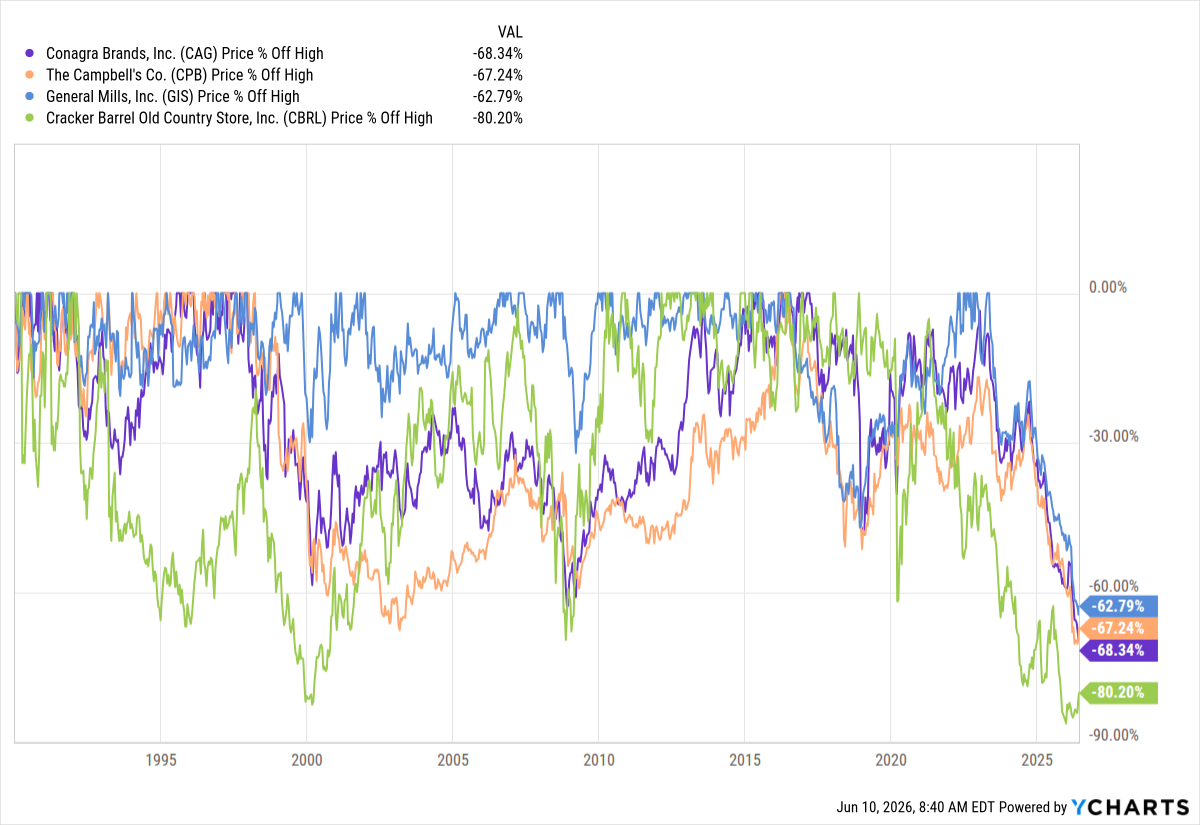
And oh by the way most have them have compelling dividend yields.
Let's look at each chart in turn.
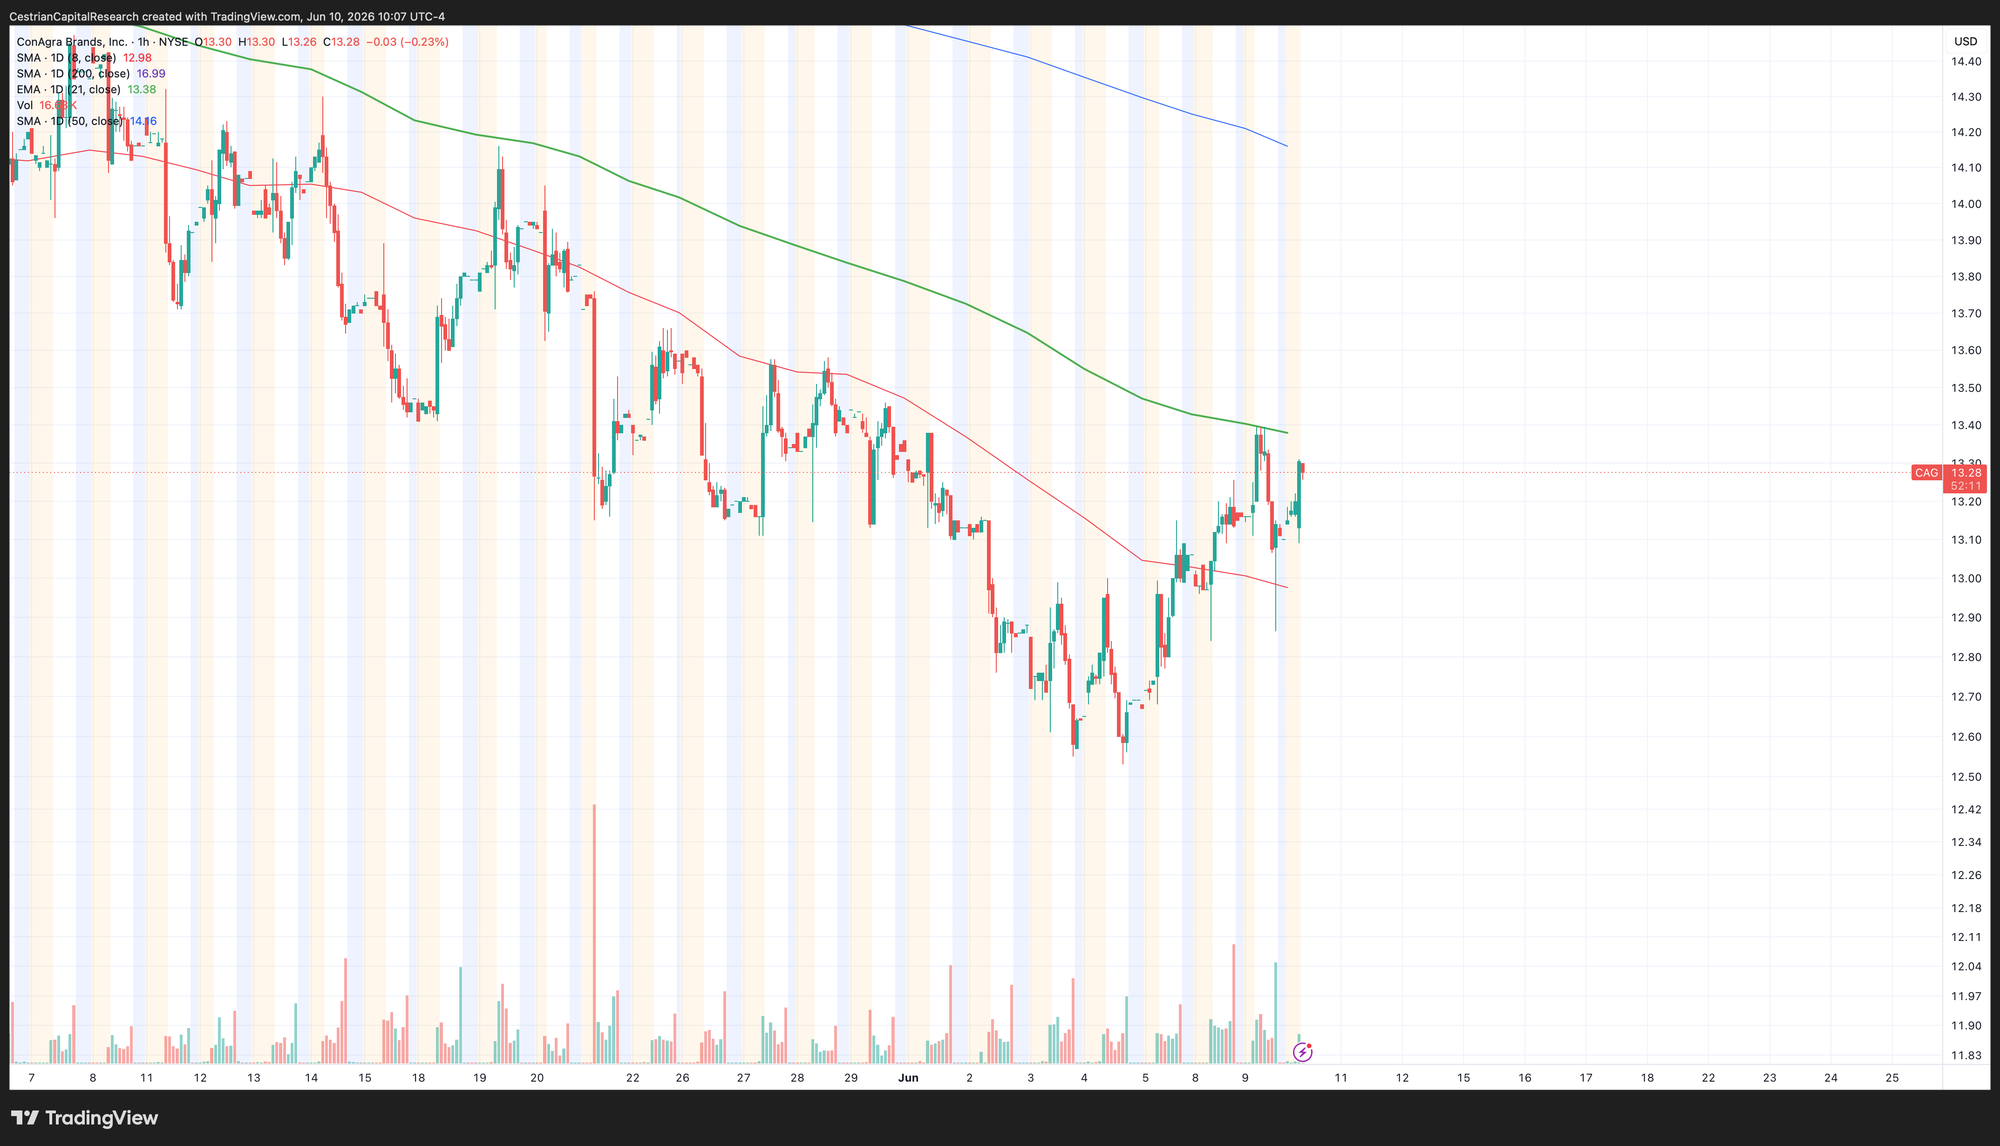
Conagra Brands, $CAG
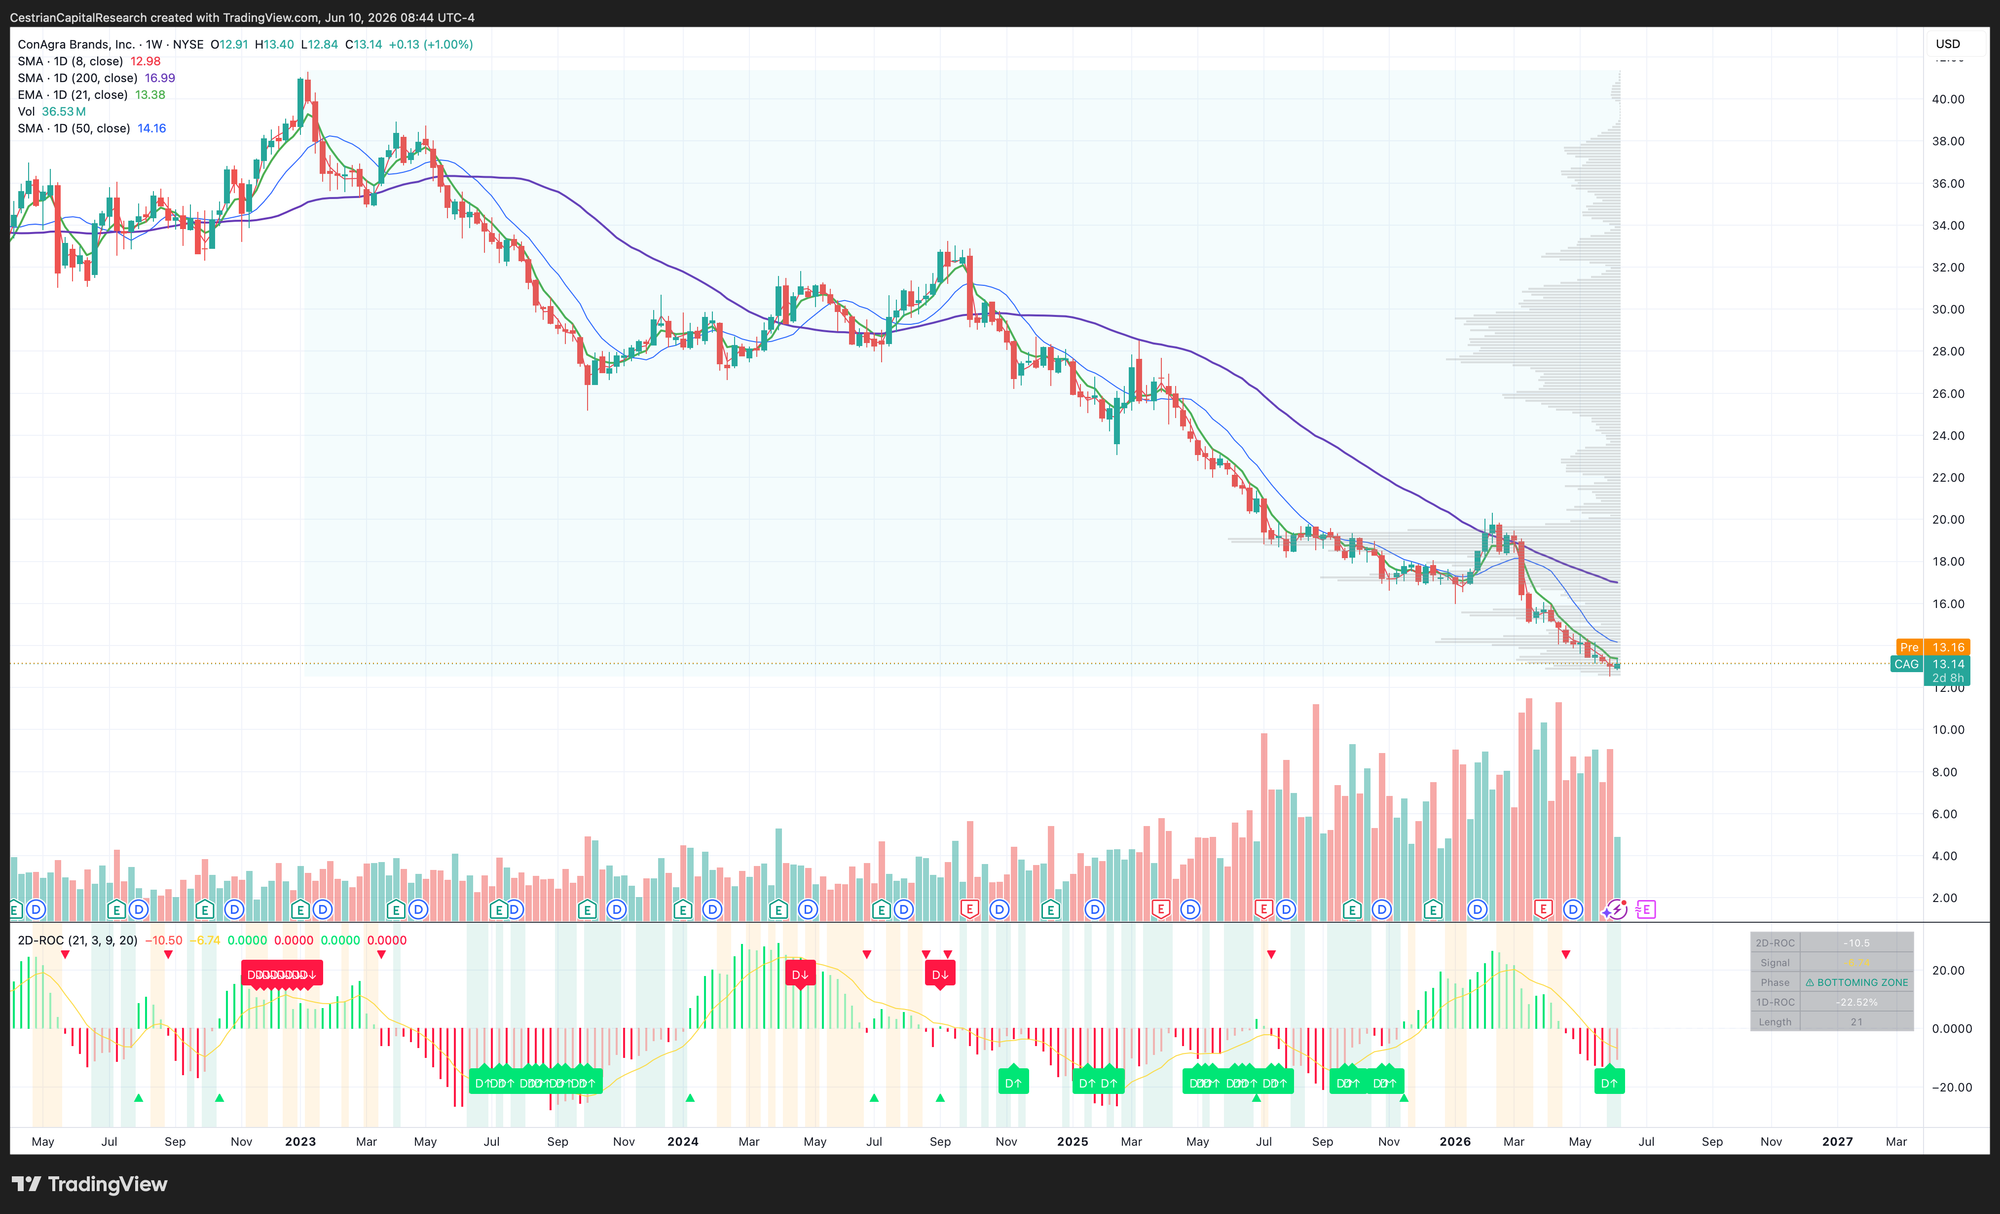
Looks to be bottoming on the weekly chart above. Our experimental 2nd-derivative indicator thinks so too. (I would not trust it by itself yet).
I am in this stock already, as disclosed ahead of time to our Inner Circle members. The trade I chose was: a trailing stop placed below the recent lows (about a 6% trail), a decision that I would be comfortable losing 0.5 units of capital on this trade [in our services I just use ‘one unit’ to mean a consistent amount of capital, so our members can apply the logic to their own accounts, whether a unit is $1k or $10m], so, 0.5/0.06 = an 8.3 unit position.
The stock is up and over the 8-day SMA, yet to recapture the other moving averages we use.
Disclosure: long $CAG
The Campbell’s Company, $CPB
This stock is on the move already. I am long the name, as disclosed to our Inner Circle members prior to opening the position.
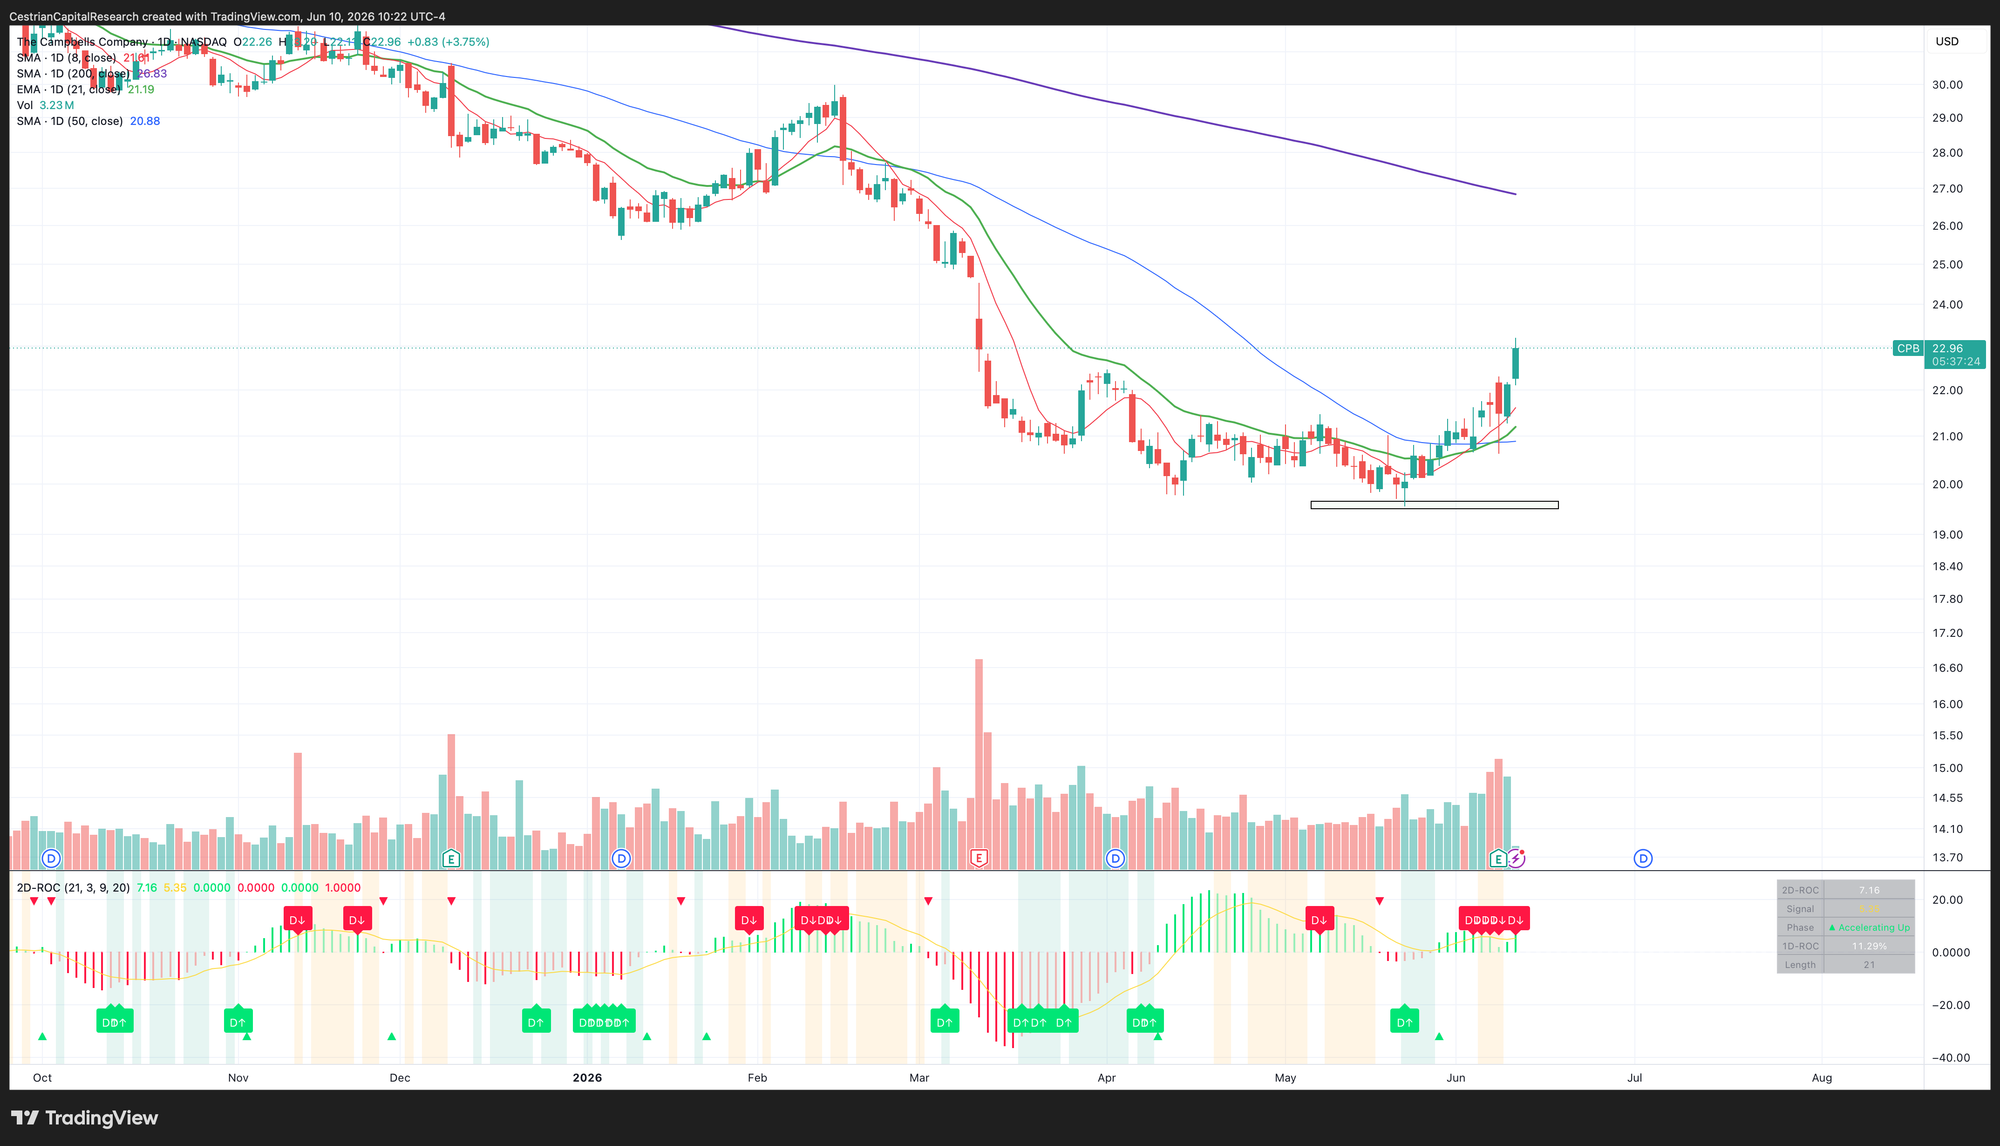
So, the same logic - a trailing stop below the recent lows, which was about 15% when I opened the trade, would be about 18-19% now (so you may wish to consider a tighter trailing stop, say just below the 50-day SMA which is at $20.88 at the time of writing), I took the amount I was willing to lose on the trade (0.5 units) to size the position (0.5/0.15 = 3.3 units) and then placed the order. It’s started well but I would expect resistance at the 200-day SMA (which is at $26.82 at the time of writing).
Disclosure: long $CPB
General Mills, $GIS
A similar chart to CPB. An 8% trailing stop right now puts your stop below the recent lows. The 200-day SMA, likely resistance, is at $43 and change.
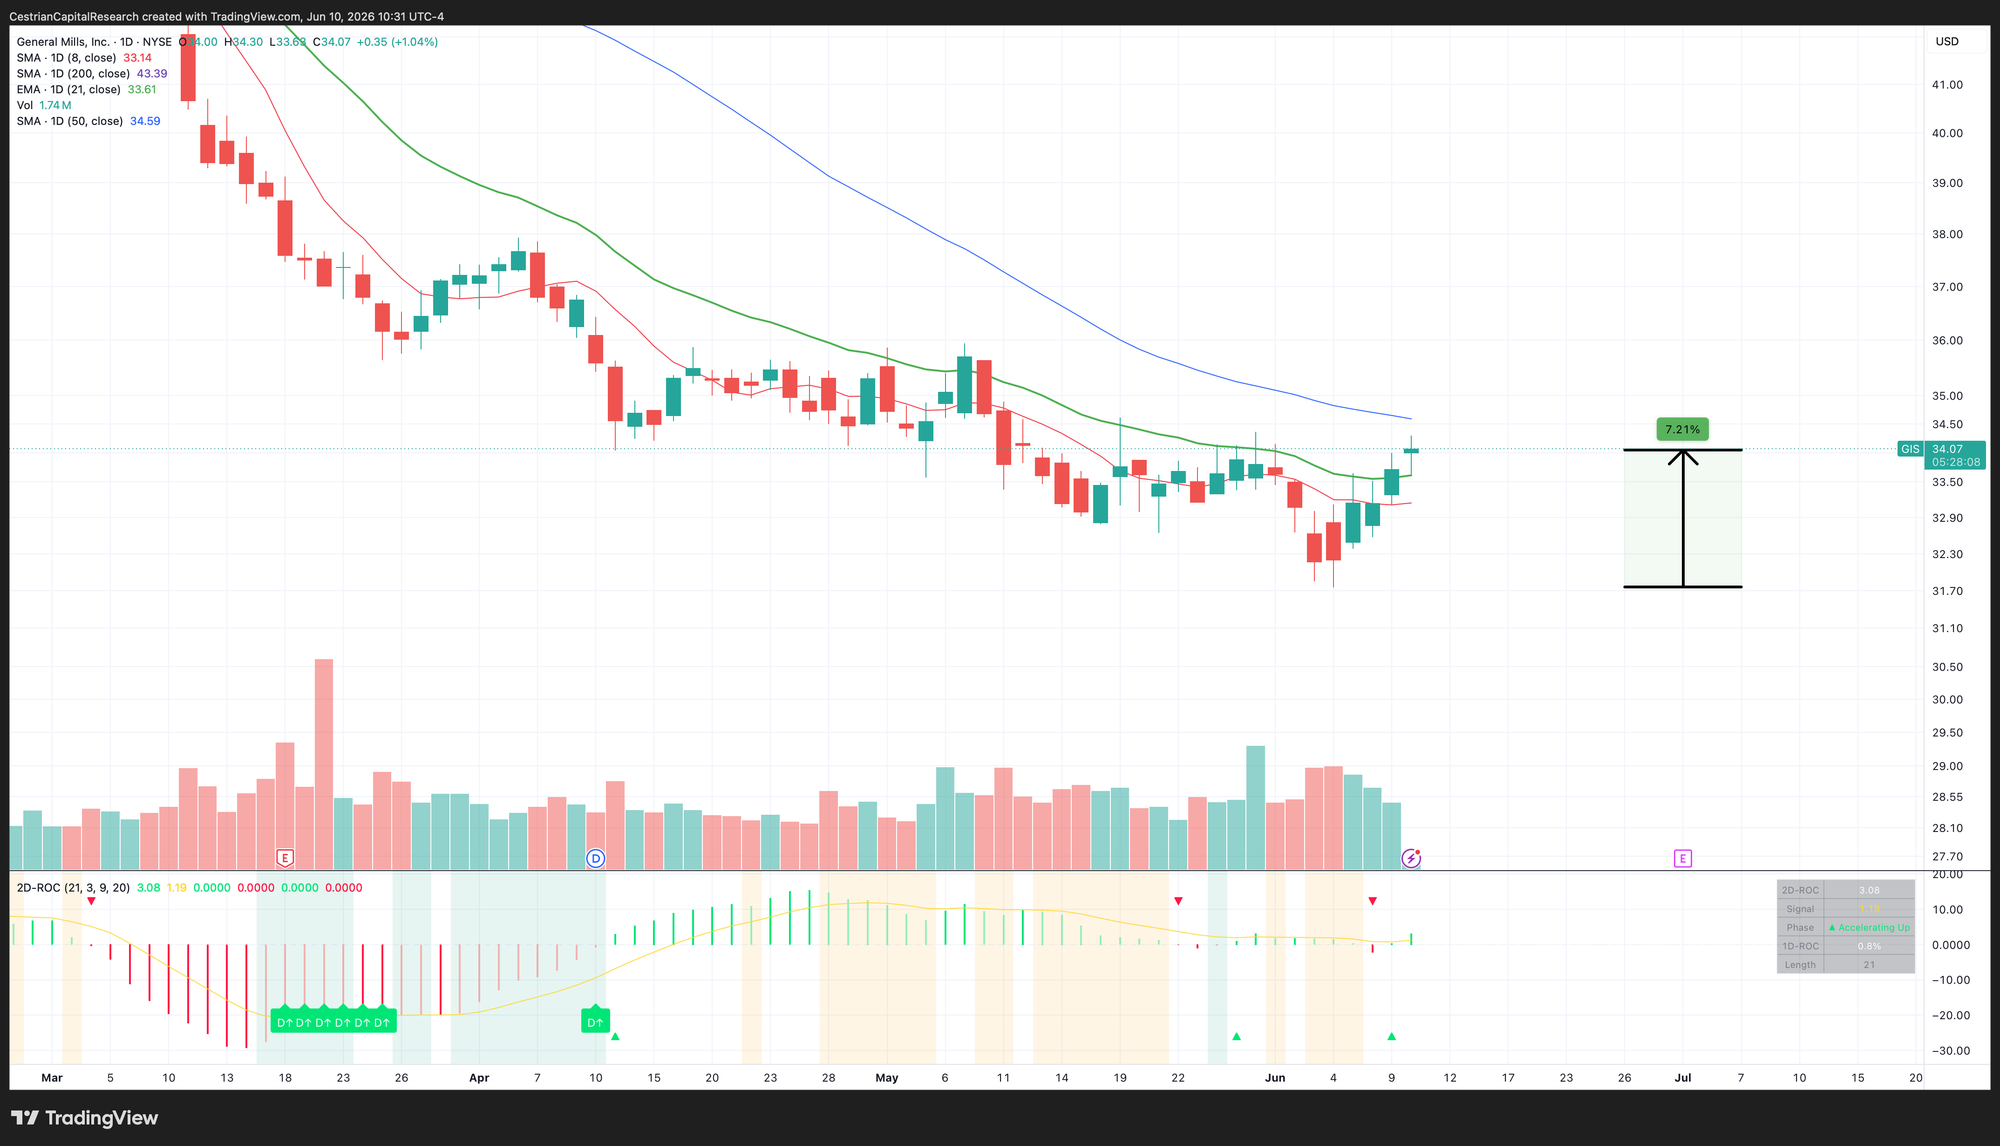
I have no position in GIS at this time but may open one in the near future.
Cracker Barrel, $CBRL
Finally - I think this one has run already so I am waiting to see if it falls back to earth for a better entry point. If you recall, this company was the subject of endless online hate which, as if by magic!, coincided with a lot of accumulation of the stock.
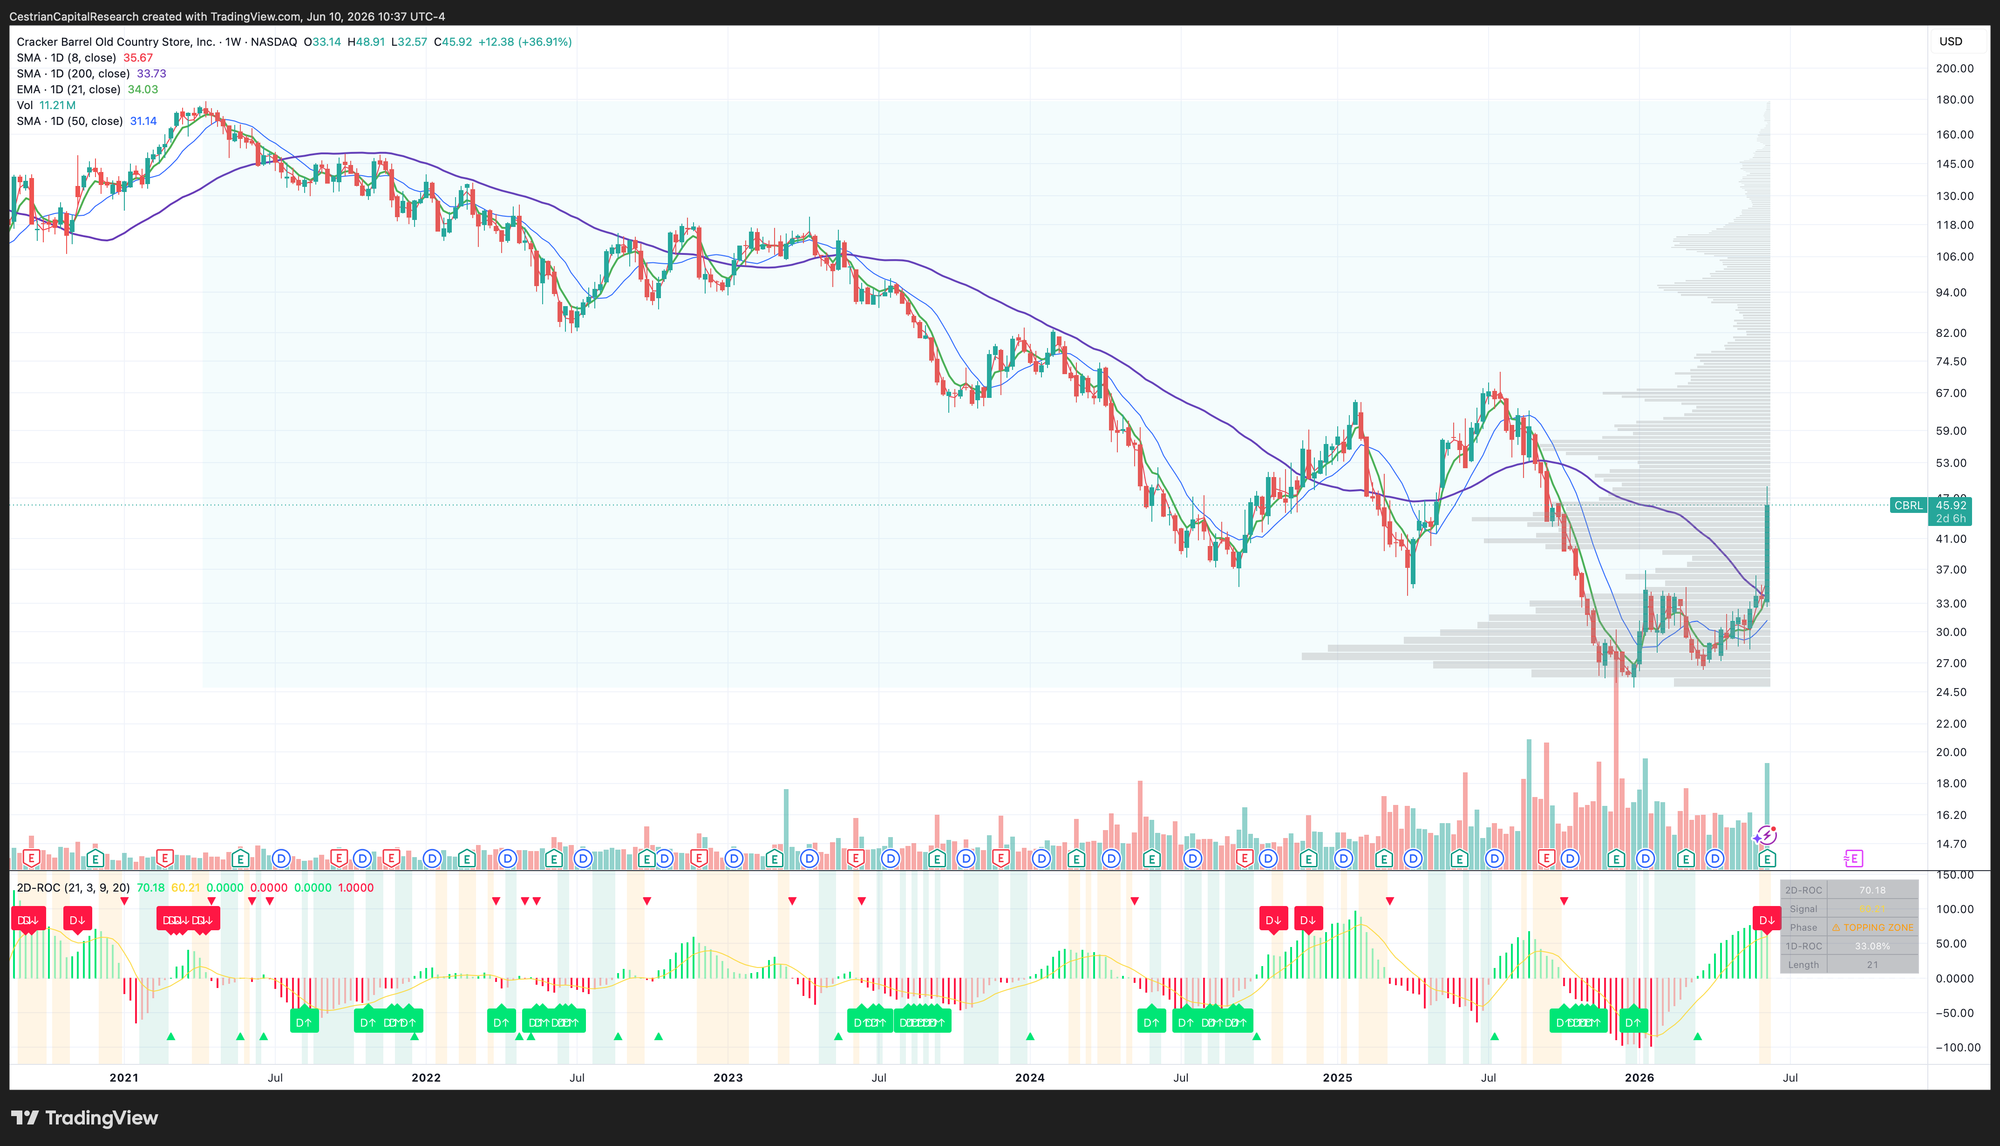
No position at this time.
As always, any questions, reach out!
Cestrian Capital Research, Inc - 10 June 2026