
TSLA US - Hold - Rangebound Action Persists, Potential Breakout Ahead.

DISCLAIMER: This note is intended for US recipients only and, in particular, is not directed at, nor intended to be relied upon by any UK recipients. Any information or analysis in this note is not an offer to sell or the solicitation of an offer to buy any securities. Nothing in this note is intended to be investment advice and nor should it be relied upon to make investment decisions. Read our full disclaimer, here.
Analysis by Alex King for Cestrian Capital Research, Inc.
Summary
I rarely see any cold-as-ice analysis of Tesla fundamentals or its stock. Coverage seems to be split into (i) the I-Hate-Elon vs. I-Love-Elon dyad, which isn’t much use, and the (ii) The Stock Will Grow Into Its Valuation vs. The Stock Is Wildly Overvalued divide, which also doesn’t matter.
I think we can think about Tesla in three ways. Firstly, the step-function story of the stock since its IPO. Secondly, the extraordinary level of cash generation and cash management since around 2021 - virtually all the cash ever generated after capex now sits as Treasuries on the company’s balance sheet, presently $28bn-worth. And thirdly, that Musk does tend to reward patient shareholders; it’s not exactly a niche theory to say I expect TSLA and SPCX to combine, but I do expect this to happen and I would be surprised if it didn’t work out well for those same patient shareholders.
The stock is volatile and in the middle of a multiyear range at the moment. We rate at Hold, by which we actually mean “hold” not “sell, but we don’t like to say sell”. Heroic buying at this stage could see the stock re-test the mid-to-high $200s en route to a potentially much higher price - I think new all-time-highs are genuinely possible - so your desire to act rather than just hold is likely determined by your tolerance for volatility more than anything else.
What follows deals in numbers and charts. There is no mention of robots, self-driving cars, Robotaxis, DOGE, the oil price trajectory, or any other input or output factors. With TSLA analysis, I believe cold-as-ice is the way.
Financial Fundamentals
Alright so remember to stop thinking about whether you love or hate Elon. This is a great business. This is a Buffett kind of business. Net cash has risen every single quarter except one (Q1 2024) since at least early 2021. Yes, that’s five years straight with only one quarter down; the down quarter saw net cash drop by just 10% and then the upward trend re-commenced.
That net cash has been achieved by (i) selling wheeled things at a cash profit, which as VW, Stellantis, Porsche and many others will tell you is not at all easy, and then (ii) not blowing the cash on frivoloties but instead parking it in Treasuries. Look at the two green lines highlighted - cumulating operating cashflow minus capex vs. short-term investments (Treasuries in the main); they move in lockstep. Don’t confuse Musk’s Internet theatrics with poor financial management.
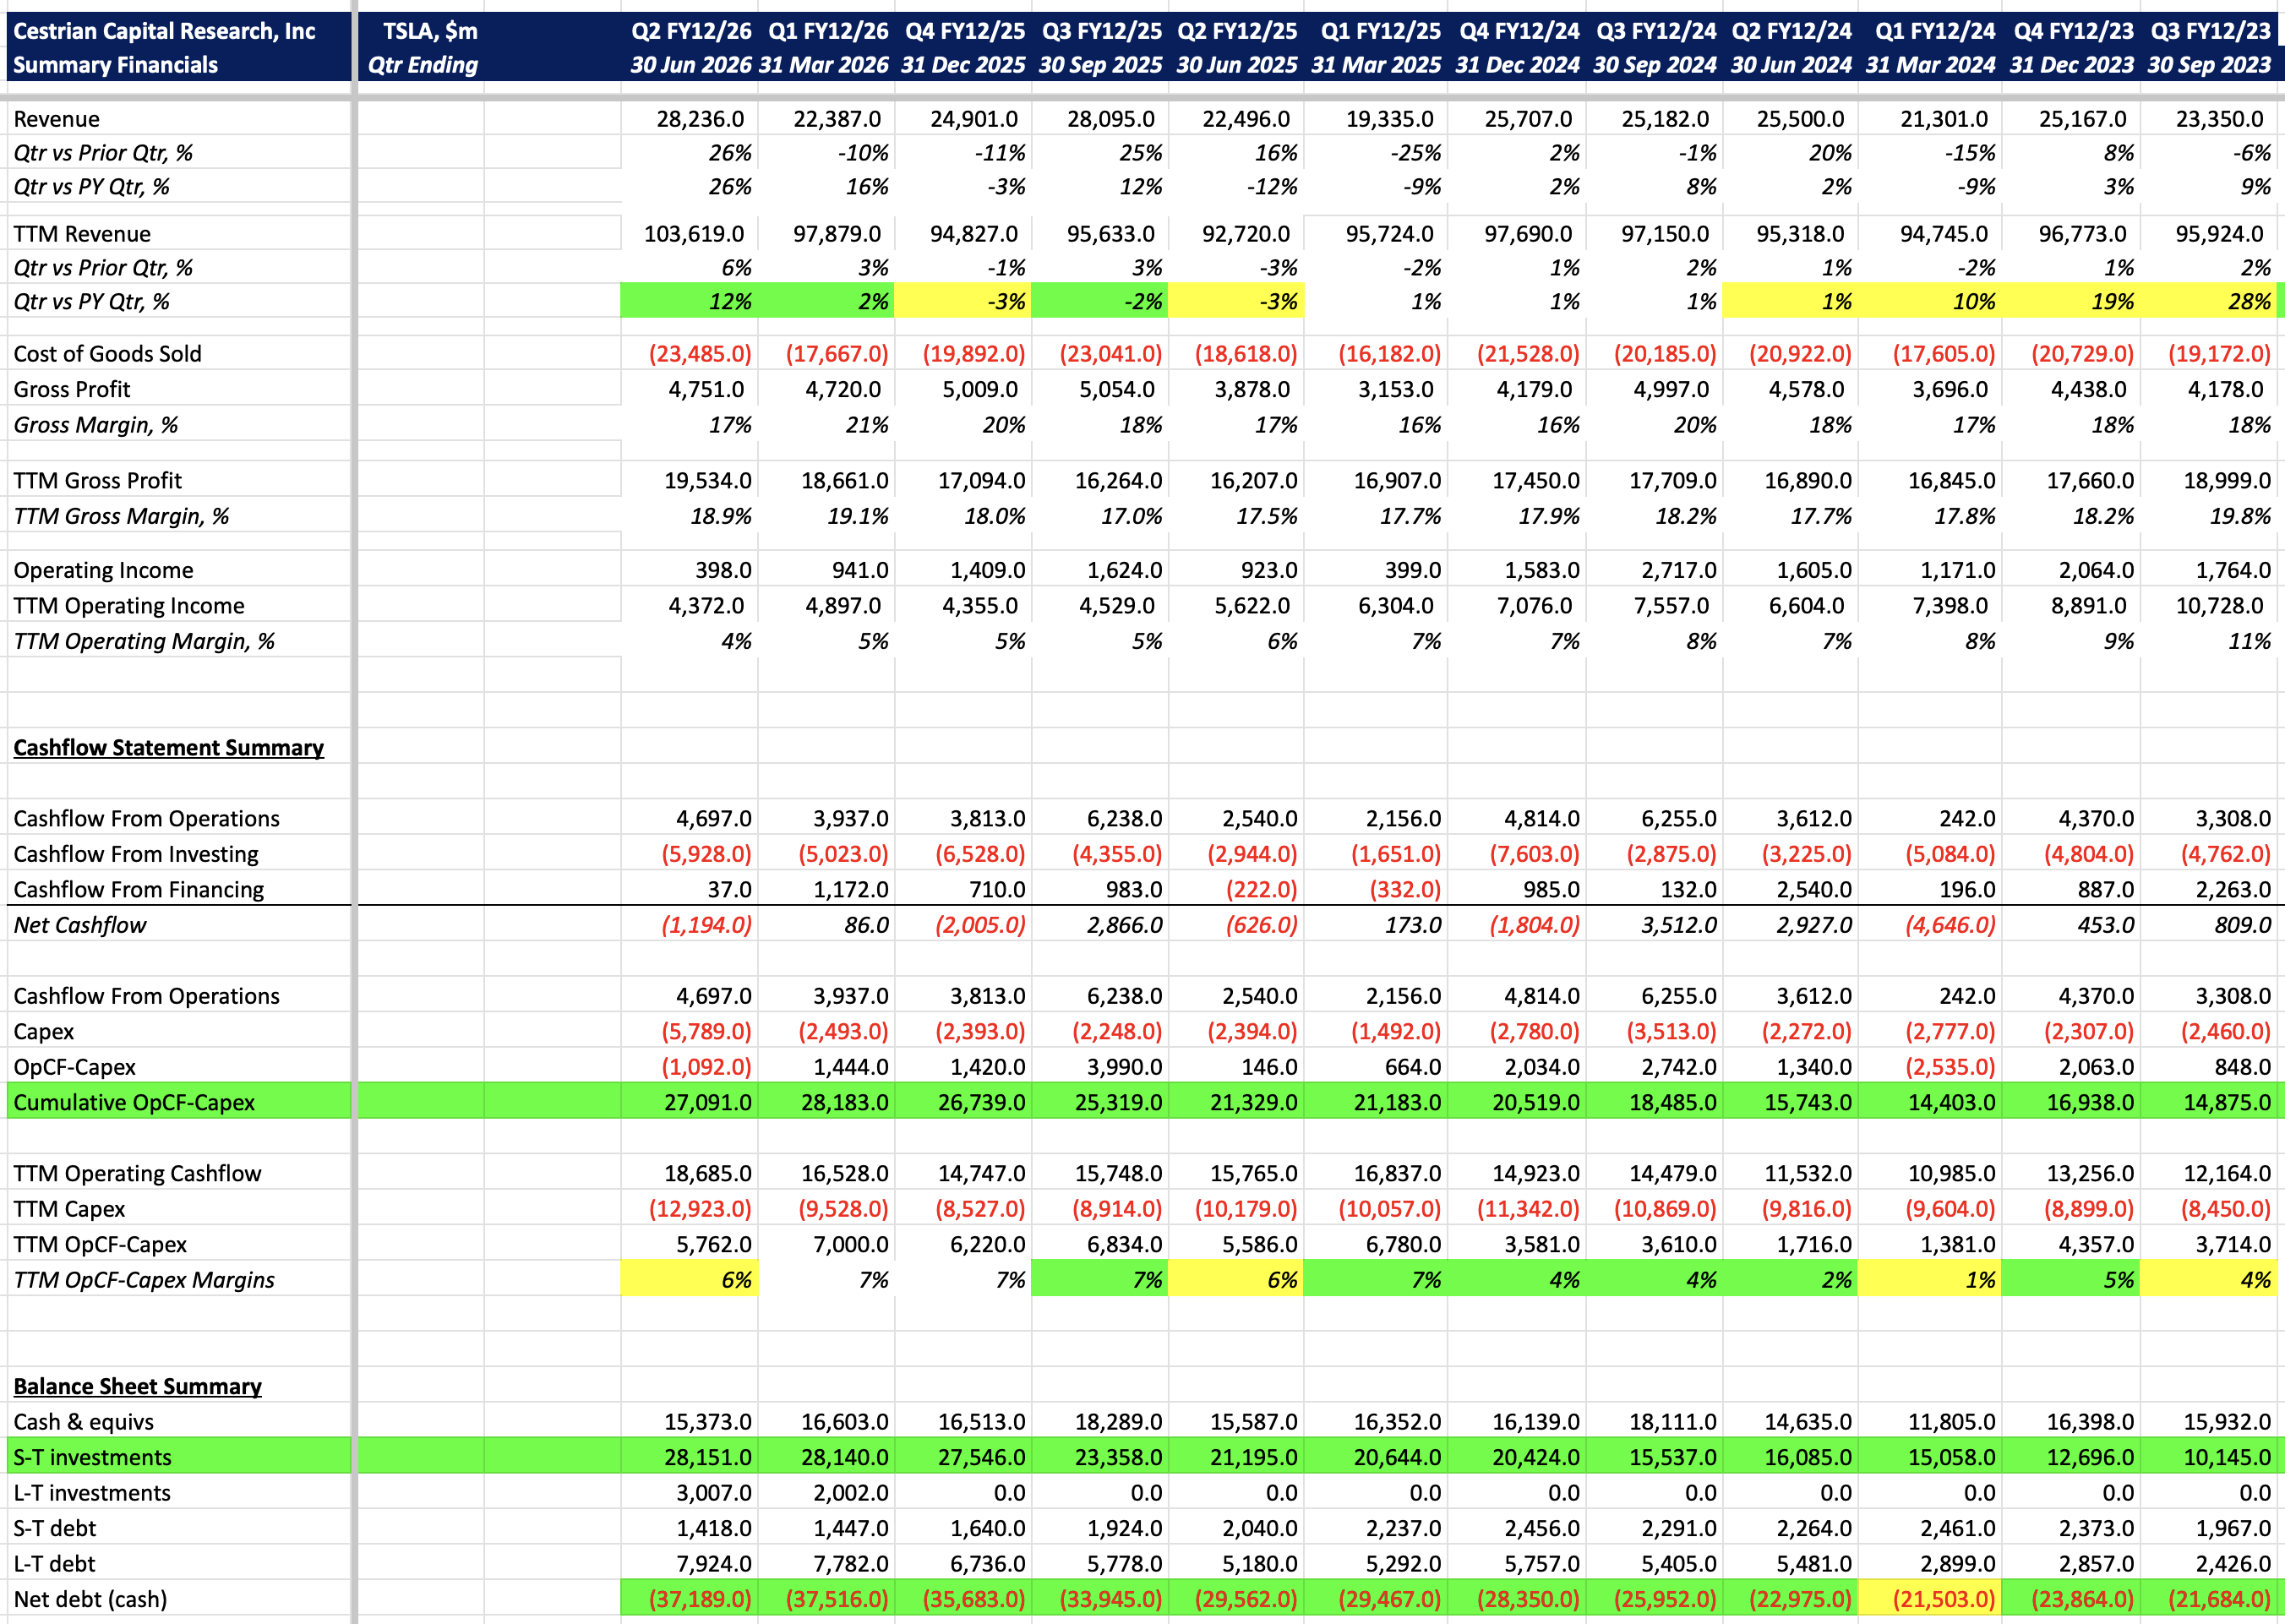
Growth is picking up once more, in part due to an easy comparable set; the company fell from favor last year and its sales numbers took a rapid and sizable hit. Growth rates at these levels are likely not sustainable; mid-single-digit TTM revenue growth is more likely on the current product plan is my view.
Valuation Multiples
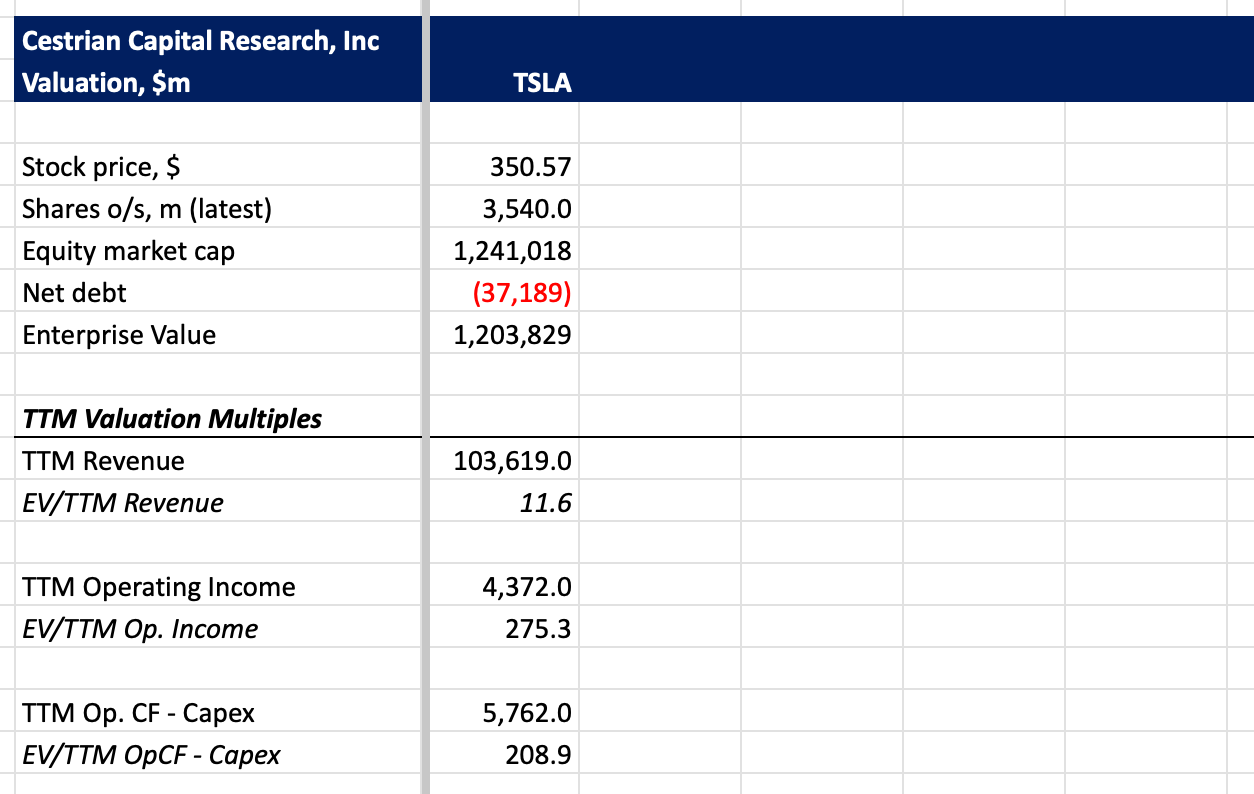
This is where mavens delight, of course. Yes, the stock valuation is wildly unpinned from fundamentals, but since the dawn of time that has been true for many securities. I am not sure exactly when this Dreamtime was when all stocks traded based on the CAPM model, but I am pretty old and it was before my time, so. Would I buy TSLA because of its valuation? No. Would I sell it because of its valuation? Also no.
Stock Chart
The most important chart is, I think, the longer term one. Here’s the story of the stock as I see it. You can open a full page version of this chart (which runs to yesterday’s close) here.
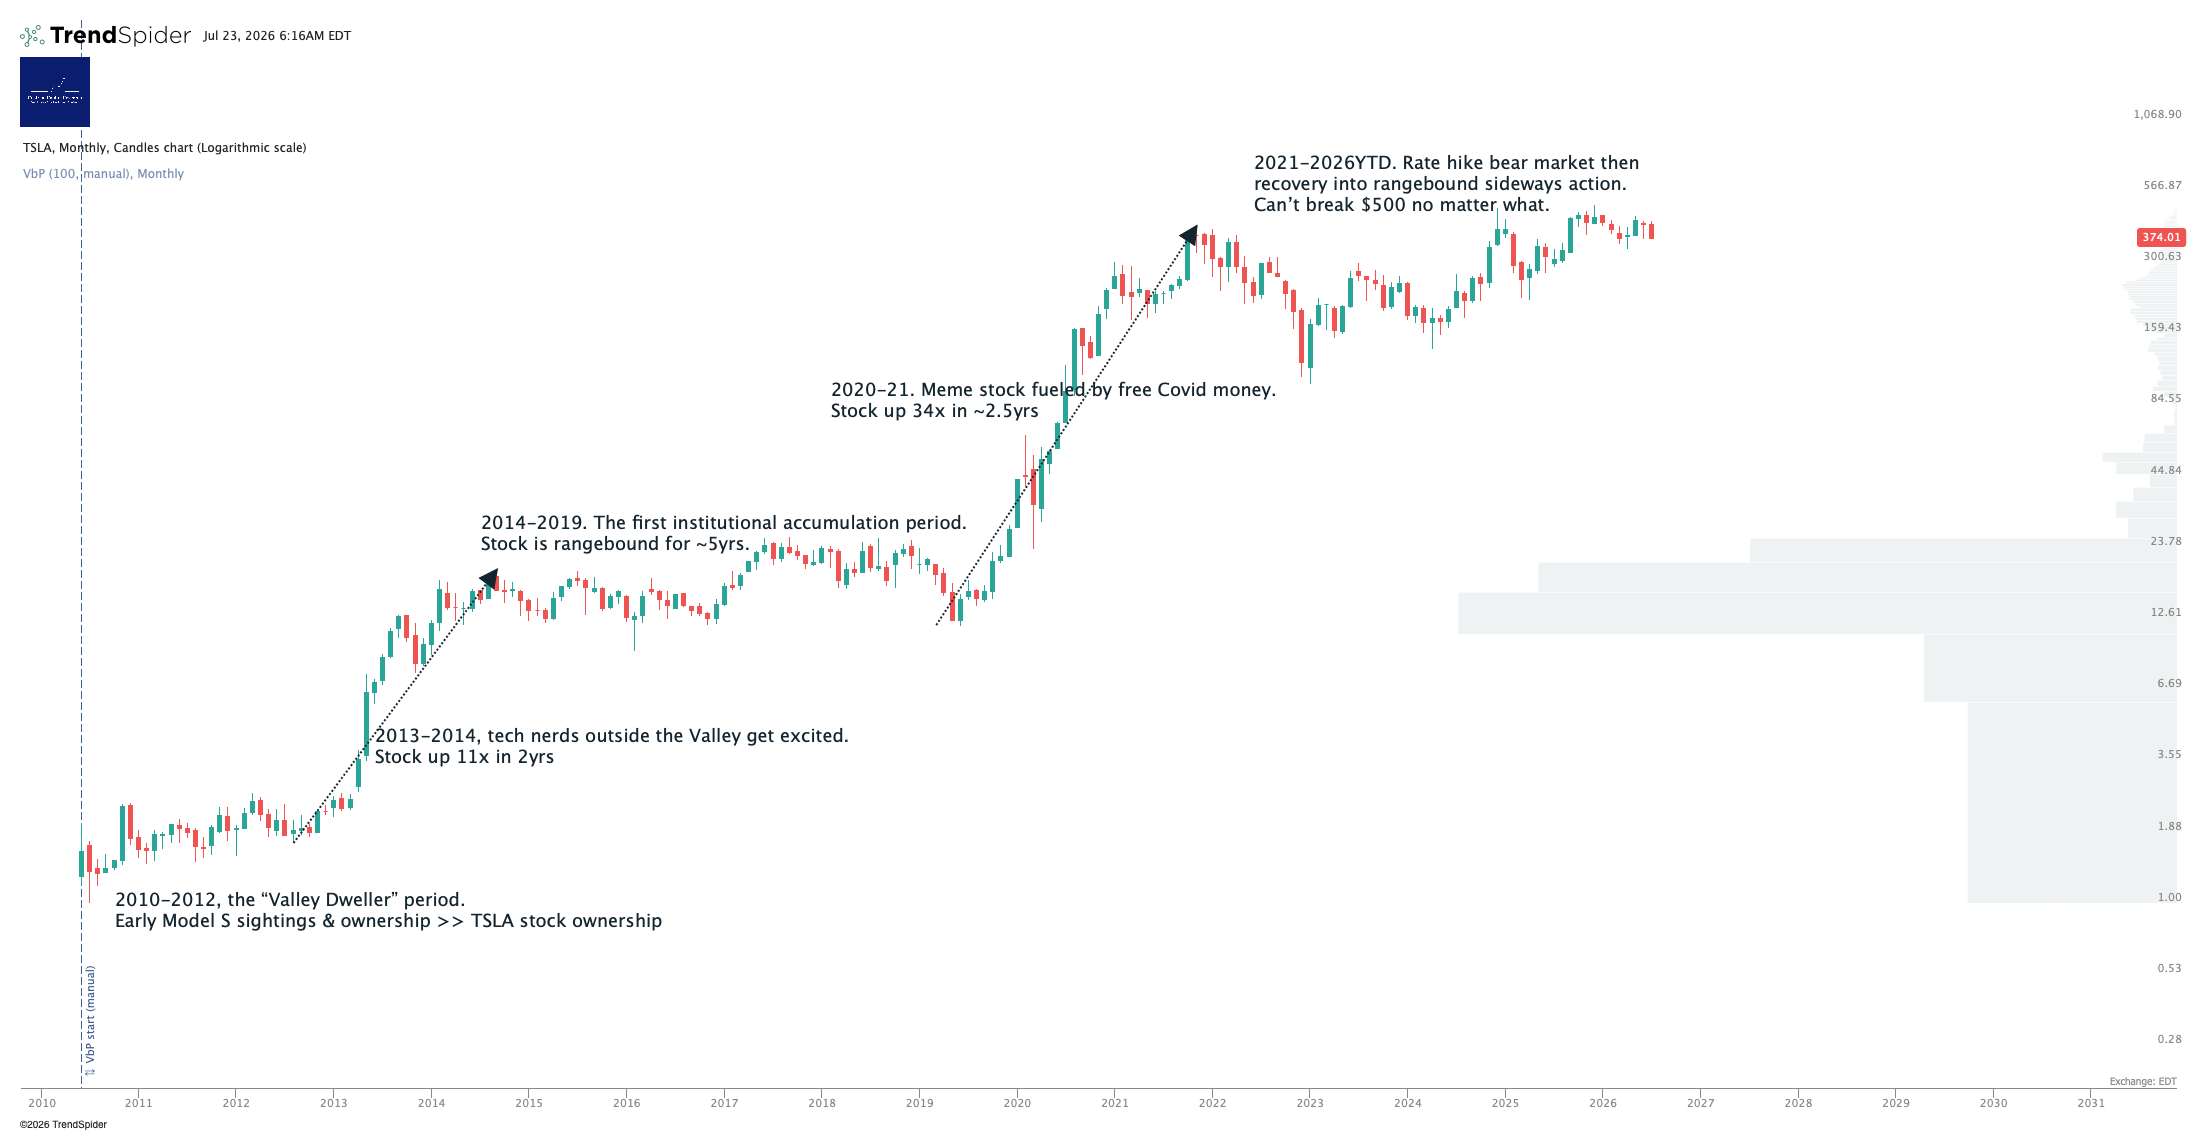
The stock follows a step function pattern - years in rangebound sideways action, then a rapid move up, then more years of rangebound action. We’re presently almost five years into the current rangebound action.
Here’s a shorter term chart. You can open a full page version, here.
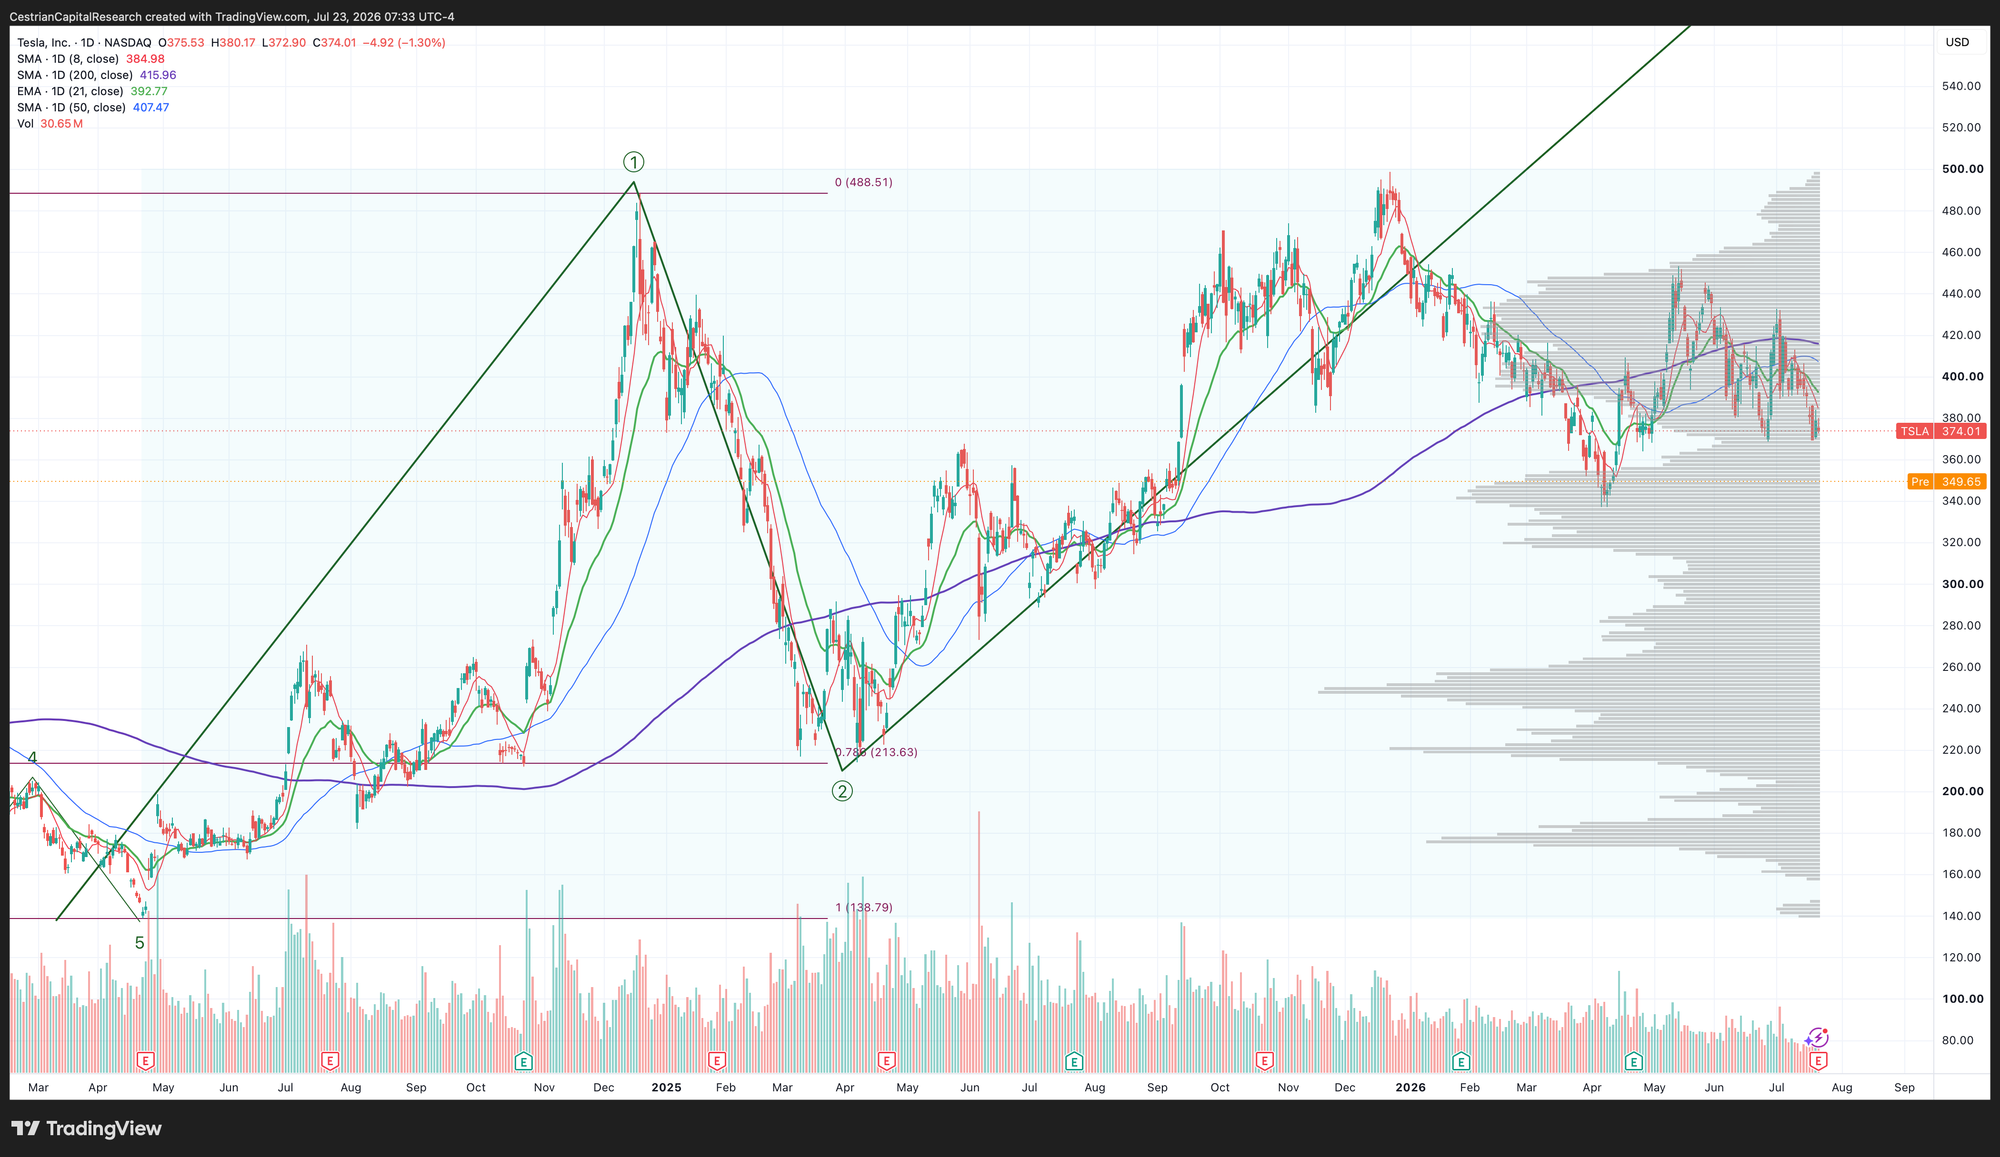
In the near term, until the stock reclaims its 200-day SMA ($416 at present, vs. spot of $350 or so), any committed buying is for the true believer. I am insufficiently brave. Up and over that 200-day though, and we can see the stock re-test its all-time-highs (a touch under $500) and beyond in my view. Probably some corporate activity with SPCX is needed to get there, I don’t know, but does the driver really matter? Are we living in the Dreamtime or are we just here to try to make a little money?
We rate at Hold, which again actually means Hold. The volatility is likely to continue. As long as above $215 or so I believe the stock has bullish potential; you can’t use stops at $210 on a $350 stock though - what’s the point - so I think you either own it and indulge the gyrations or you don’t own it, whatever gives you the more peaceful easy feeling.
Cestrian Capital Research, Inc - 23 July 2026.