
Figma Q1 FY12/26 Earnings Review (The Cestrian Circle Newsletter) - NO PAYWALL

DISCLAIMER: This note is intended for US recipients only and, in particular, is not directed at, nor intended to be relied upon by any UK recipients. Any information or analysis in this note is not an offer to sell or the solicitation of an offer to buy any securities. Nothing in this note is intended to be investment advice and nor should it be relied upon to make investment decisions. Read our full disclaimer, here.
Analysis by Alex King, CEO, Cestrian Capital Research, Inc.
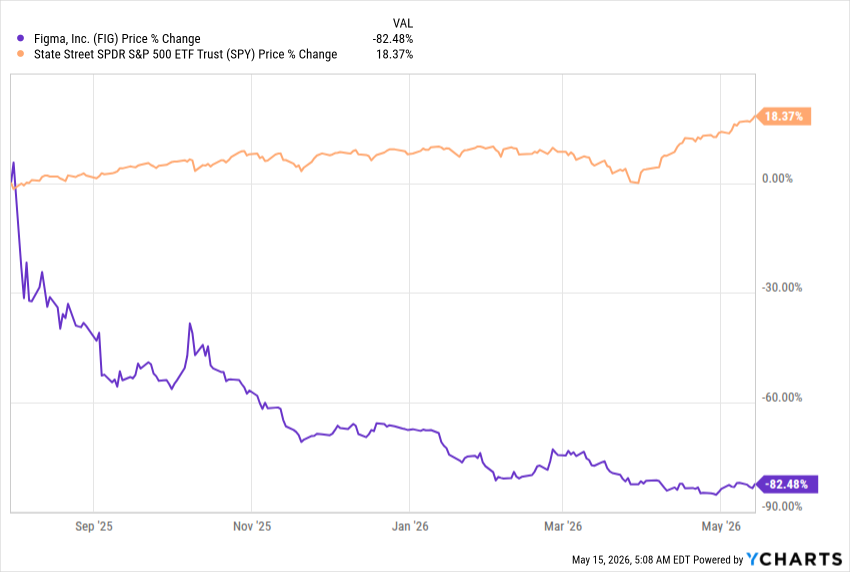
Figma, courted by $ADBE in its early days with a price of $20B on its head - the deal was nixed by the FTC on antitrust grounds - is now worth about half that. It has been one of the worst-performing IPOs I can remember. Here’s how the stock has performed since launch. Simply owning the S&P500 and doing nothing has been a much better idea than buying $FIG at pretty much any time during its life as a public stock.
The reason for the stock’s demise is said to be “because AI” - specifically the narrative around this name is, you don’t need specialist tools for content creation, content management, project creation and management and so on, in the age of Claude, because the LLMs will do everything for you for close to nothing.
This in my opinion is a false narrative, created primarily as a source of euphoria around the pending OpenAI and Anthropic IPOs. The smarter software companies will use LLMs and other AI tools internally in order to reduce cash and stock costs that arise from using humans, therewith to seek sustained revenue growth at structurally improved cashflow and net income margins. Multiple software CEOs are beginning to articulate this strategy; the most vocal of whom is Bill McDermott, the CEO at ServiceNow ($NOW).
So let’s for a moment put narrative aside and look at some facts. The primary facts to consider with Figma are (1) the stock chart, which looks like it may have bottomed out and be turning up, (2) the fundamentals, which look solid, and (3) the valuation which I would describe as stretched but not silly, at least in the context of the present market environment.
Figma Stock Chart
There is a good deal of volume down here at the lows, which is often-but-not-always a telltale sign of institutional accumulation. We rate the stock at “Accumulate” between $17-22.50/share, matching the high volume nodes you see on the volume x price (horizontal bars) indicator.
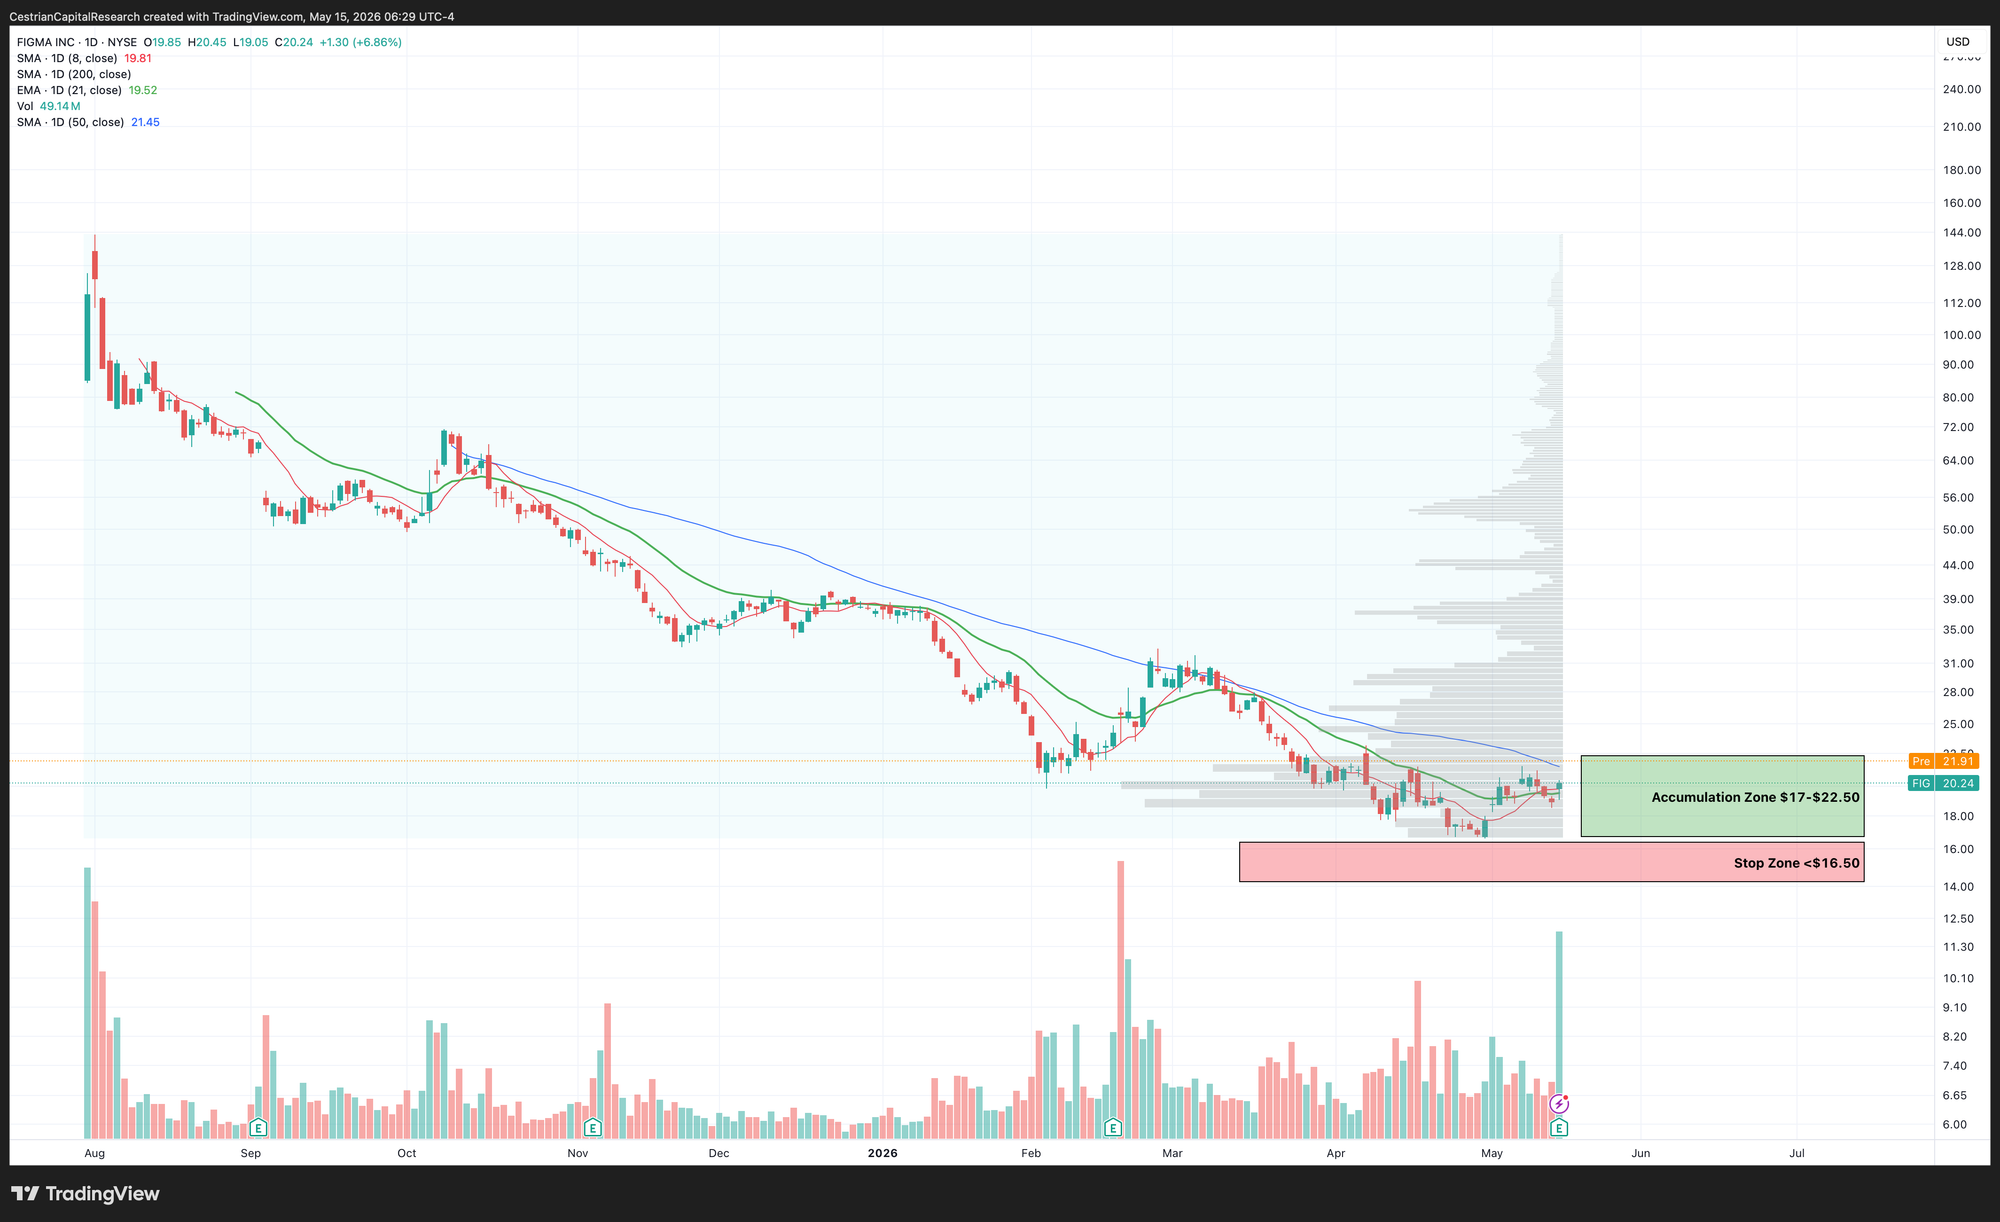
If the stock starts to make new lows, say below $16.50, something is wrong and it is likely better to step aside to see what happens - so our ’Stop Zone’ starts at that level.
The short-term moving averages we use (red line, 8-day simple moving average, and green line, 21-day exponential moving average) are starting to point upwards; the stock closed over its 21-day EMA yesterday before the earnings print. The true price reaction will be today during regular market hours - specifically today’s closing price. If it closes over that 21-day EMA once more I would see that as confirmation that the tide had likely turned for $FIG stock.
You can open a full page version of the chart, here.
Financial Fundamentals
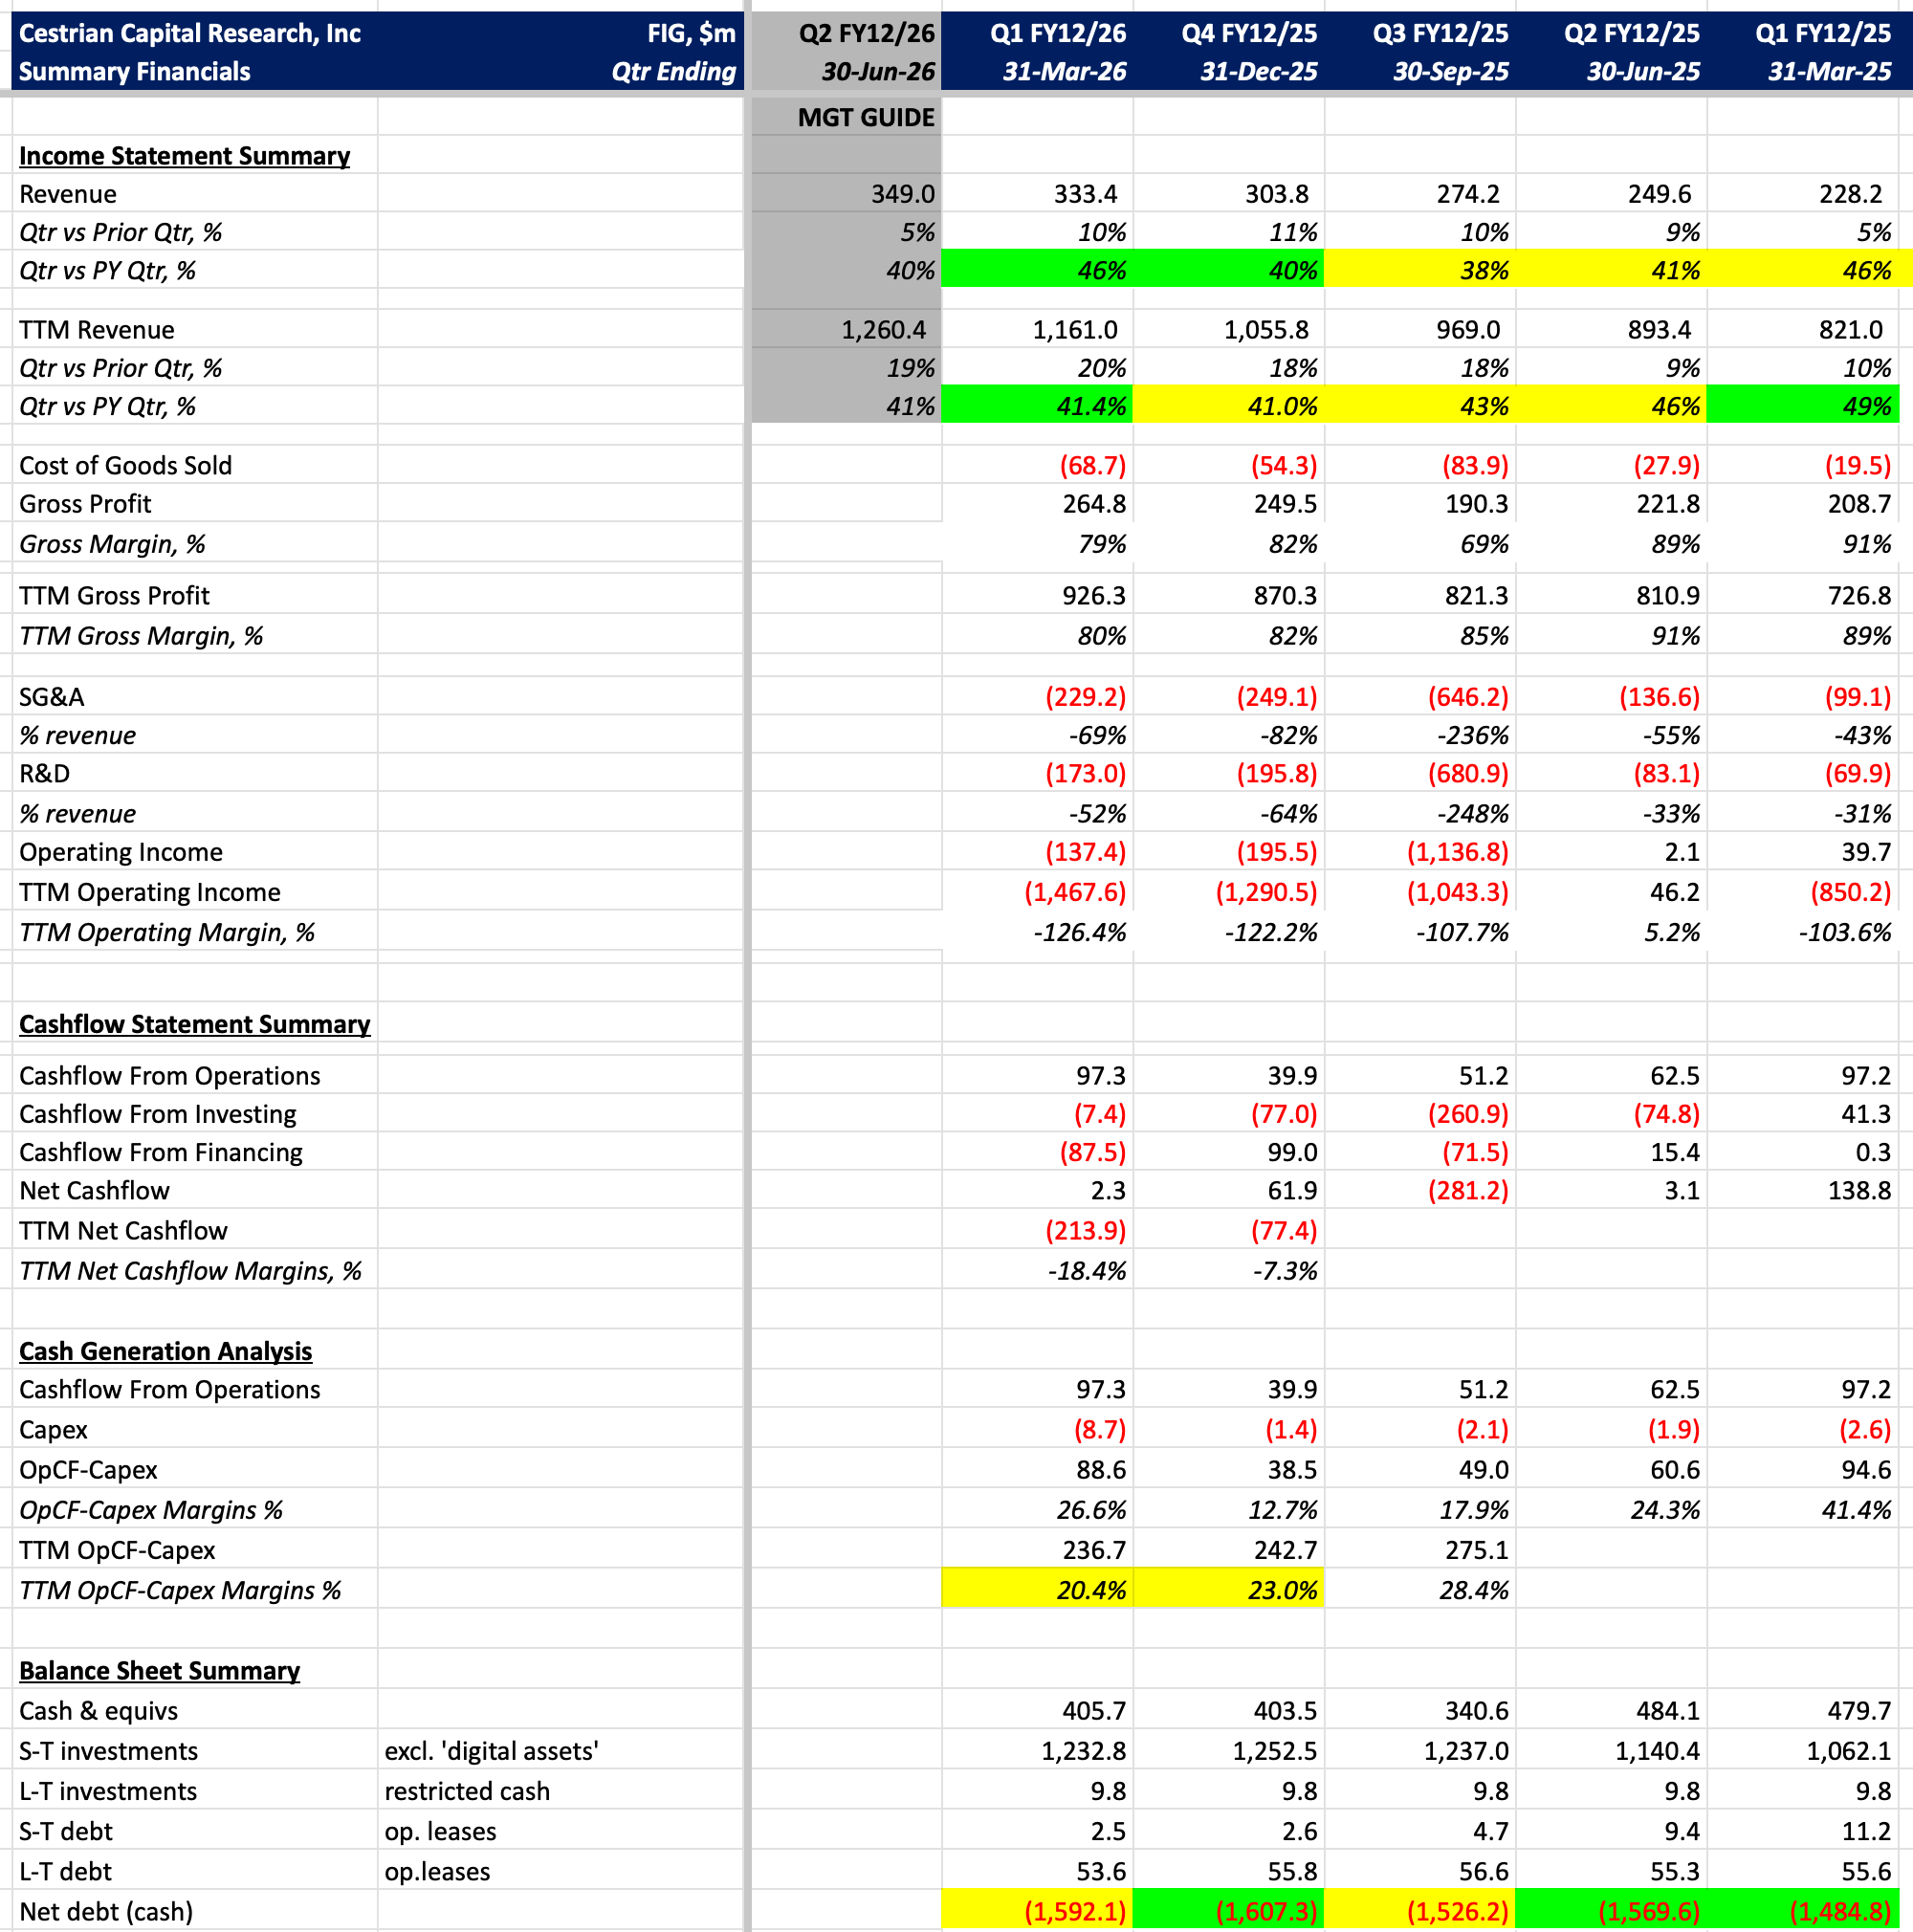
Revenue growth looks to be settling into a 40-50% pa. range on a TTM basis over the last year or so; this quarter, growth accelerated to +46% vs. this quarter a year ago. On the margin front - I suggest focusing on the TTM operating cashflow minus capex line, which sits at 20% right now after decline from 28% two quarters ago. This measures the actual cash produced by the business after capex. If growth accelerates further it’s fine if this drops. What you don’t want to see next quarter is growth rates declining and those margins declining.
The company has about $1.6bn of net cash on hand which should be more than sufficient unless it plans some significant corporate acquisition or other.
Valuation
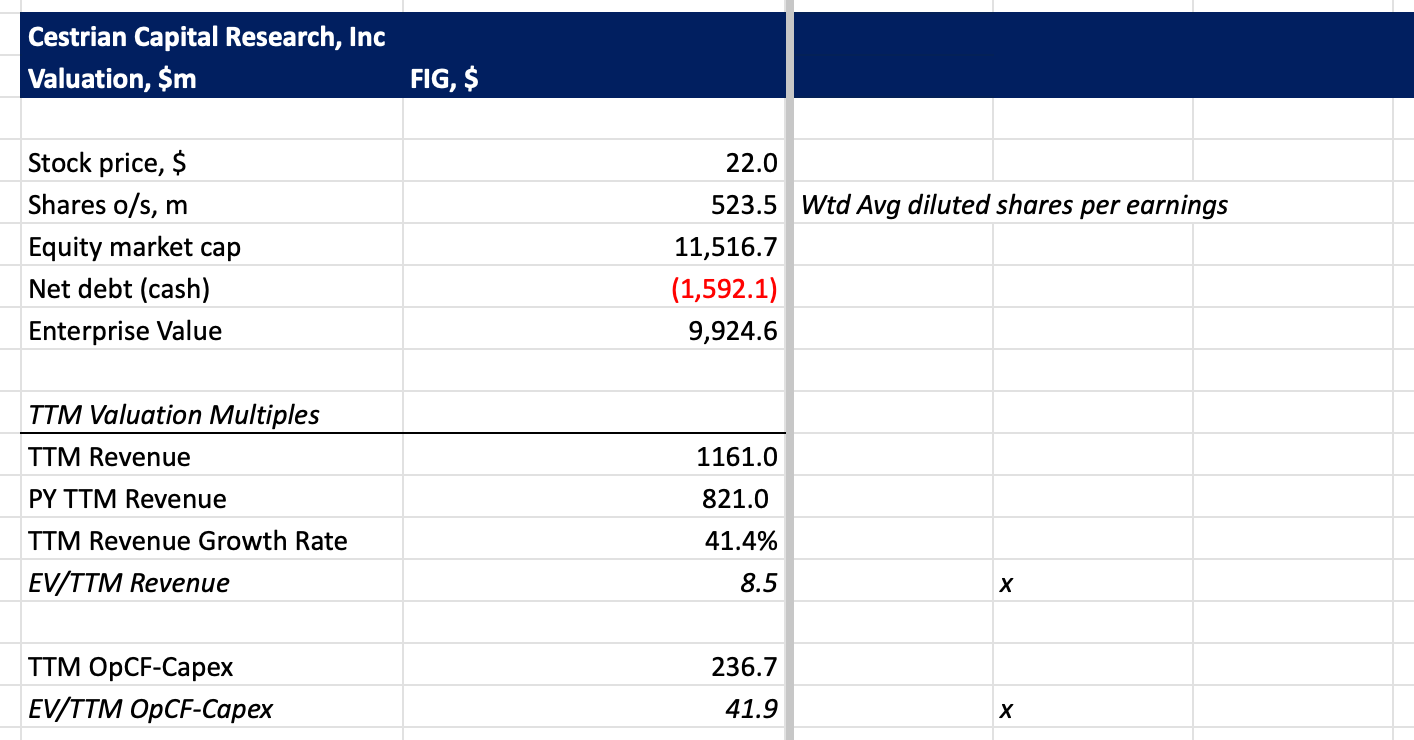
Software stocks in the present market trade on (i) the actual momentum of the stock - up begets up, down begets down - and (ii) growth rates - accelerating growth = stock up, all other things being equal, and flat or decelerating growth = stock down, all other things being equal. The fundamental valuation isn’t important at present. For the record it is extended but not silly in my view.
Cestrian Capital Research, Inc - 15 May 2026.
Free Trial Access To Cestrian Circle Investment Research
We are opening up a limited-time 30-day free trial for Cestrian Circle, Cestrian’s introductory research tier and the easiest way to start using Cestrian’s research regularly at a lower commitment level than Inner Circle.
Circle is built for investors who want a simpler way to stay close to markets, earnings, and trade setups.
Members receive twice-weekly research selected from trade roundups, earnings coverage, and sector reports.
Enter billing info to activate the trial, pay nothing today, and cancel before the 30 days end if Circle is not for you. If you stay, membership continues automatically at $39/month.