
Market On Close, Tuesday 13 January - No Paywall - Some Useful Stuff Here

DISCLAIMER: This note is intended for US recipients only and, in particular, is not directed at, nor intended to be relied upon by any UK recipients. Any information or analysis in this note is not an offer to sell or the solicitation of an offer to buy any securities. Nothing in this note is intended to be investment advice and nor should it be relied upon to make investment decisions. Read our full disclaimer, here.
The Great Rotation
by Alex King, CEO, Cestrian Capital Research, Inc
Active during the late 19th & early 20th centuries, Richard Wyckoff developed a concept known as ‘Wyckoff Rotation’ which we use extensively in our work here at Cestrian. You can read about the original here.

Like any method in investing and trading, it is not perfect, merely an approximation of how markets work some of the time. But such methods, when learned correctly, are useful for the investor or trader to use as a pattern-recognition method. If price and volume action have done that in the last few days, weeks, months .. then it suggests that price may do this in the coming days, weeks or months. Like that.
Now Wyckoff Rotation is a pretty useful concept to understand, because at its core it describes how the Biggest Of Big Money can Make Money out of Thin Air. Wyckoff imagined that one’s opponent in trading was a singular entity, a sort of Leviathan, which controlled the market and intended to do you a bamboozle but … because securities trades are registered and regulated, the breadcrumb trail of said bamboozlery is laid out right before you, if only you know how to spot it.
There are four stages to a Wyckoff Rotation cycle.
- Accumulation. Wherein the Leviathan takes its time to build up a suitably giant position over time. Looks like rangebound, sideways action at the lows. During this time there are mainly bad news stories about the security in question. Think tech in H2 2022 (“another lower low coming. Recession coming!”). Or biotech in Q3-Q4 2025.
- Markup. The stock breaks out to the upside. Only good news stories at this time. The Leviathan already filled its boots and is now just enjoying the ride.
- Distribution. Now the monster is selling, slowly and quietly, price is rangebound at the highs, FinX is full of “reloading”, “consolidation” and other such comments.
- Markdown. No buyers because now everyone realized that the big money left town already. Late bulls bail at a loss or hope beyond hope that one day the price decline finds support.
As I say, this is idealized but you can find this pattern all through the market on multiple timeframes. You know this if you read our work. It’s very good approximation for how big liquid securities trade, and it’s why we don’t use “Buy” or “Sell” ratings but instead “Accumulate” (within the accumulation zone), “Hold” (during markup), “Distribute” (in the distribution zone) and “Do Nothing” (during markdown).
We use rotation logic extensively in our SignalFlow AI family of algorithms. And the newest, just launched, looks for rotation across different geographies.
Coming out of the Great Financial Crisis of 2008-9, US stocks initially ran up alongside rest-of-world stocks, but began to pull away from maybe 2014 onwards. And from 2020 onwards have put clear blue water between themselves and the rest-of-world names.
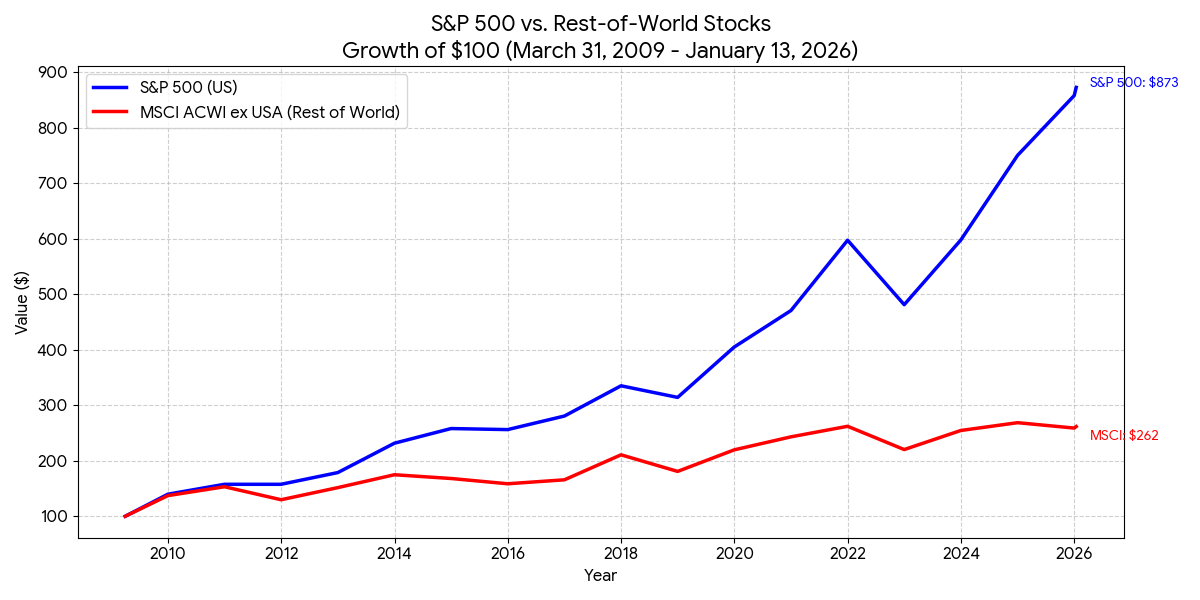
Any stock chart that looks like that blue line eventually sees some profit-taking and rotation of that capital into some names bumping along at the lows. Sometimes that is on an absolute basis ie. the leader (the US) starts to fall and the laggard (ROW) climbs, but sometimes it is just relative; the leader’s rate of growth slows and the laggard’s rate of growth accelerates.
We now have an algorithmic signal service designed to find the most compelling country ETFs. SignalFlow AI Global just launched.

This signal service uses the same underlying machine-learning technology as the rest of the SignalFlow AI algo family. Utliizing proprietary analysis of price distribution patterns, the algo identifies from a list of 15-20 country ETFs the top three which it thinks has the most compelling upside. We include $SPY in the list so that when the US’ finest 500 names are leading, the model can select S&P500 exposure. The model can also flip to cash if it thinks everything looks risky. The signal prints every day, a little before the close, giving users the chance to trade into the close, or in post-market trading, or at the following day’s open.
I’m excited about this service. In 2025 many non-US markets beat the S&P500, but unless you are a country expert with real understanding of local economics, politics, regulation &c, it can be difficult to gain sufficient confidence to put meaningful capital to work in non-US country indices. This algo changes that for me - it means we have clean analysis based on nothing but pure price, which is the best analysis of all. My approach is to put a defined allocation of capital to work in this “country rotation” strategy, just as I do to crypto, commodities, growth ETFs and so on.
As usual we’ve commenced at low launch pricing and will raise prices for new joiners after a fashion. With all our services, the sooner you join, the less you pay - we never raise prices on existing members.
Tell me more about SignalFlow AI Global.
Now, let’s get back to the US and run through our usual daily market take. No paywall today - this is the stuff we publish each and every day for our Inner Circle members.
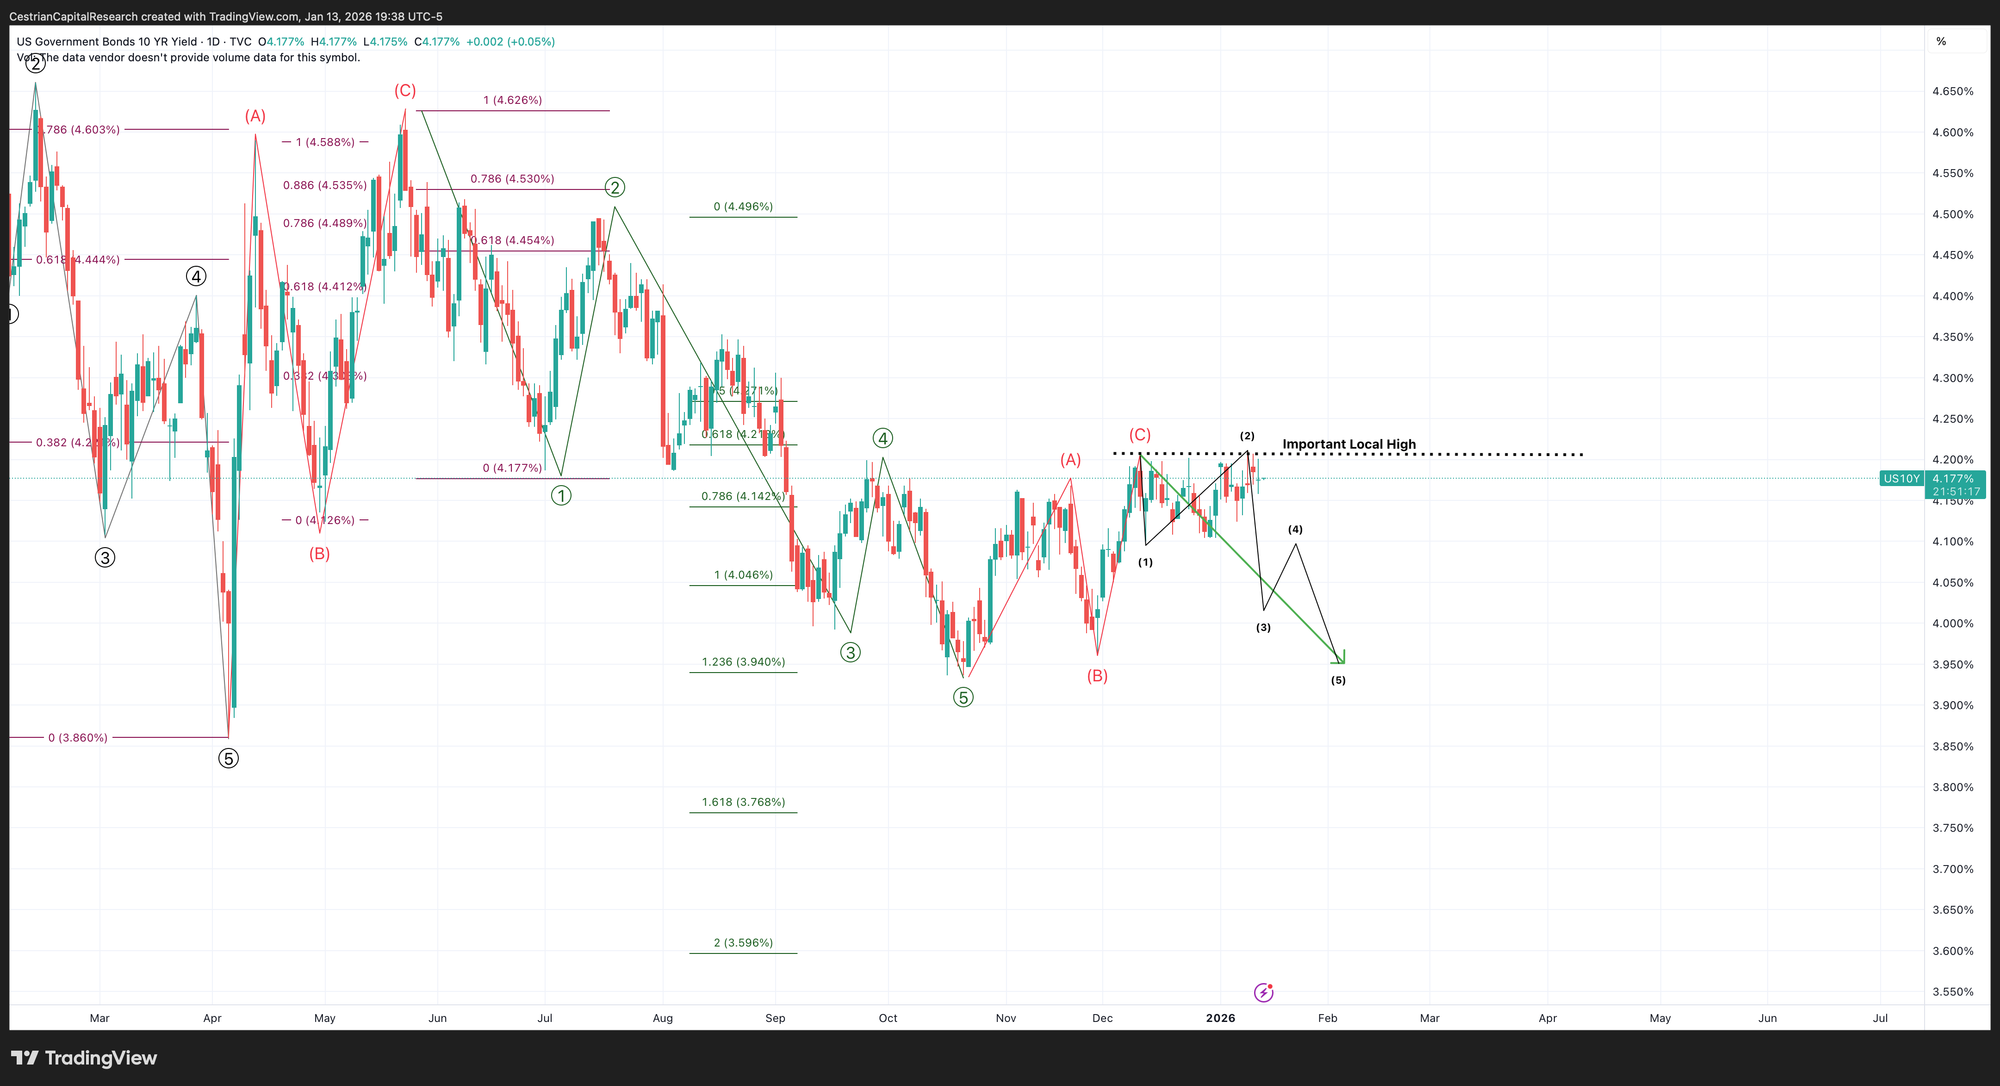
US 10-Year Yield
This 4.2% level is proving solid resistance but, really, this is the “wrong” direction vs. intended policy so I would expect to see some bond-market-calming signalling from DC before too long.
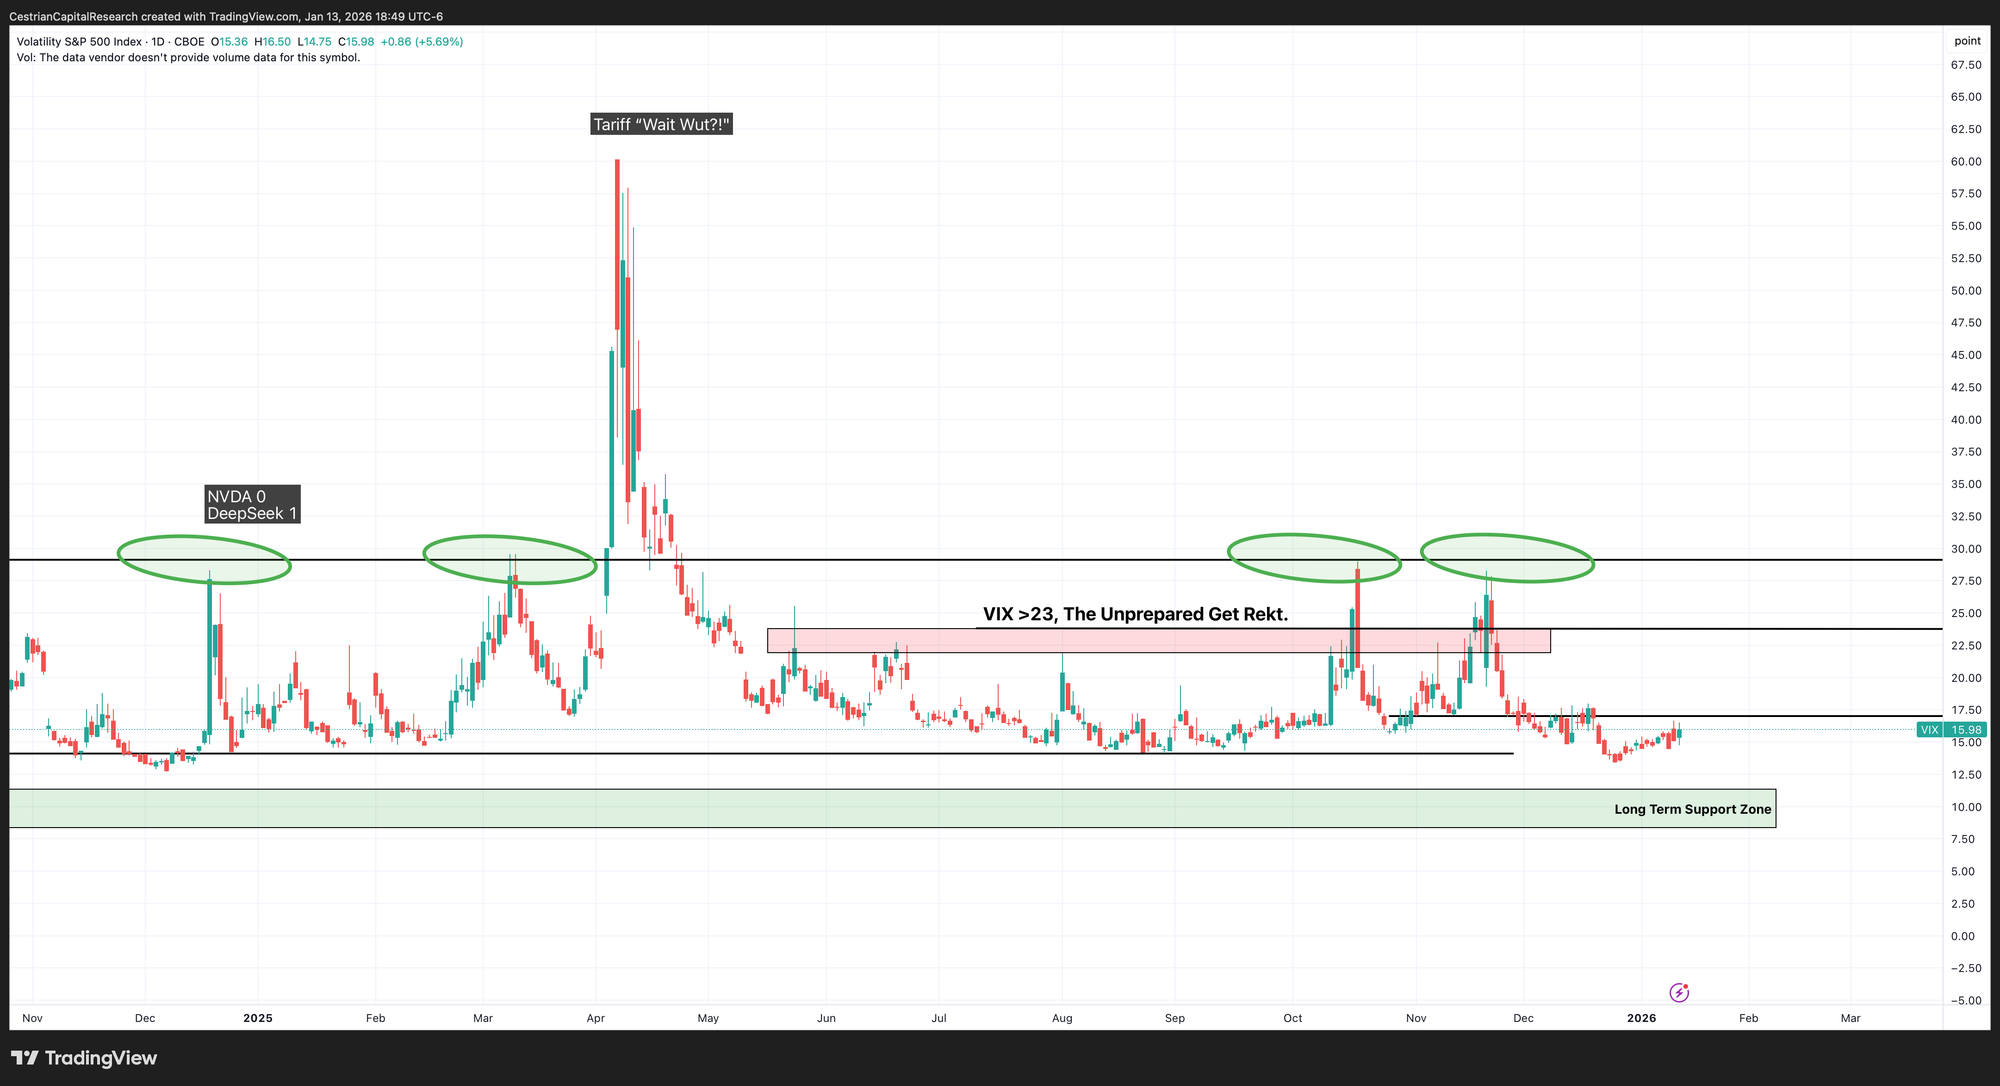
Equity Volatility
Picking up a little, folks are worried about fallout from the pending Supreme Court ruling on tariffs perhaps.
Disclosure: No position in any Vix-based securities.
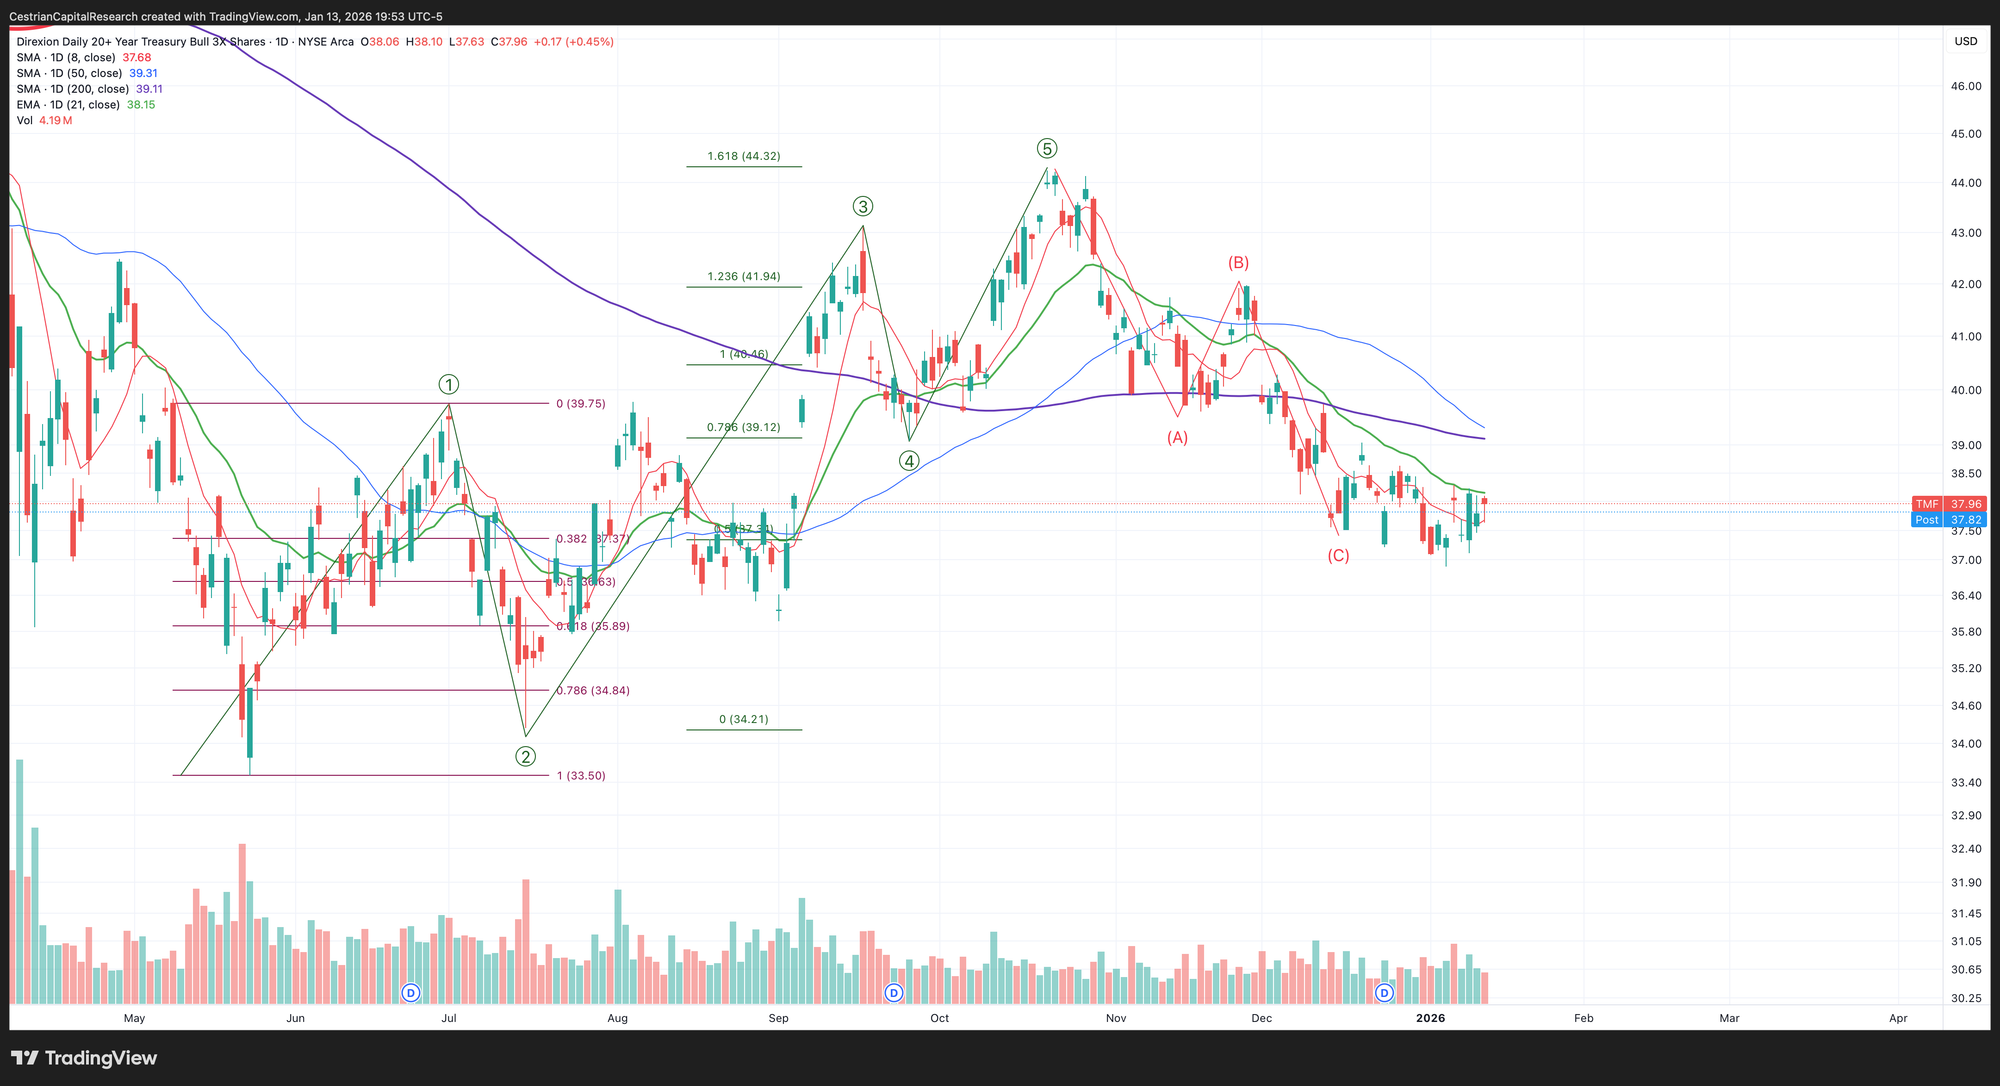
Longer-Term Treasury Bonds (TLT / TMF)
No change. Still bullish.
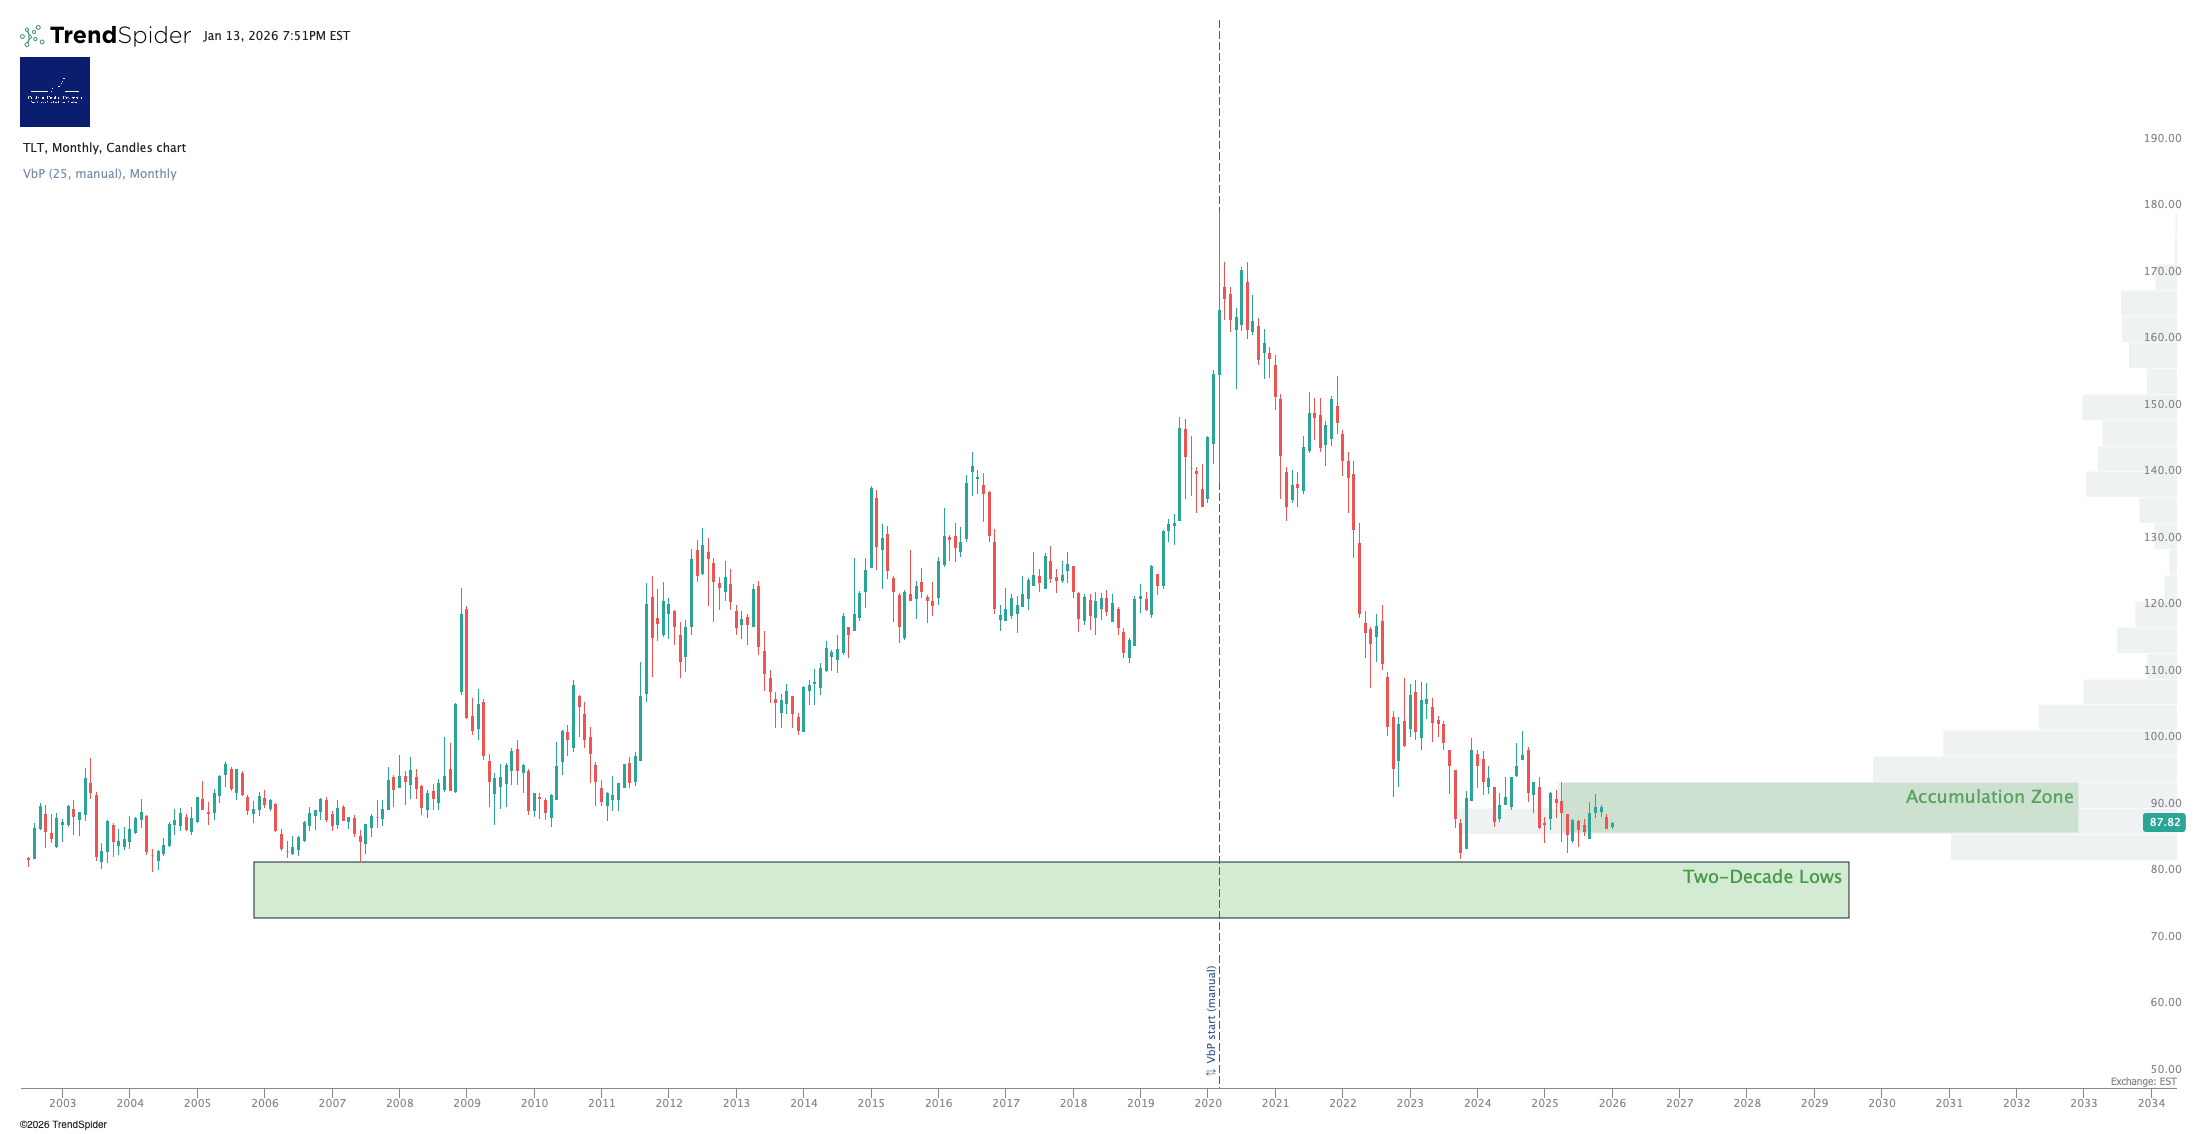
Closed over the 21-day EMA today - bullish.
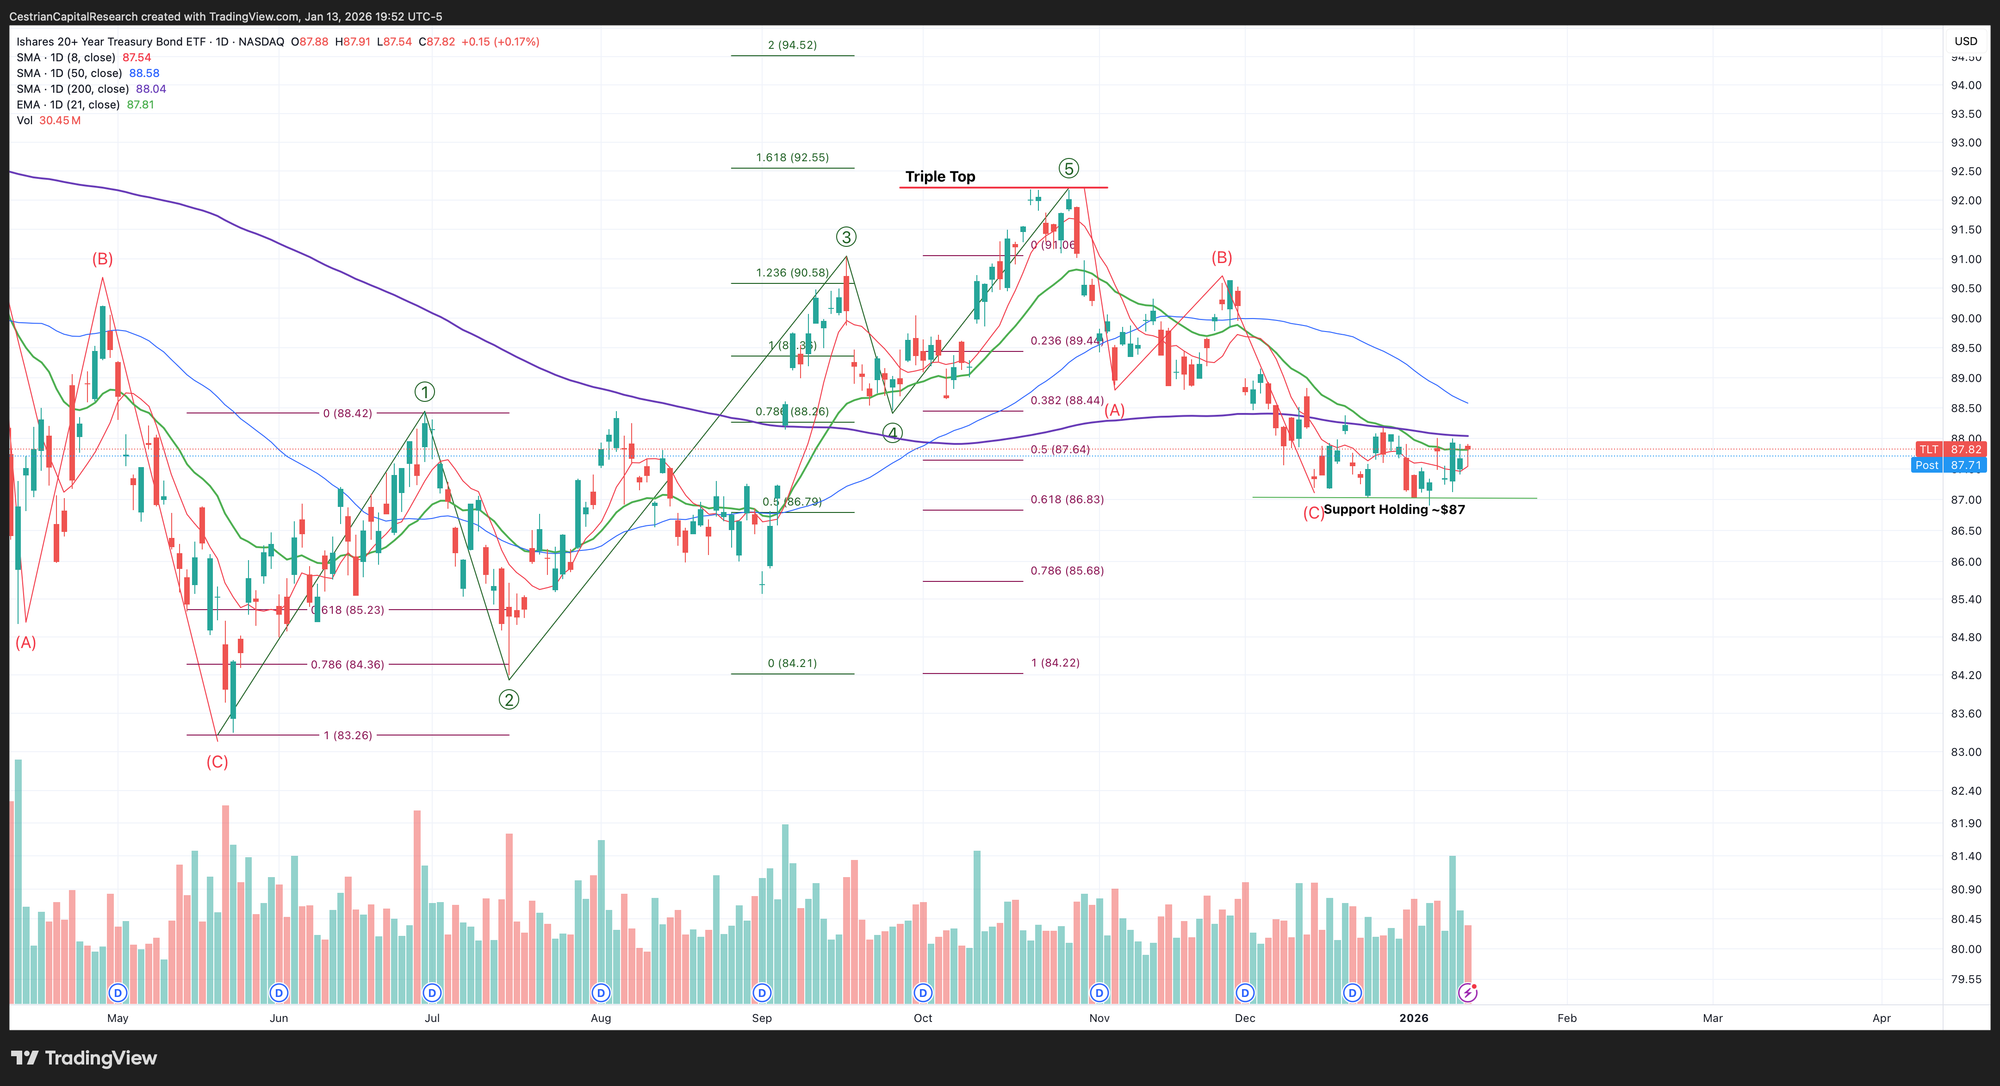
Note - Leveraged ETF. Read the fund documentation if you are considering using this instrument.
Sat just below that 21-day EMA.
Disclosure: I am unhedged long $TLT and $DLTA (an EU UCITS TLT proxy).
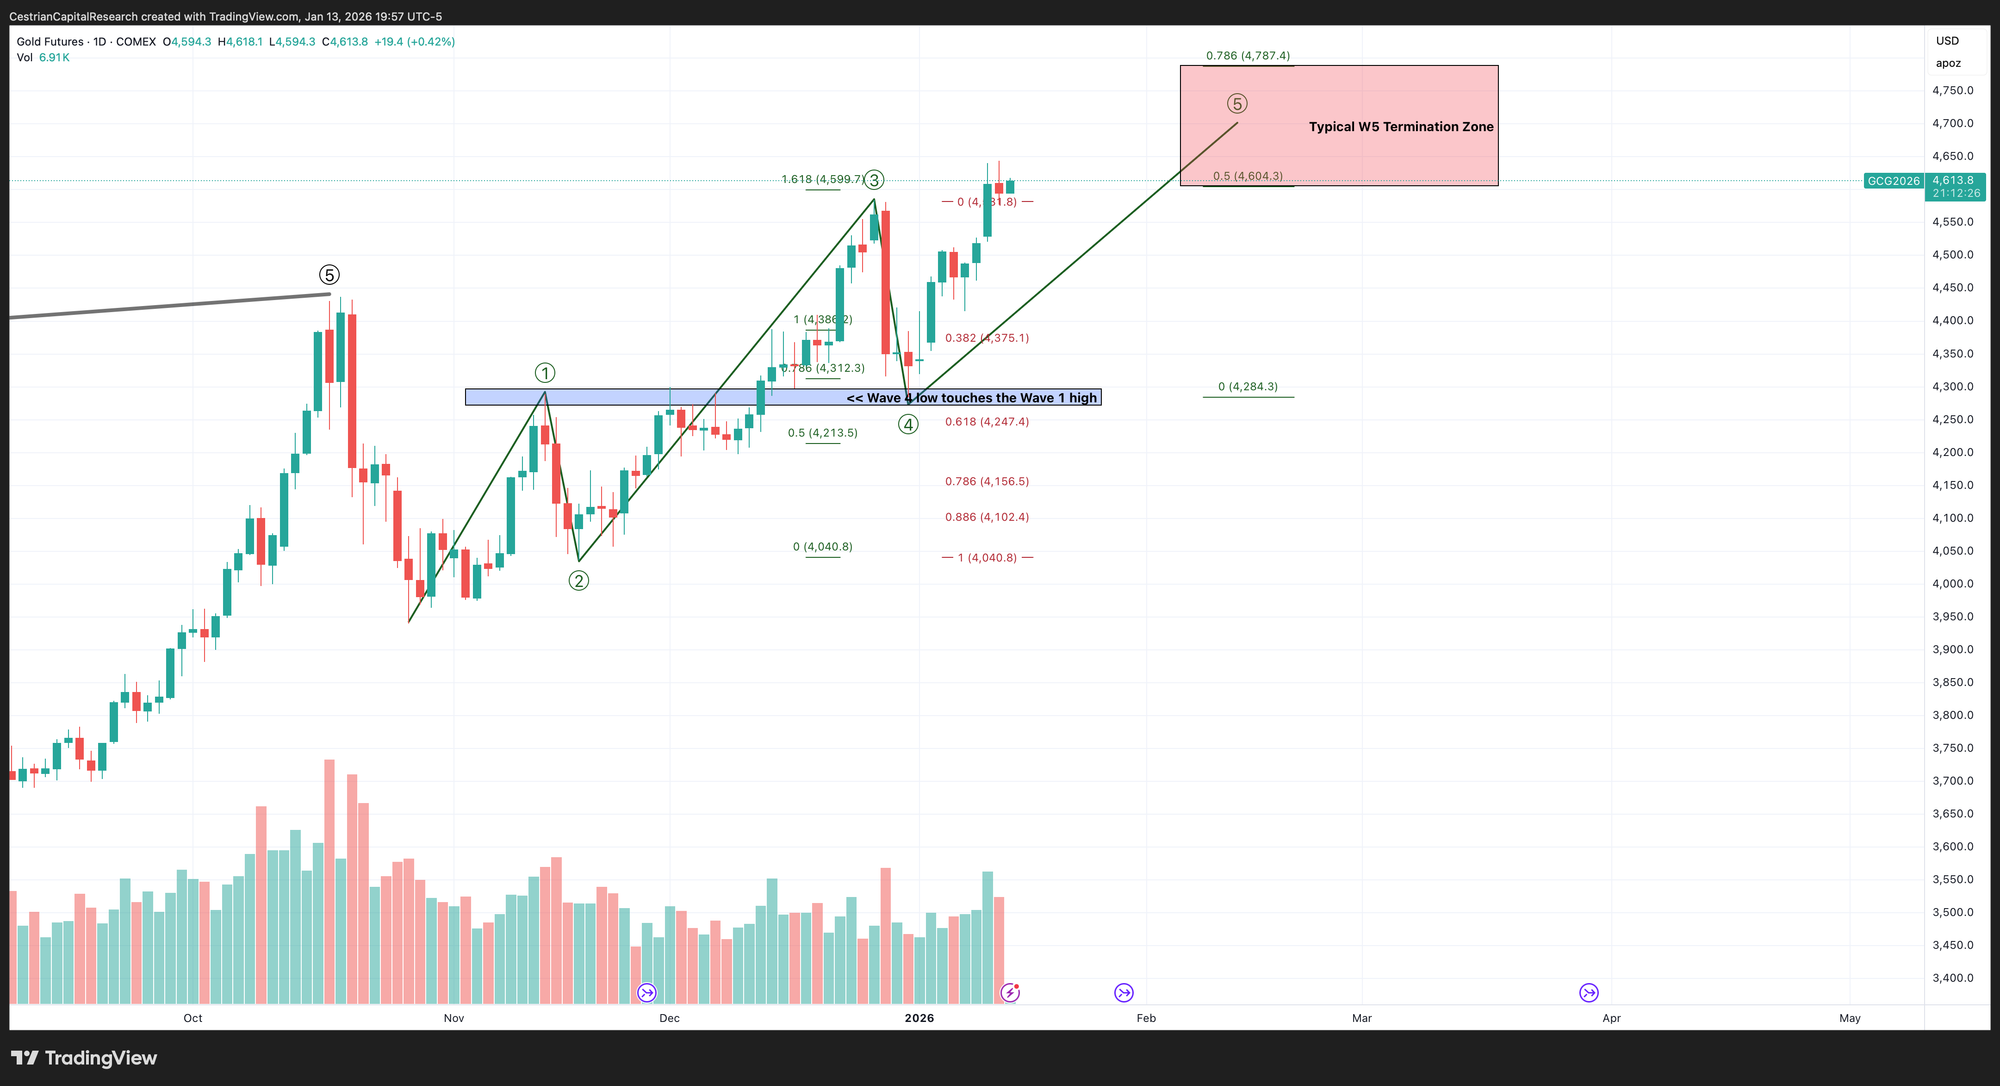
Gold
Now within the bounds of that Wave 5 termination zone. These price zones are just a guide, of course, a probability field. But these patterns work more than one might expect. I can think of many reasons why gold can keep moving higher but if you are trading it short term, be ready for a pullback especially if price advances to near $4800.
Disclosure: I am positioned in gold according to our Commodities Algo Service and our SignalFlow AI Growth Service.
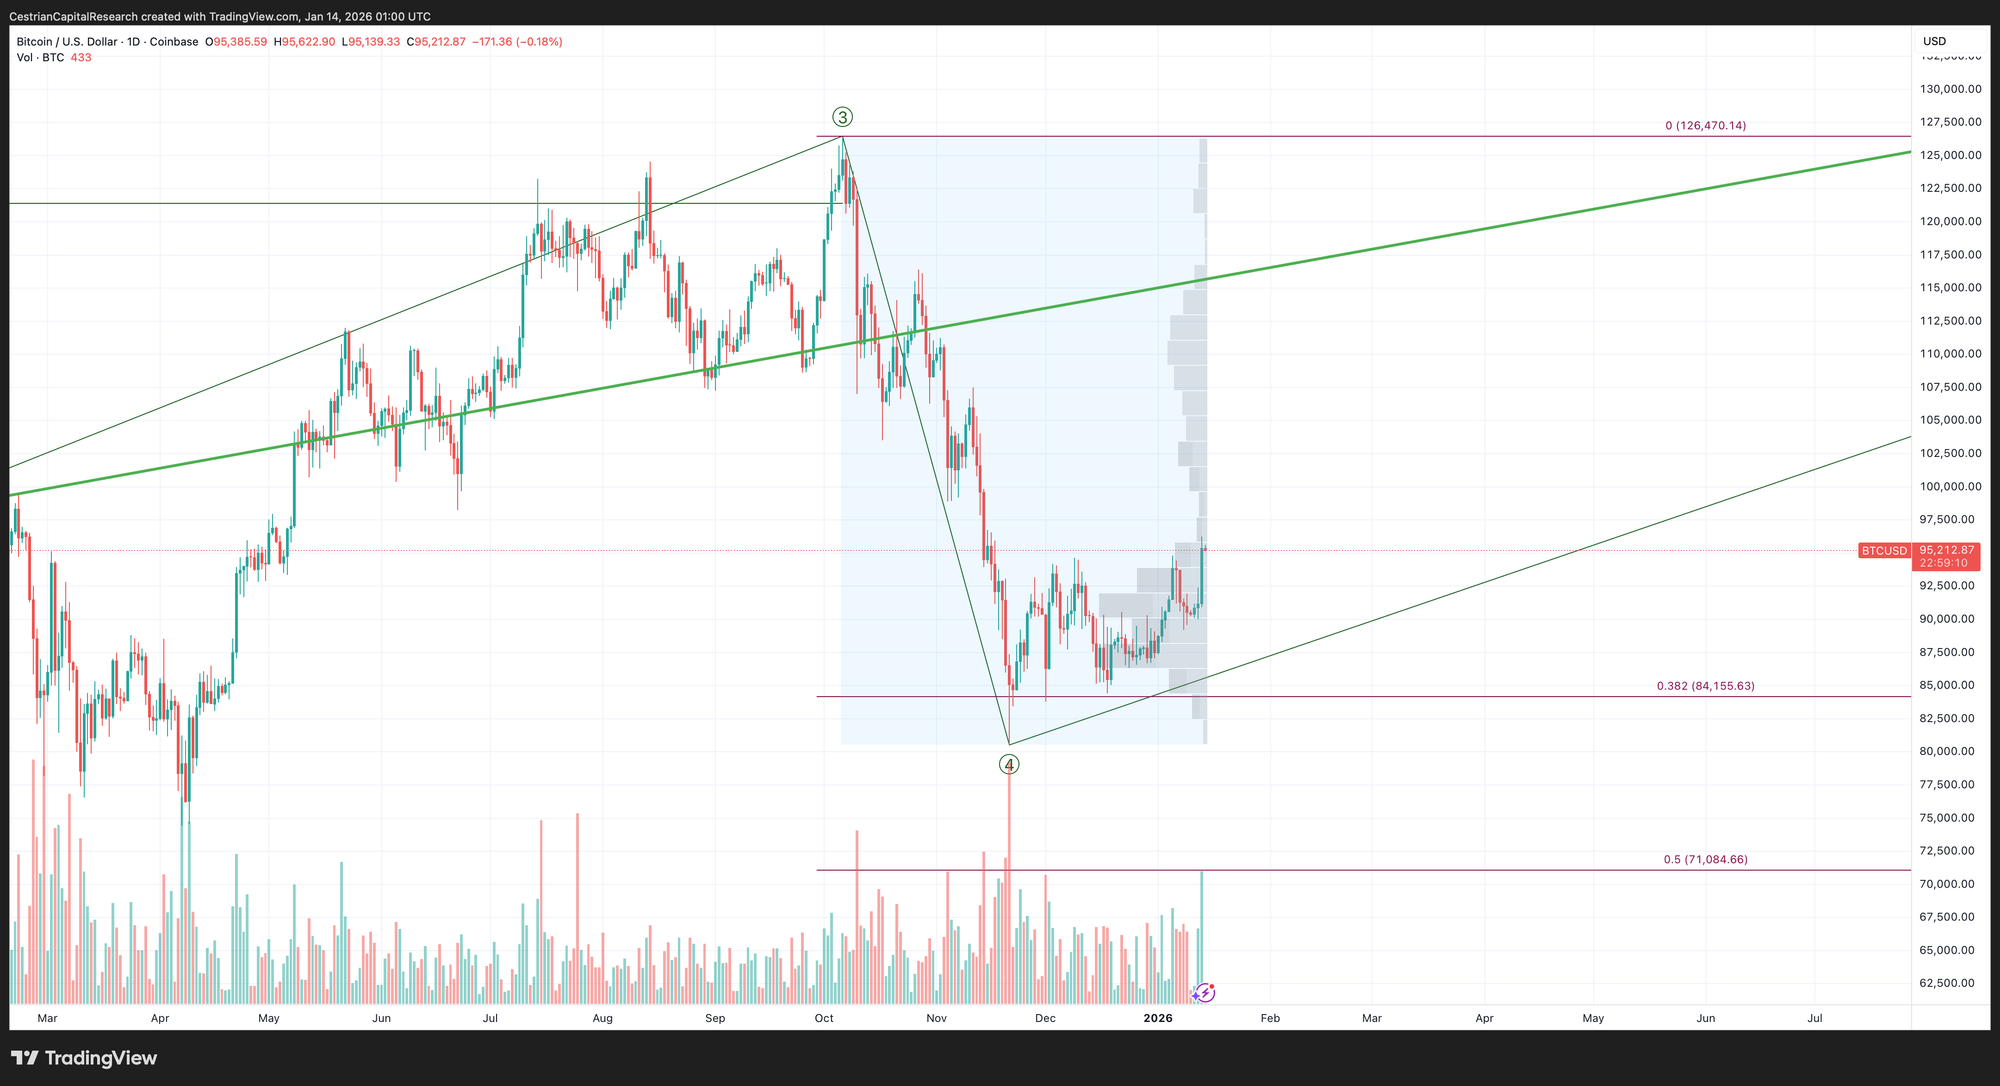
Bitcoin
I think that is bottoming out and I think the volume x price supports that.
Disclosure: I am long $IBIT.
Ether
Volume x price also picking up nicely down here. Bullish.
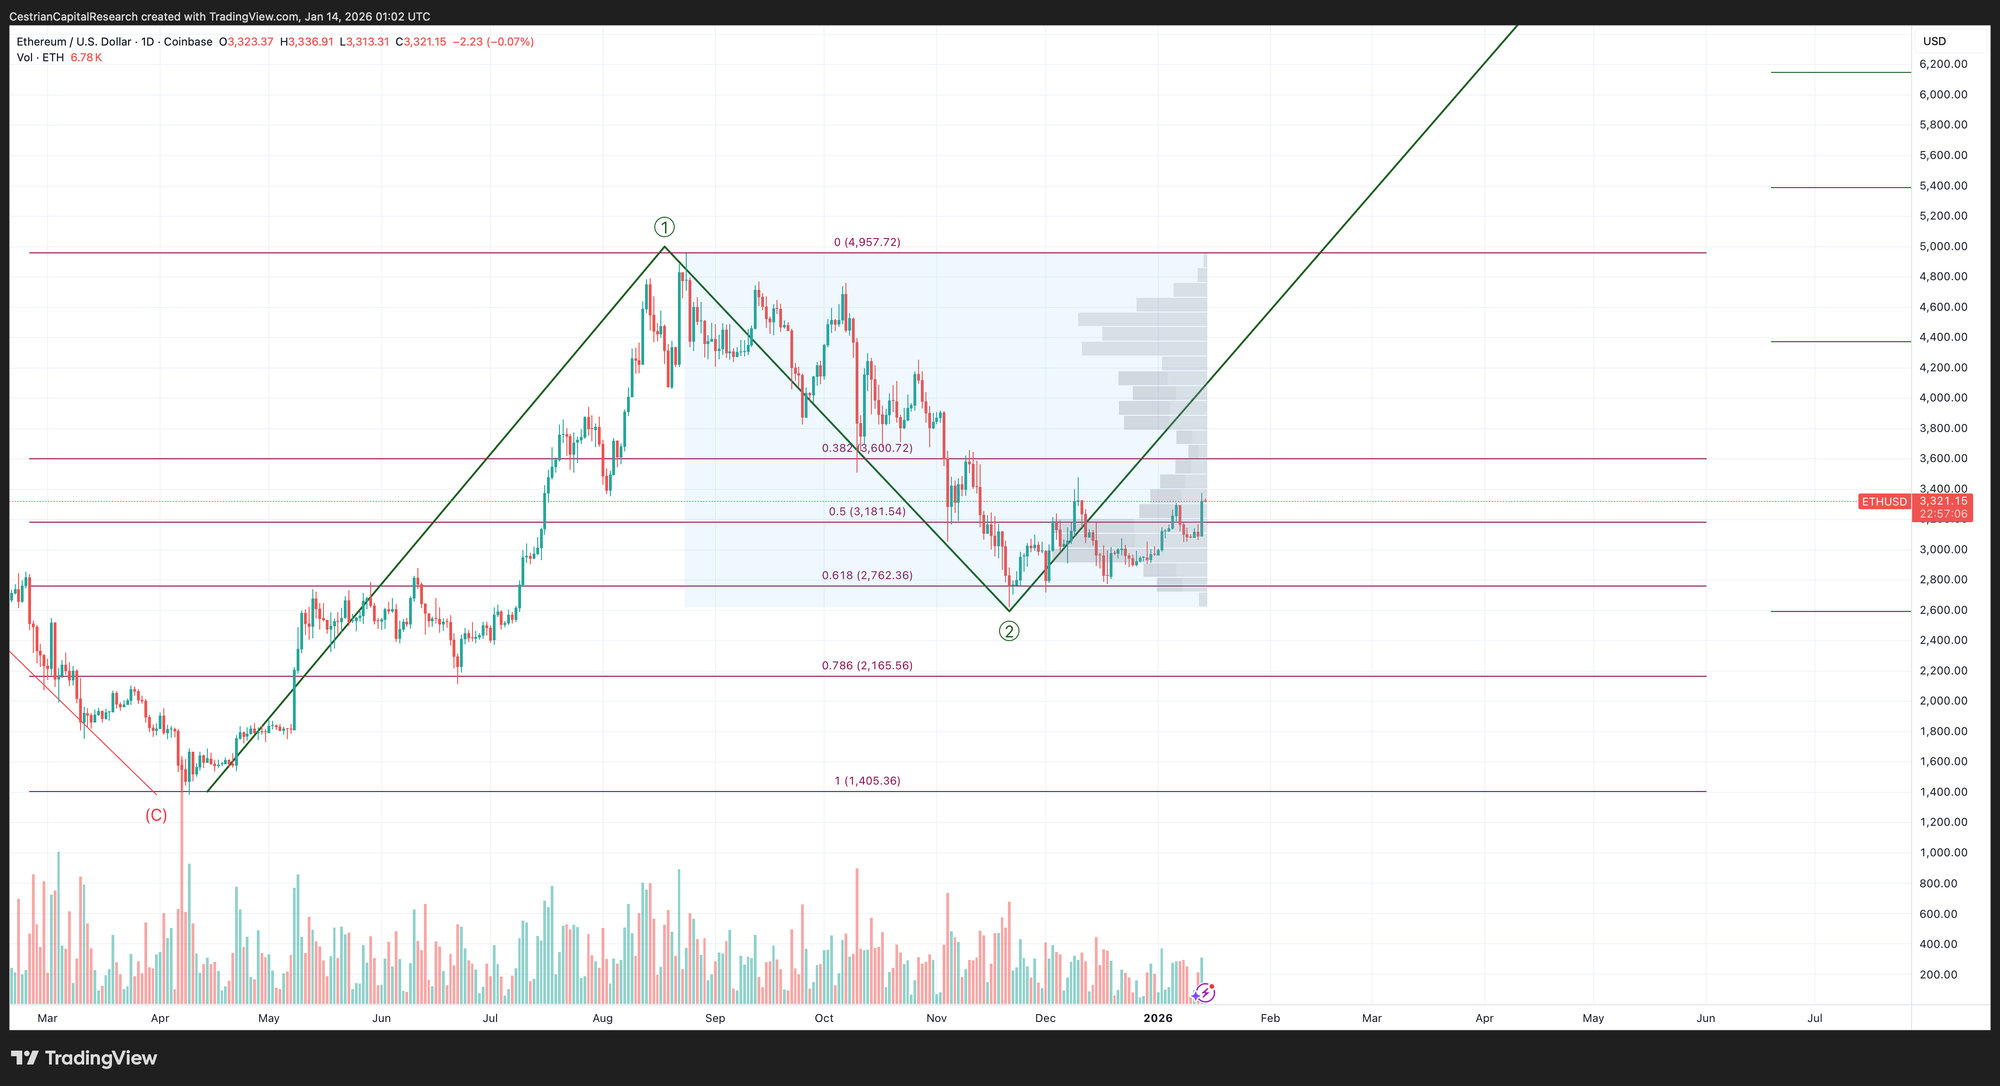
Disclosure - Long $ETHA and others in the Ether complex.
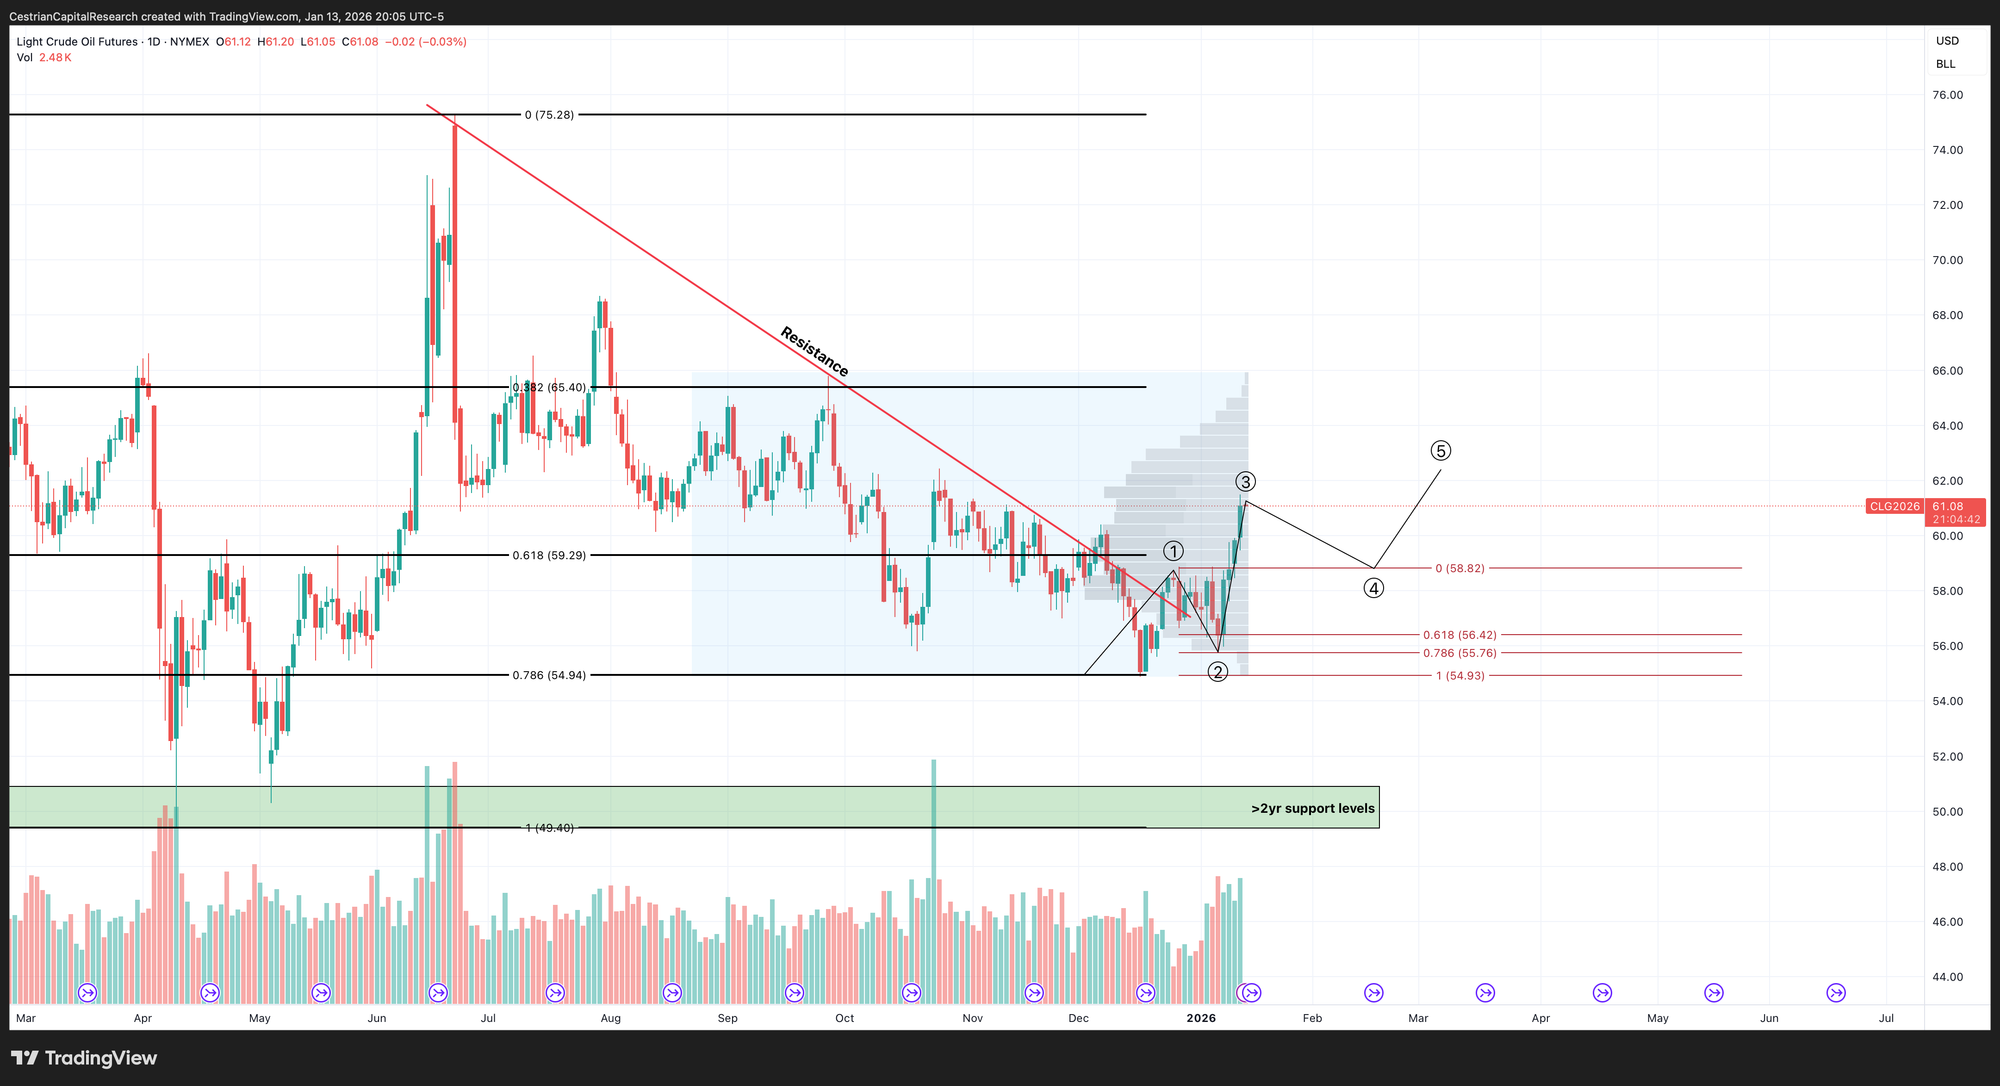
Oil (USO / WTI / UCO)
Iran > Venezuela right now it seems.
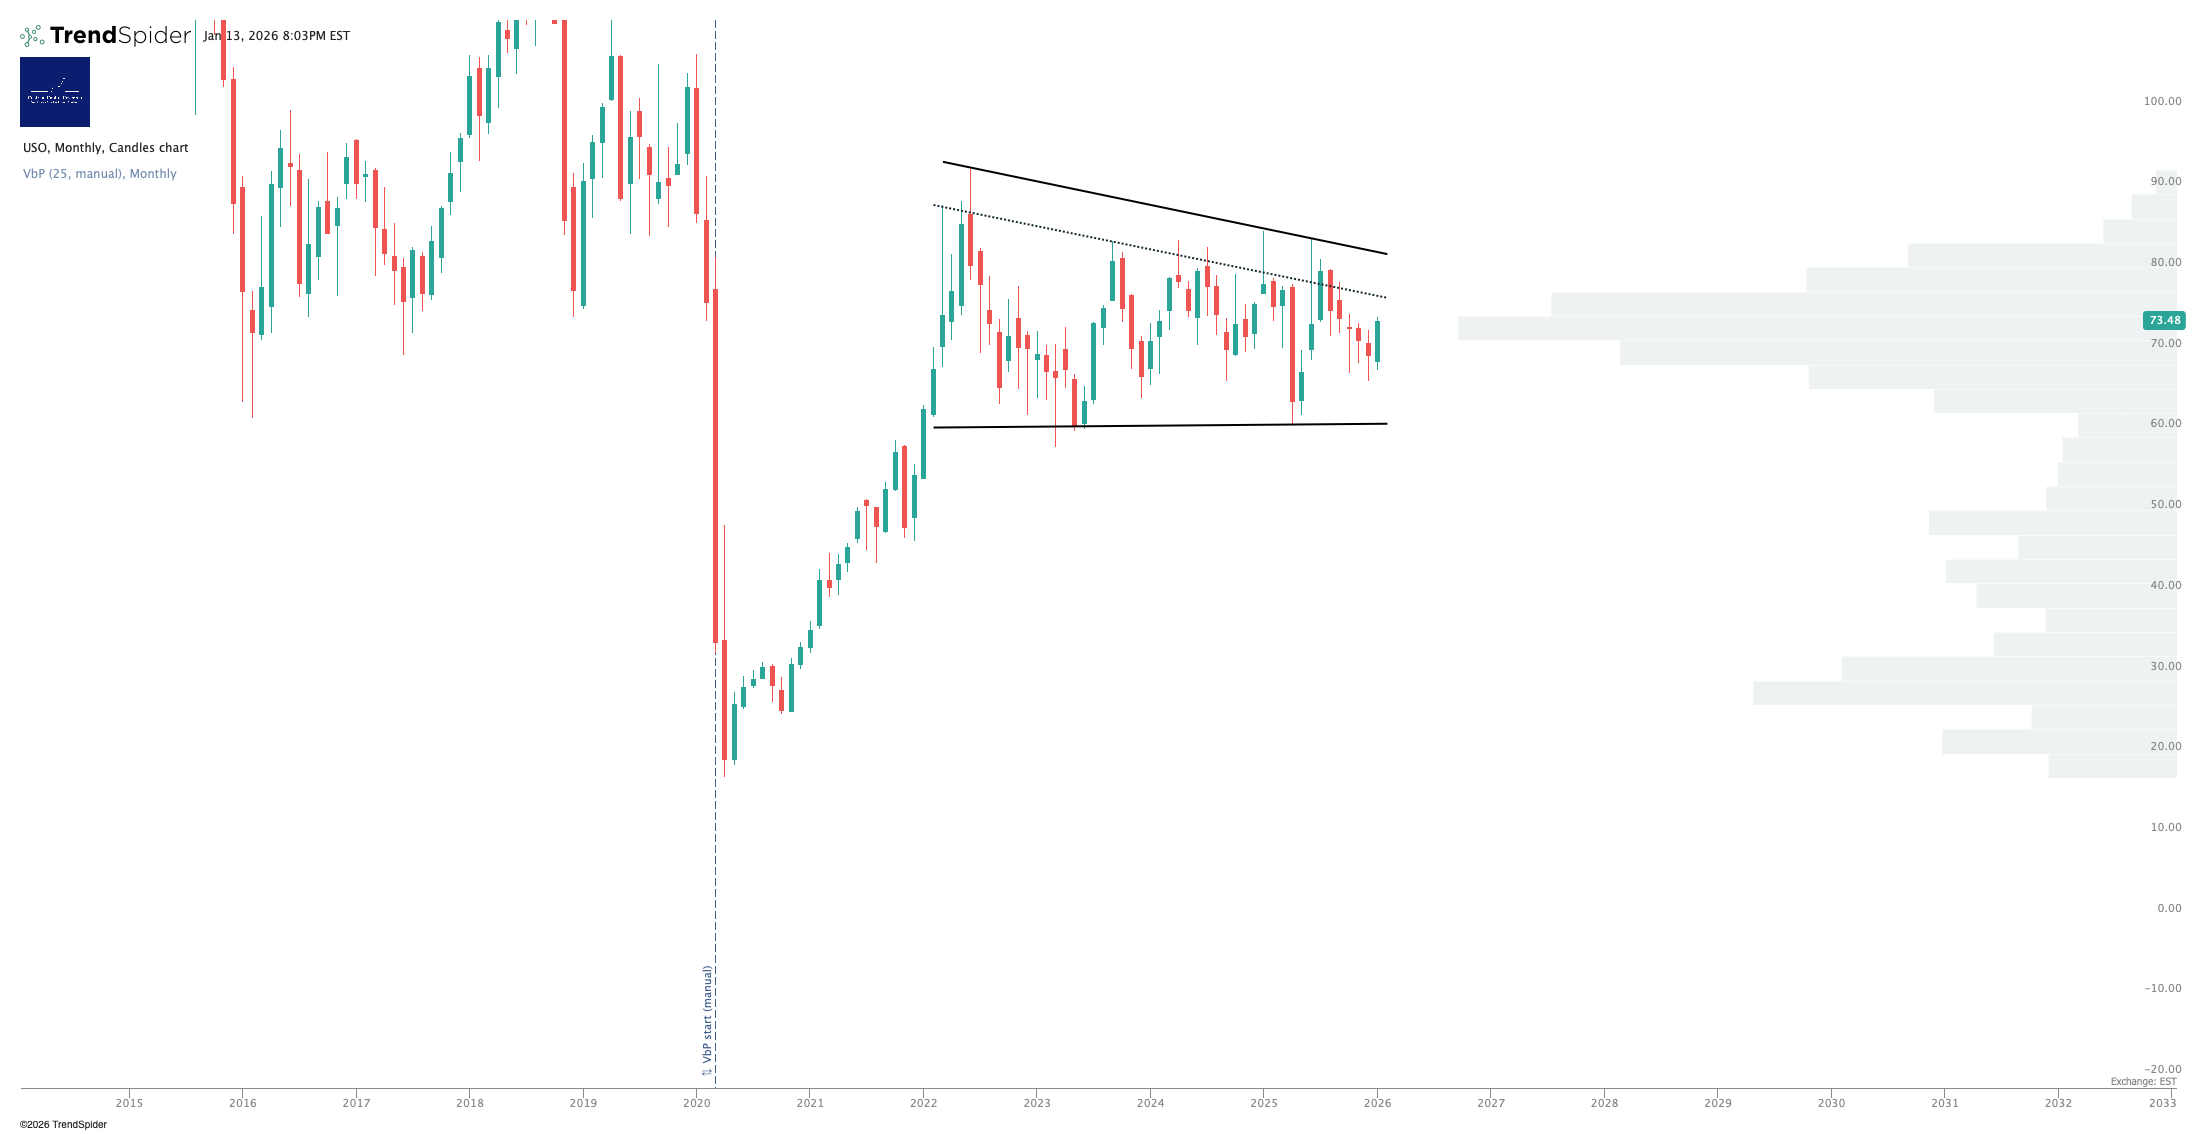
Confirmed bullish move.
2x Levered Long (UCO) / Short (SCO)
Note - Leveraged ETFs. Read the fund documentation if you are considering using these instruments.
UCO is thinking about re-capturing the 50-day SMA.
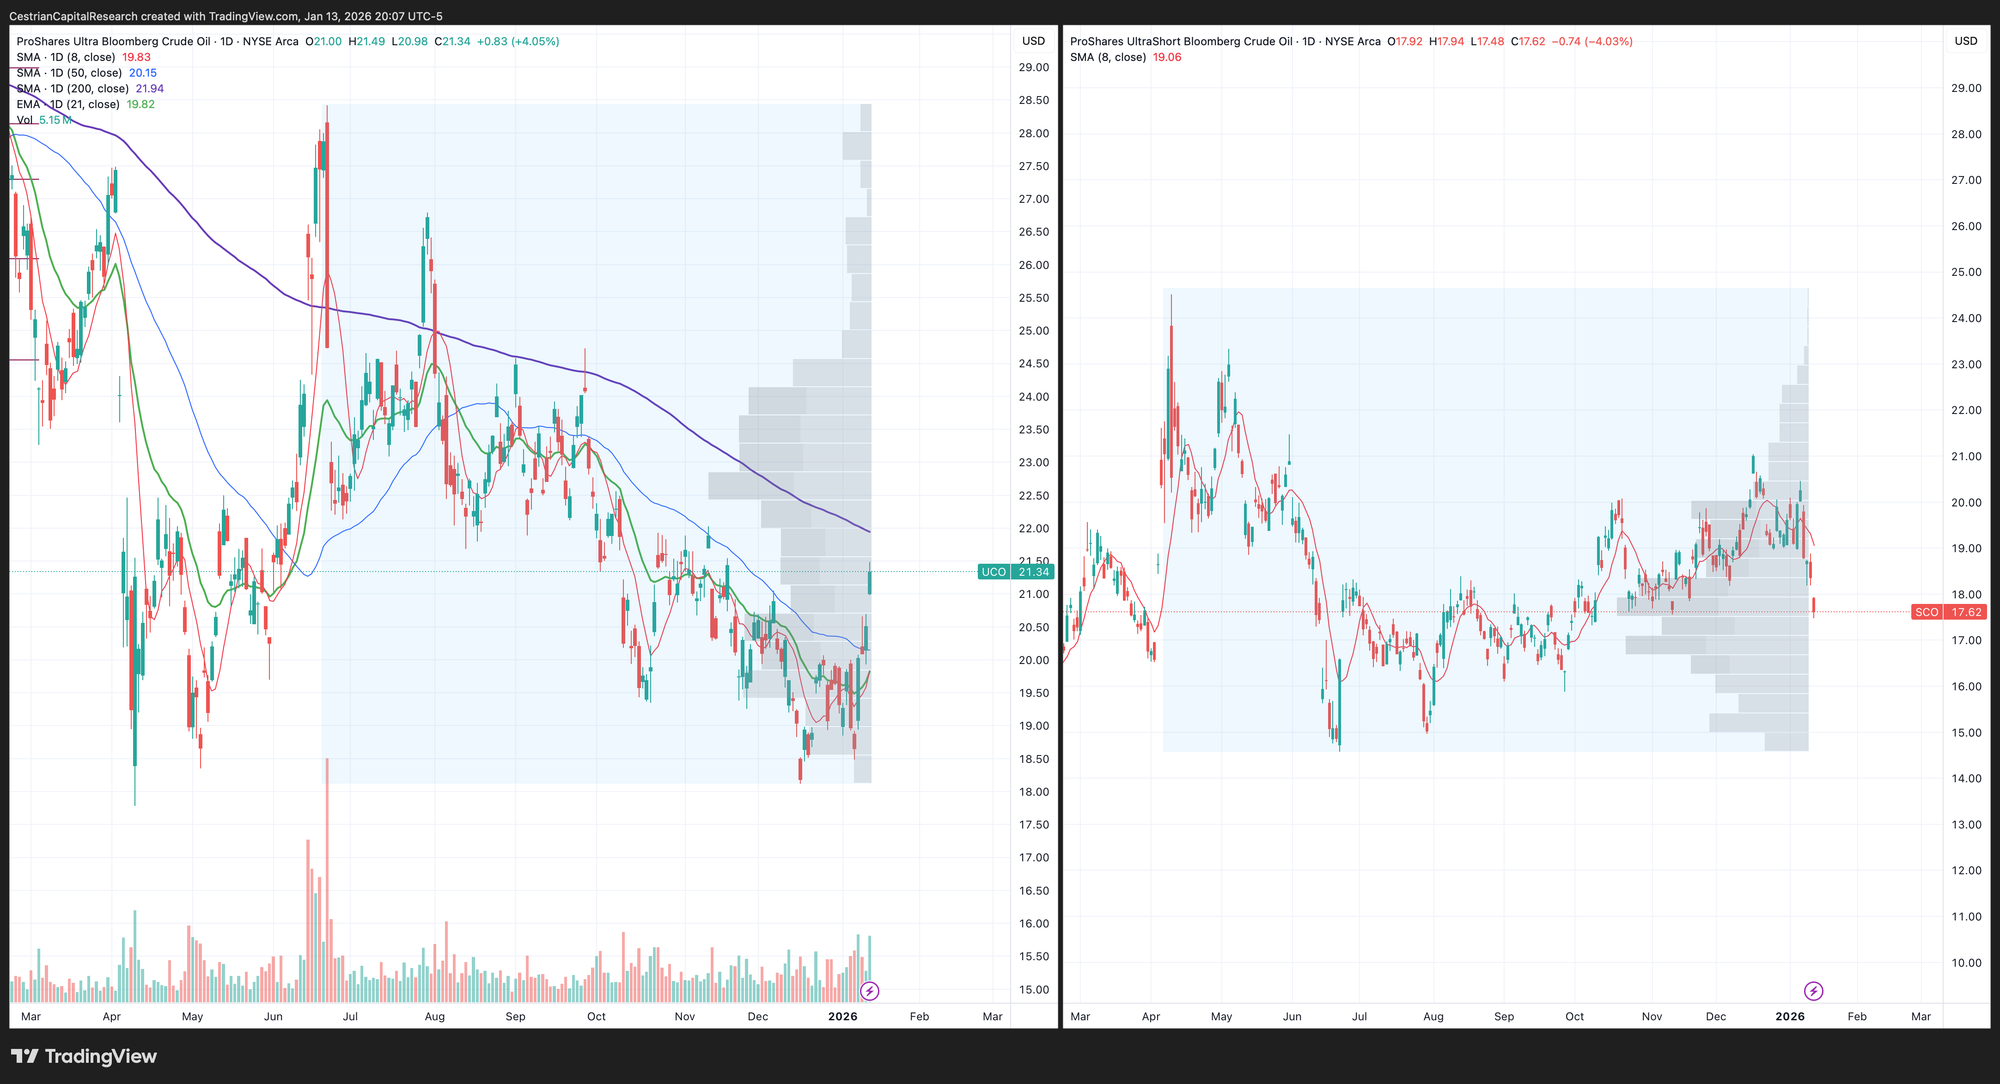
Disclosure: I am positioned in oil per our Commodities Algo Service.
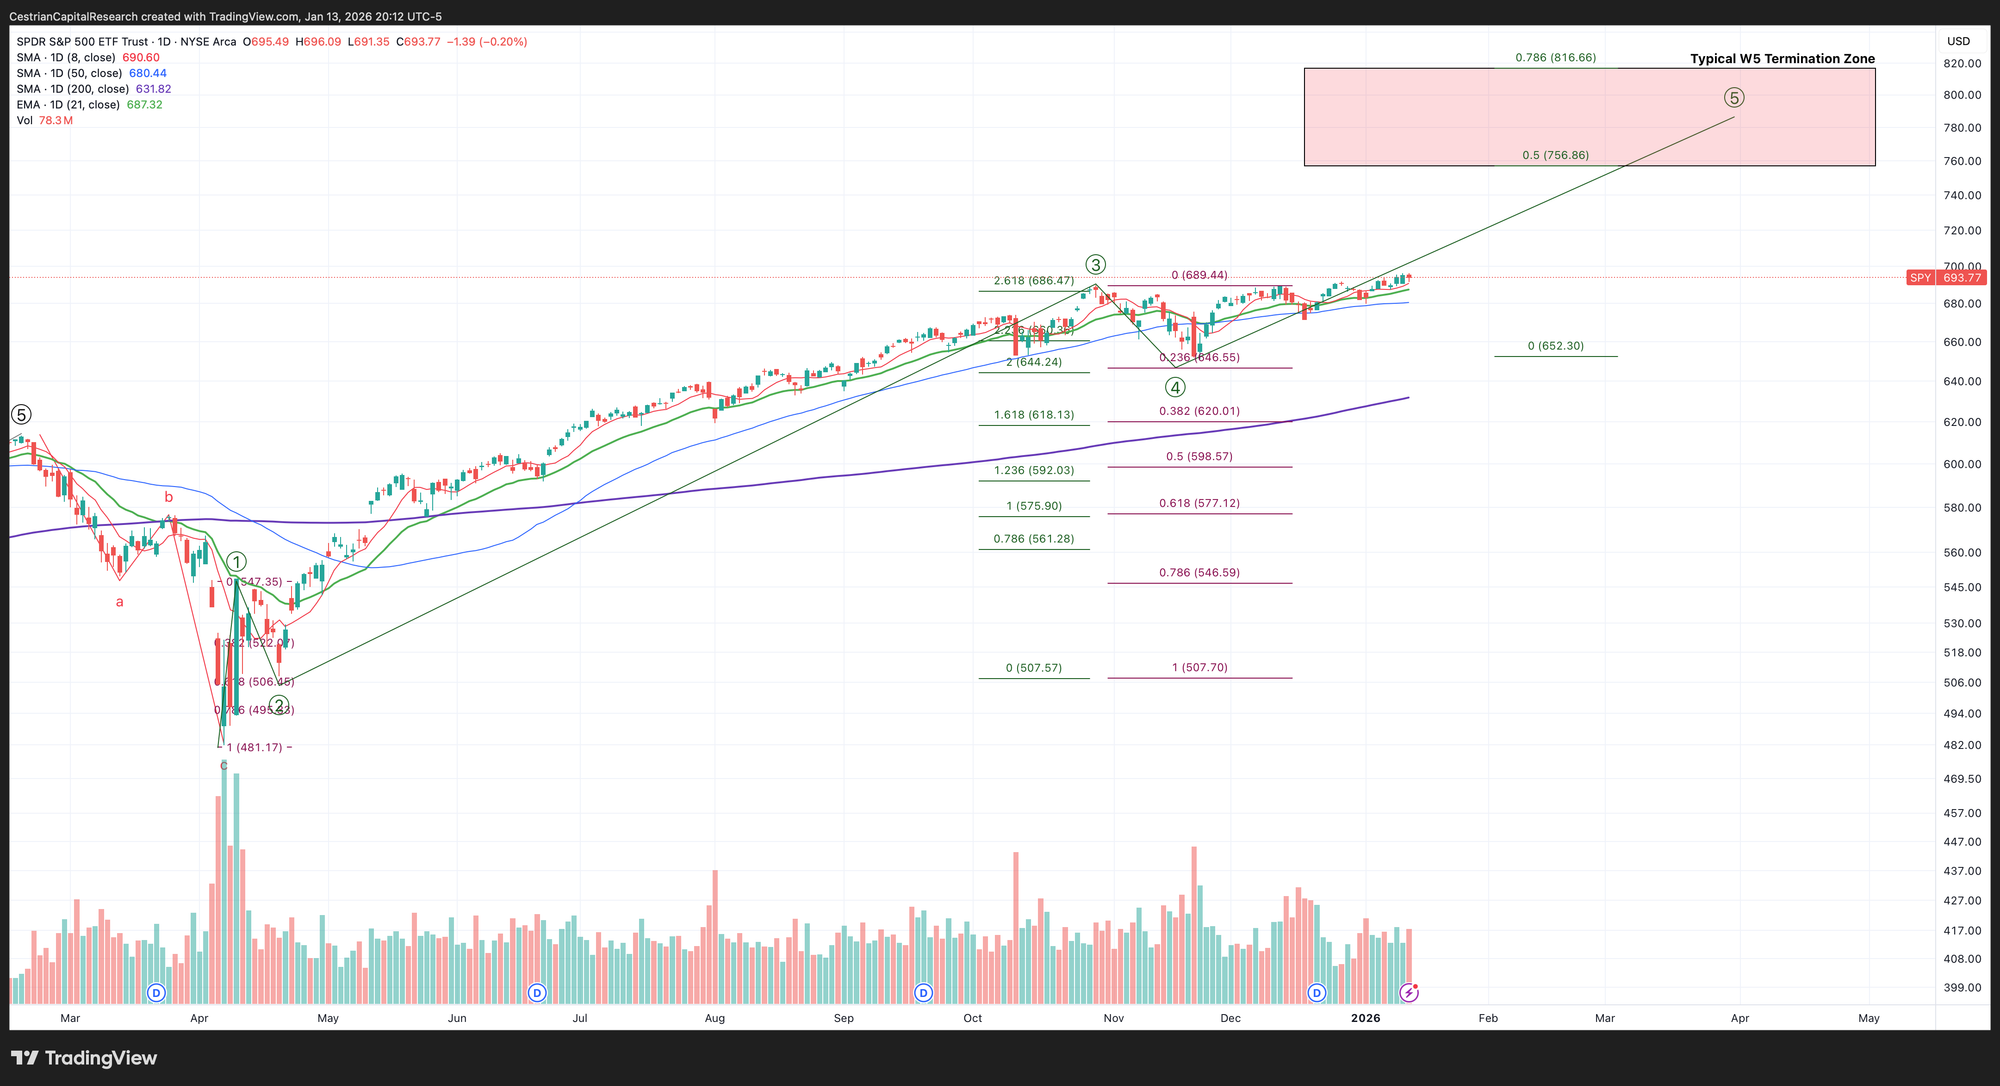
S&P500 / SPY / UPRO
Volume x price spiking up here. Distribution or re-accumulation? Price will tell us if we wait and we let it.
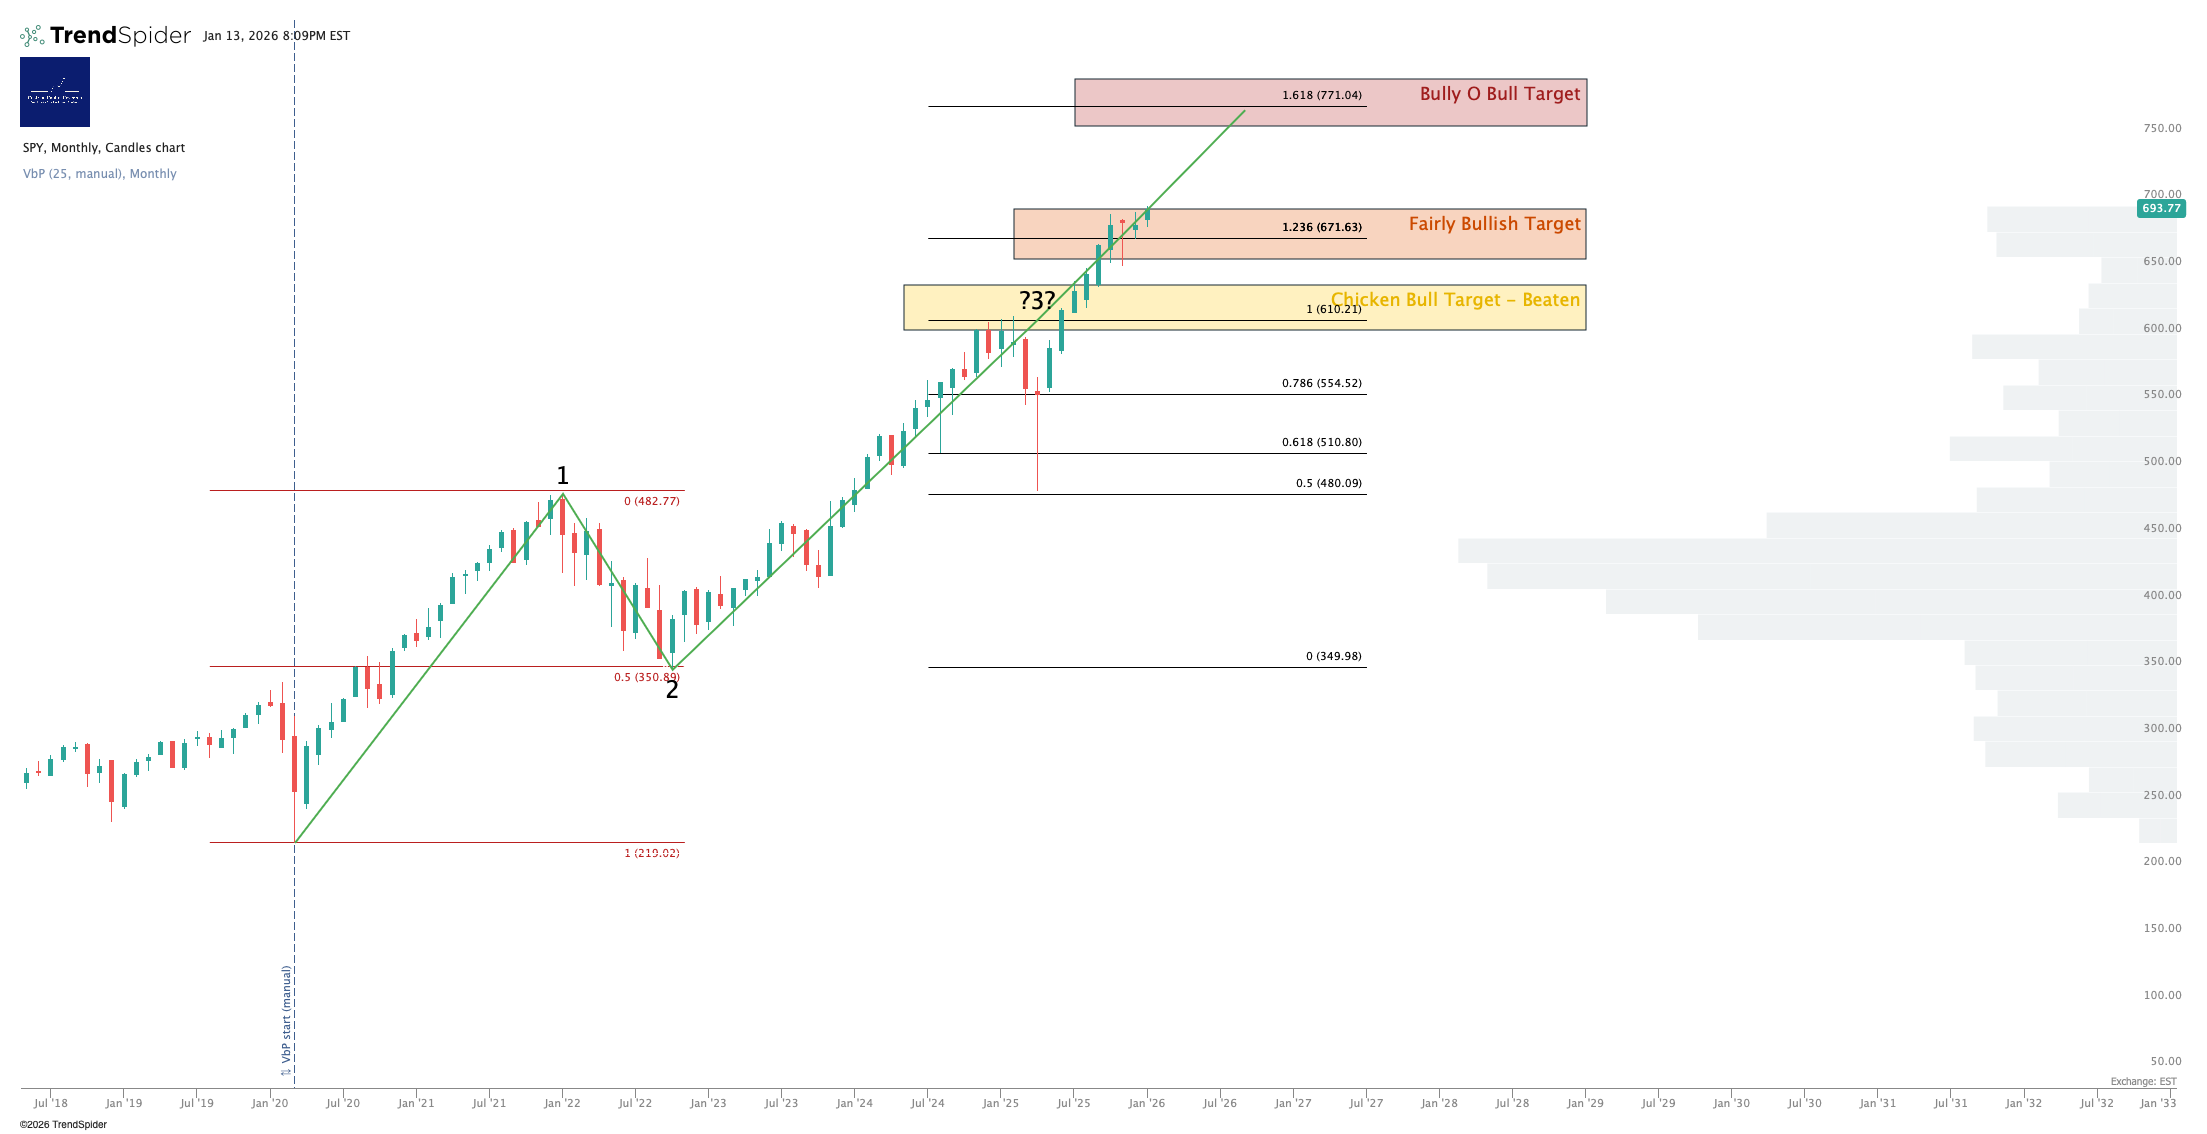
Continues the slow march upwards.
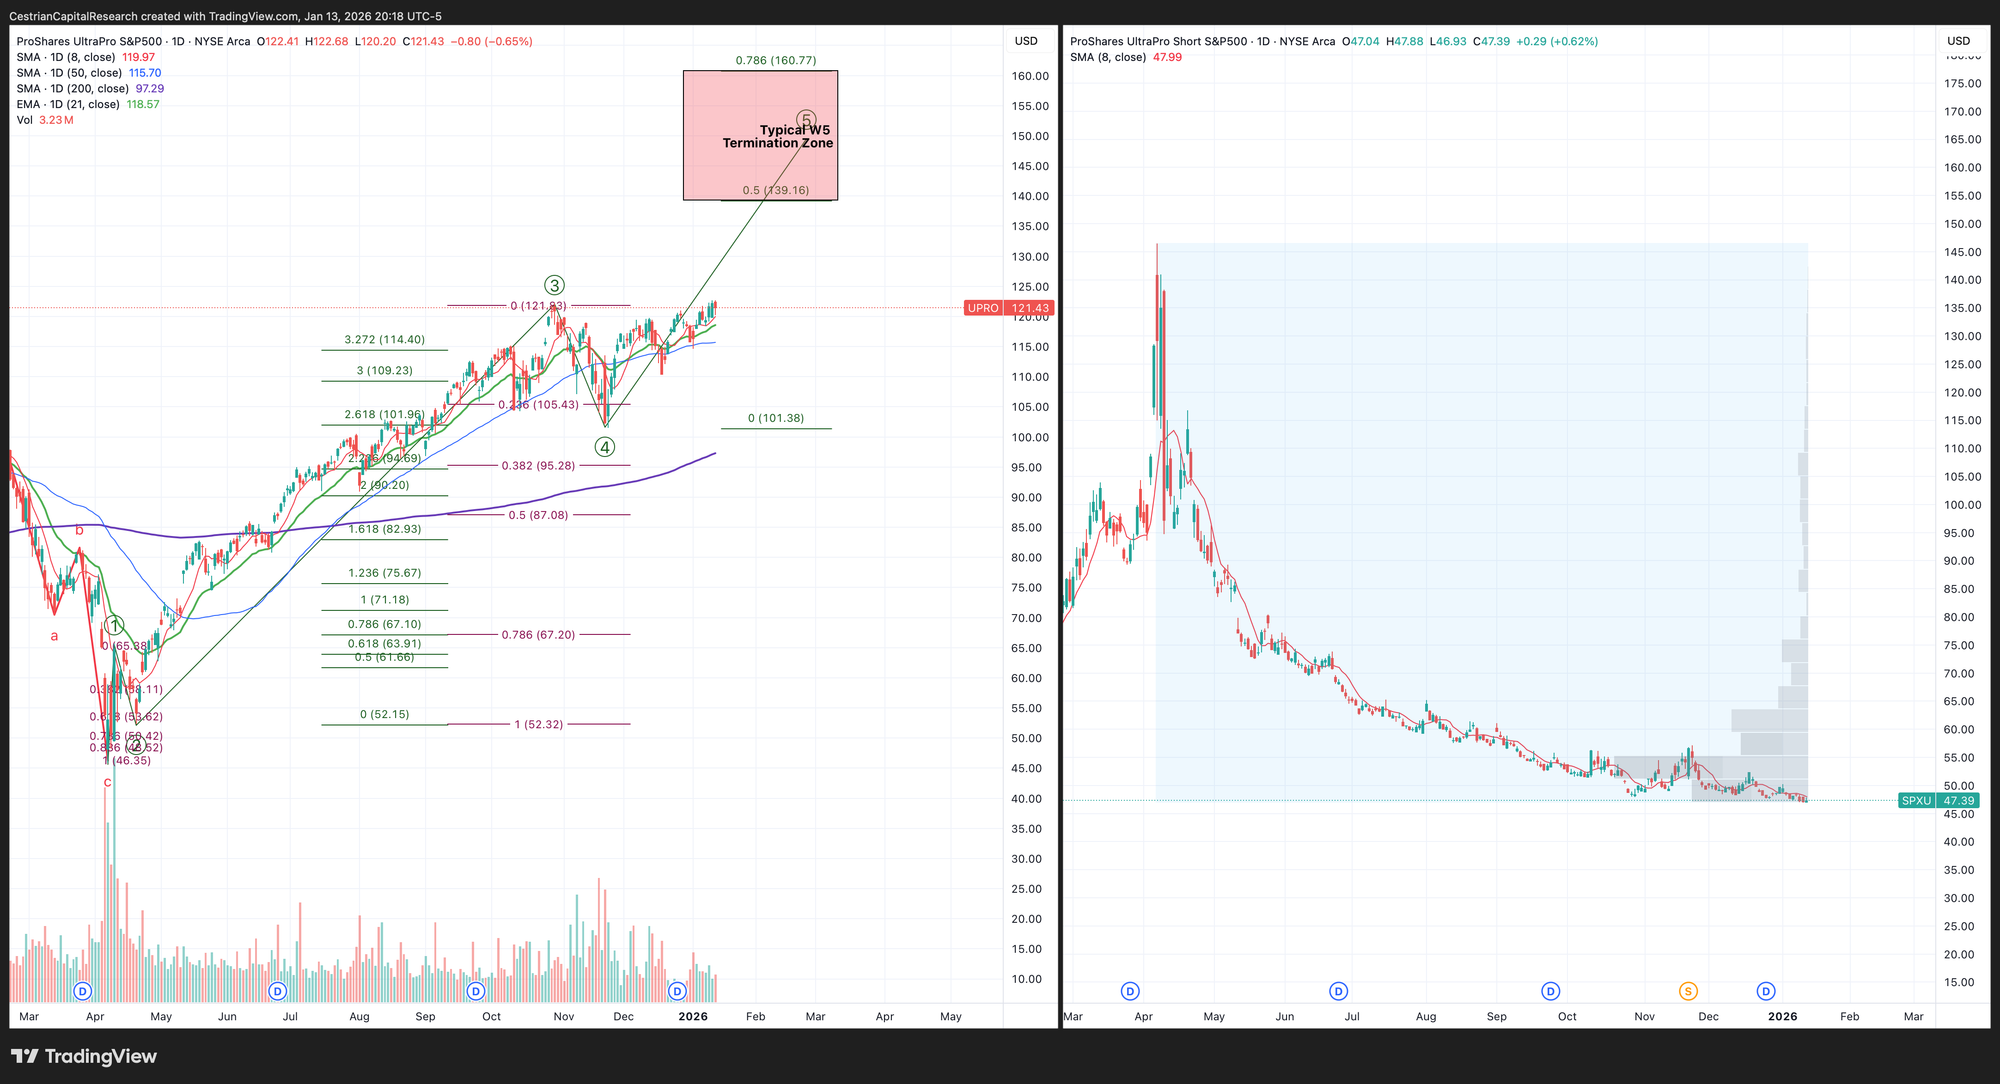
3x Levered Long / Short ETF - UPRO, SPXU
Note - Leveraged ETF. Read the fund documentation if you are considering using this instrument.
UPRO looking like it means business. Do keep an eye on the accumulation going on at SPXU though.
Disclosure: I am long $IUSA ie. unhedged long the S&P.
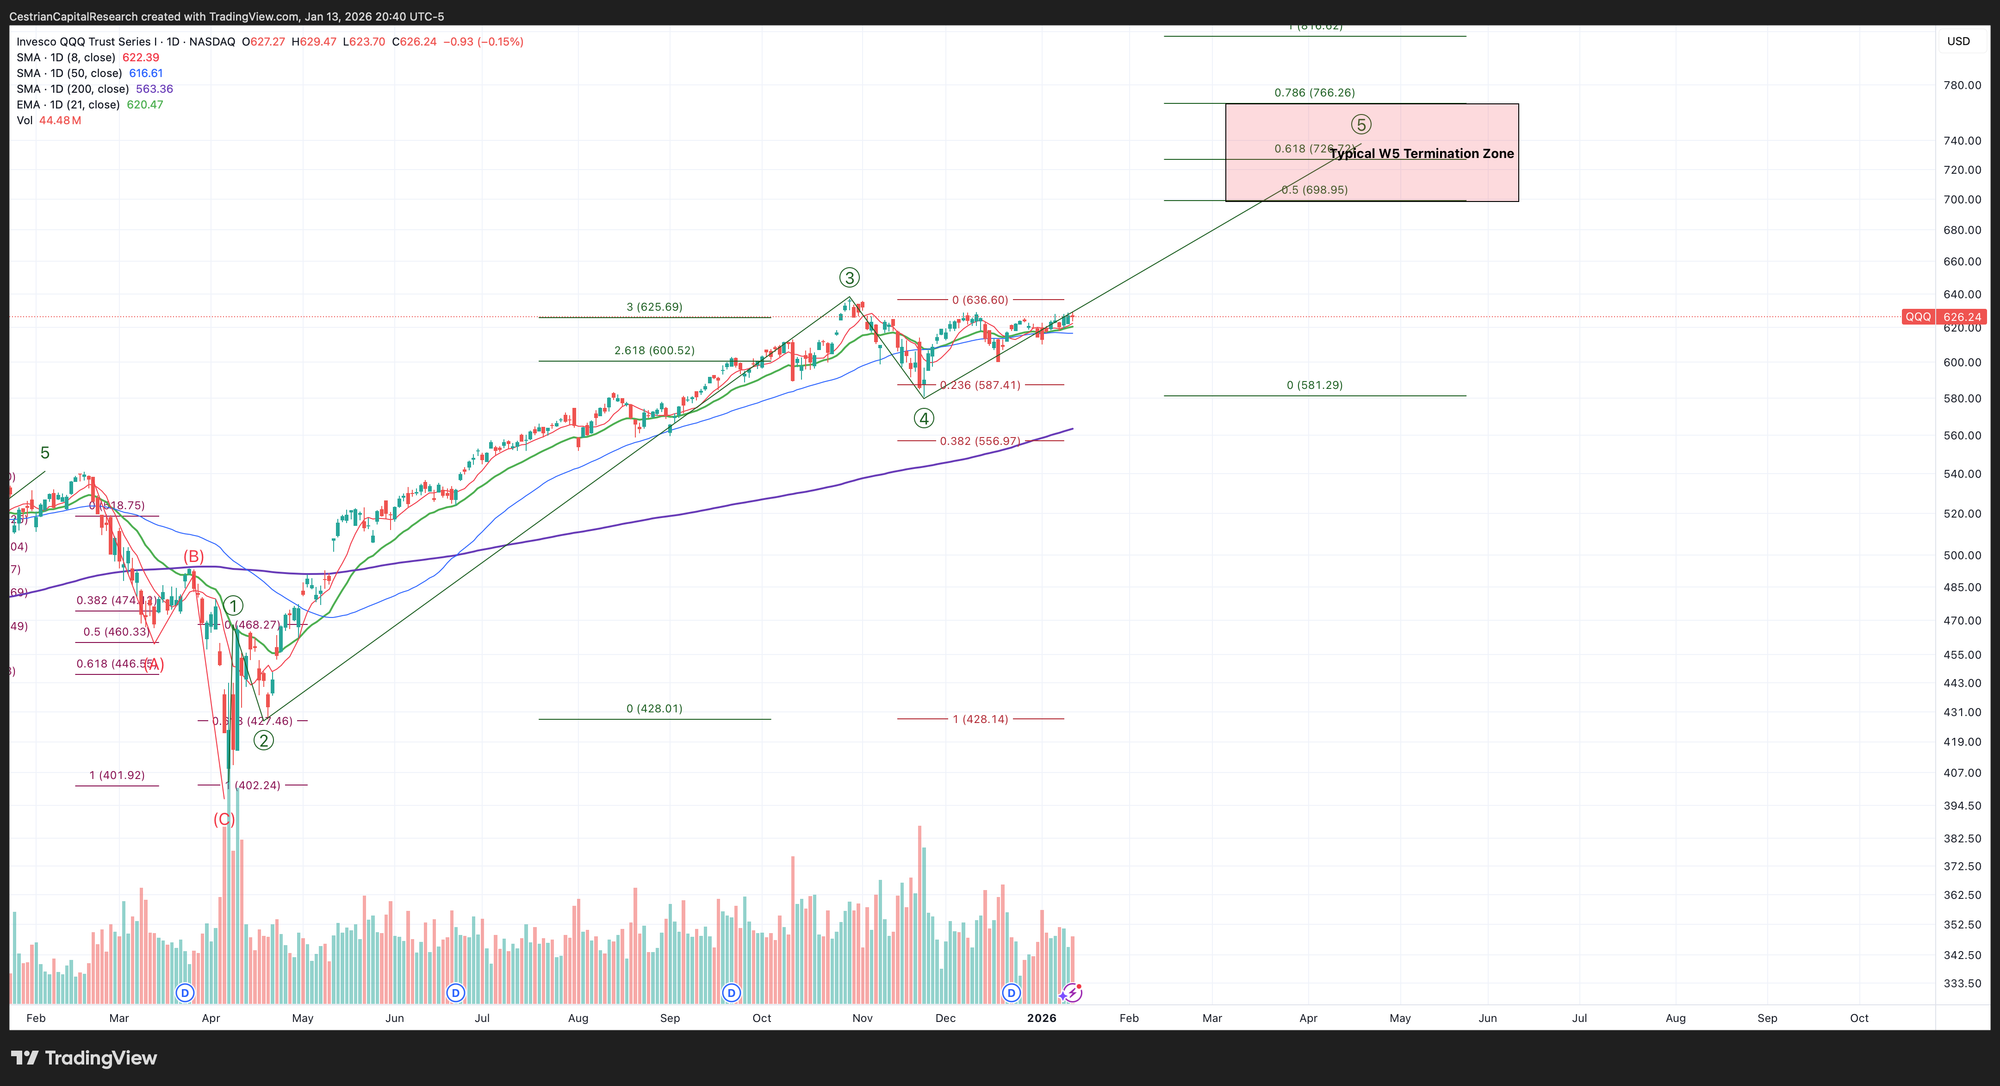
Nasdaq-100 / QQQ / TQQQ
A lot of things are moving up without the QQQ - I think this resolves that the QQQ also moves up.
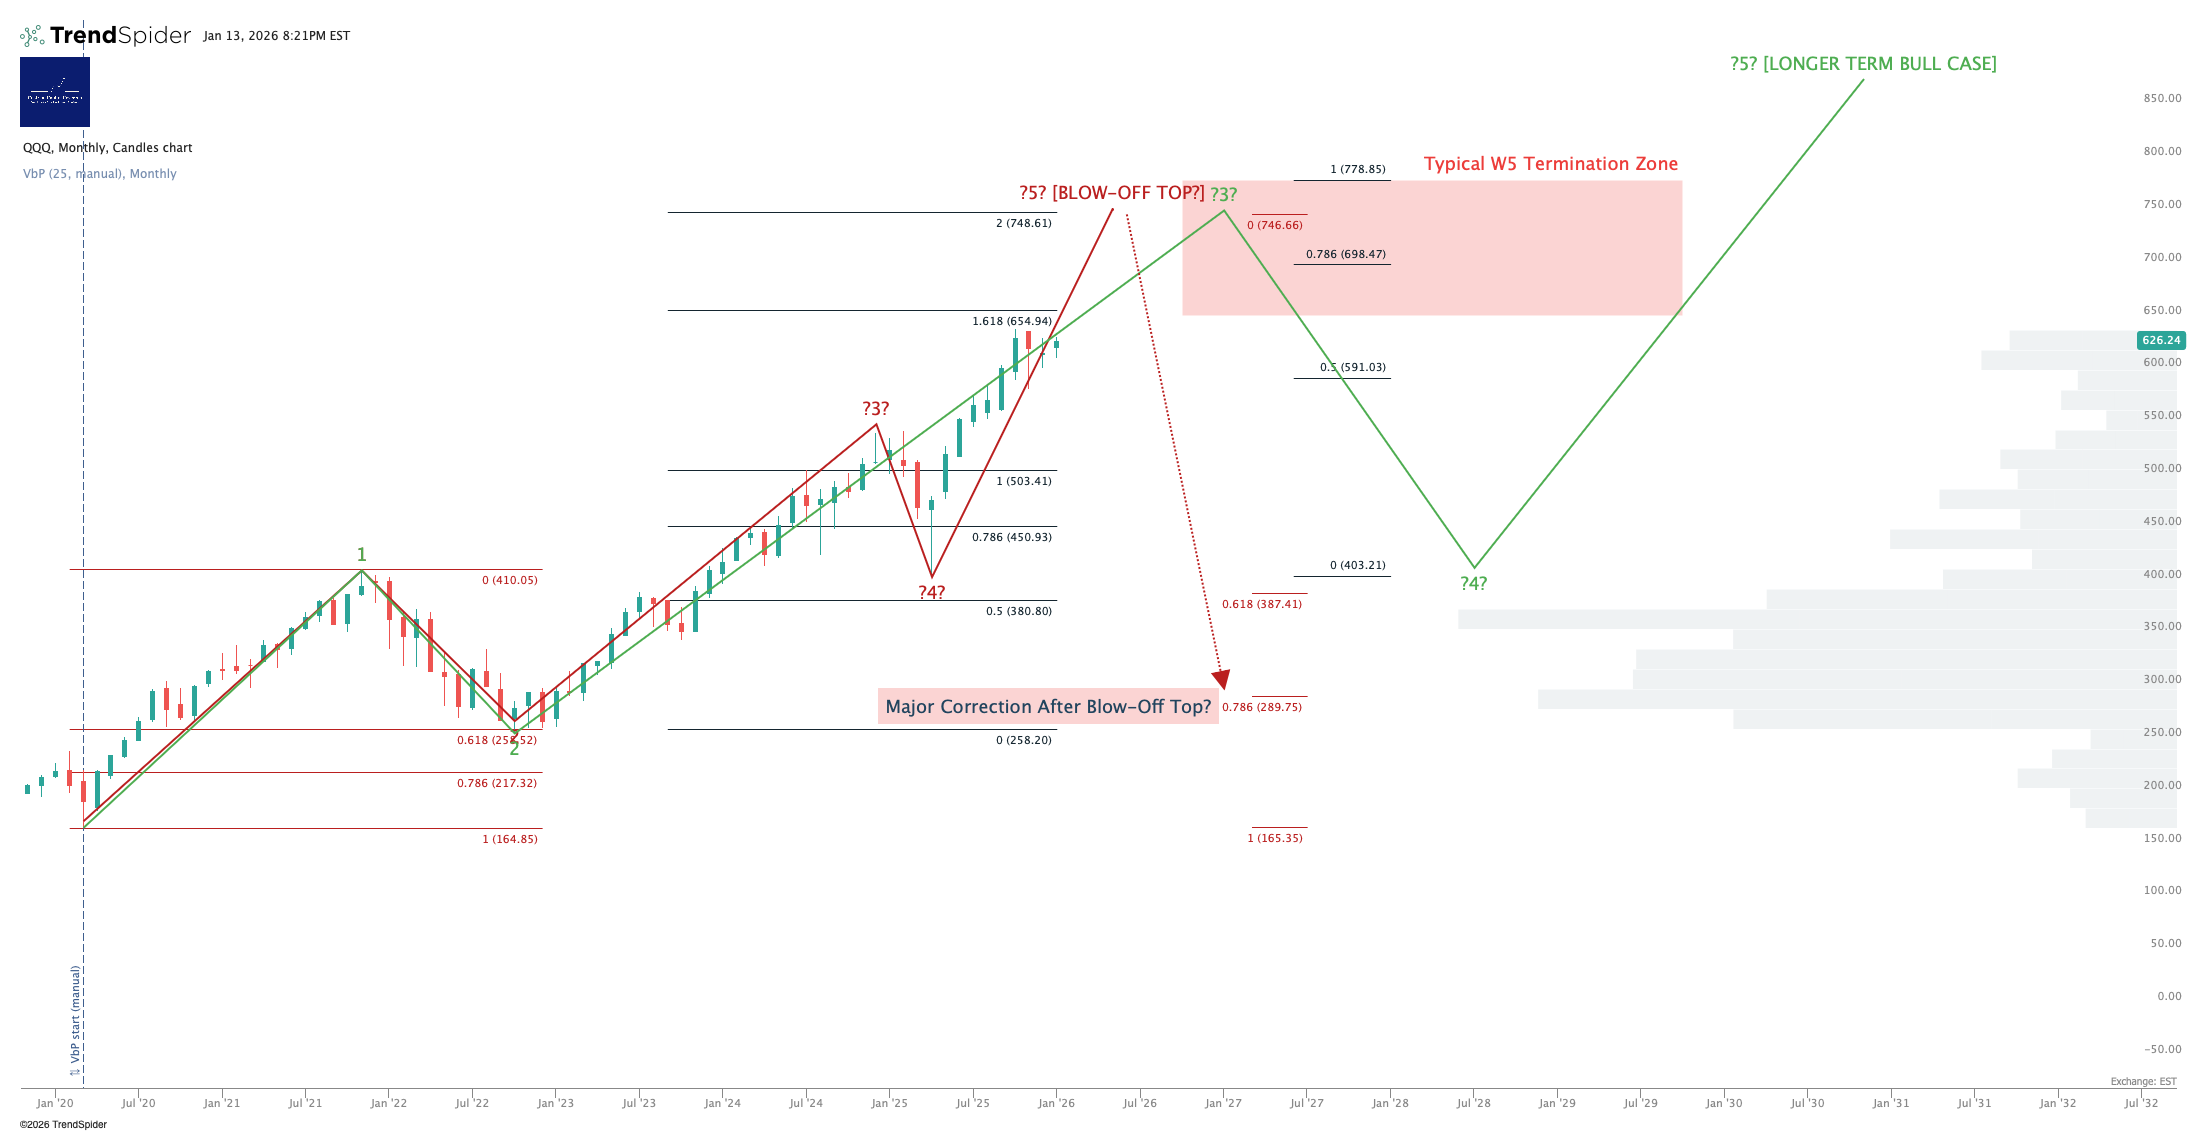
Target $698-766 on the QQQ before a material correction. Now $626.
Levered Nasdaq - TQQQ Long / SQQQ Short
Note - Leveraged ETFs. Read the fund documentation if you are considering using these instruments.
Solid upside here in TQQQ I would say.

Disclosure: I am hedged approx 2.4:1 $TQQQ:$SQQQ ie. net long the Nasdaq.
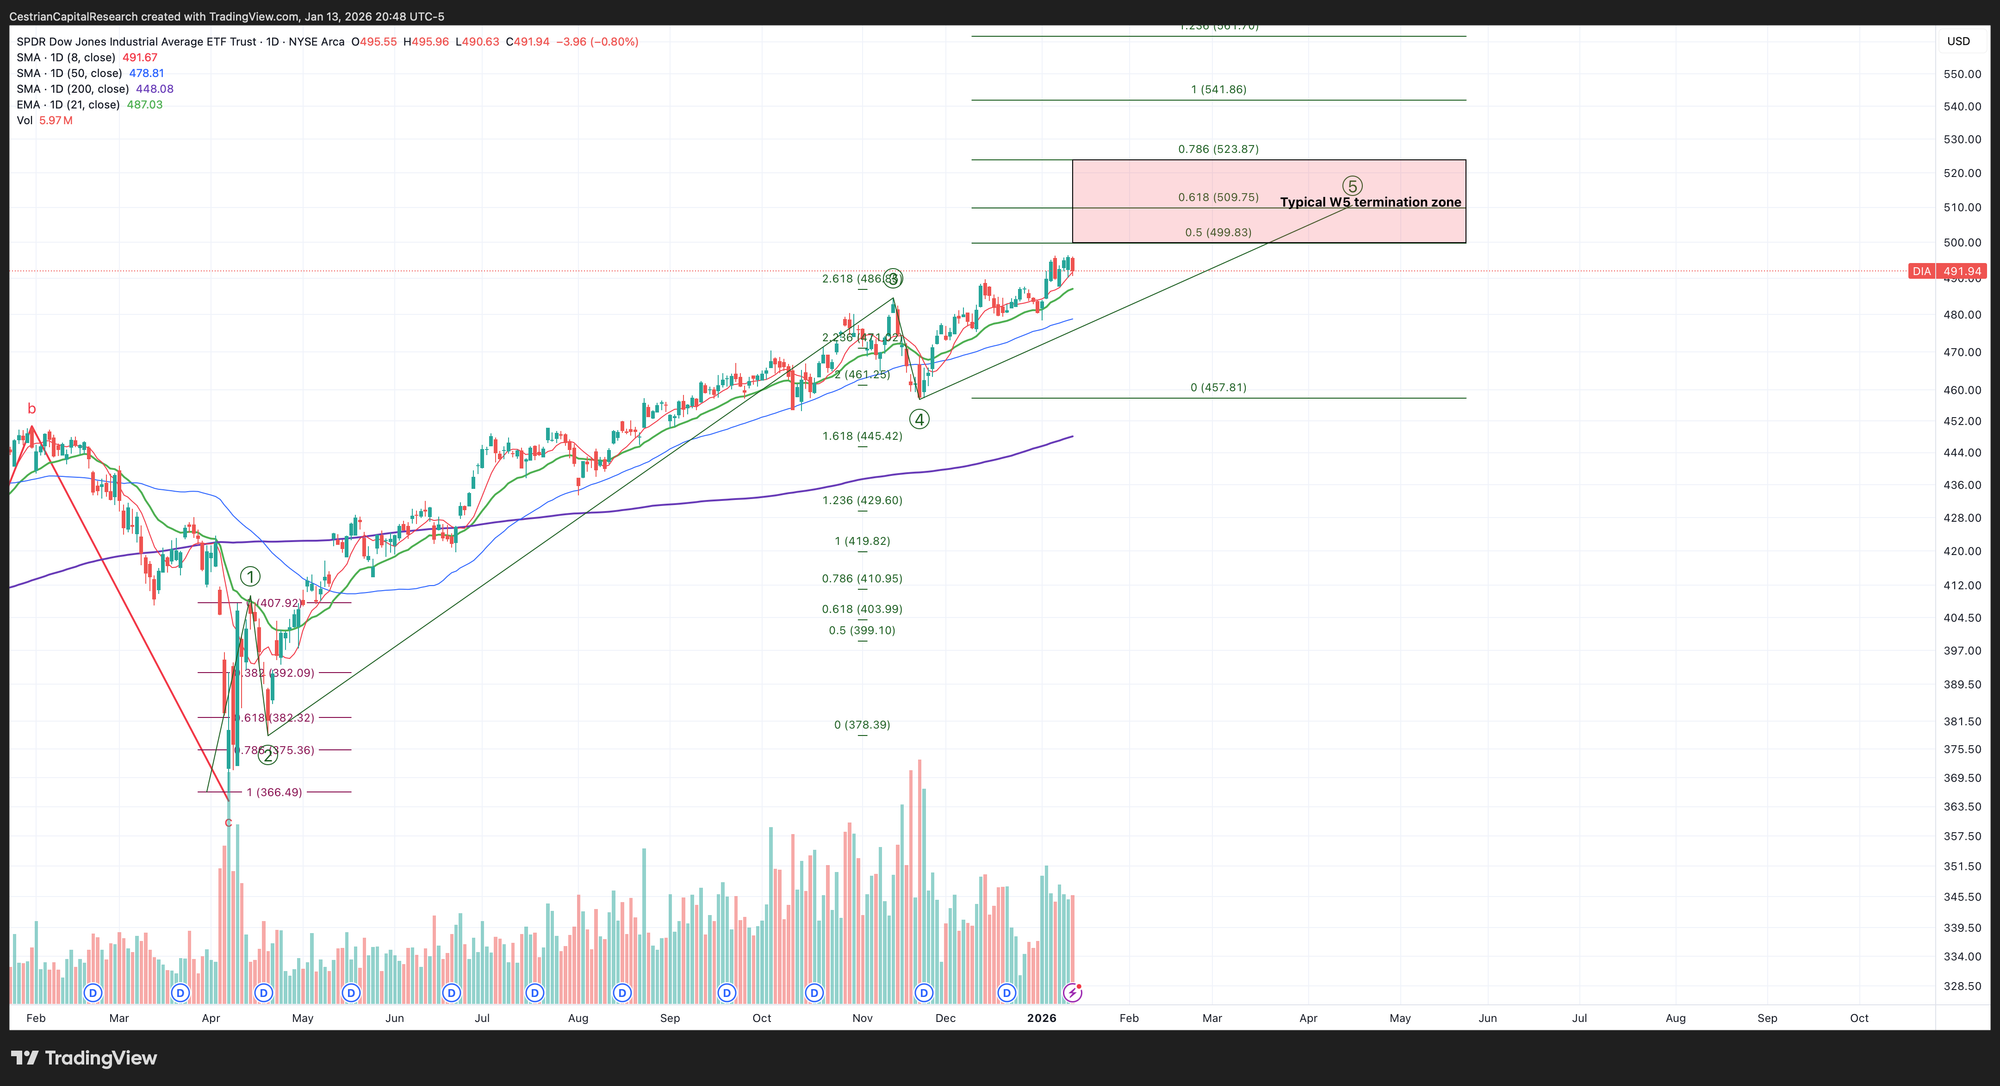
Dow Jones / DIA / UDOW
Continuing its only-up move.
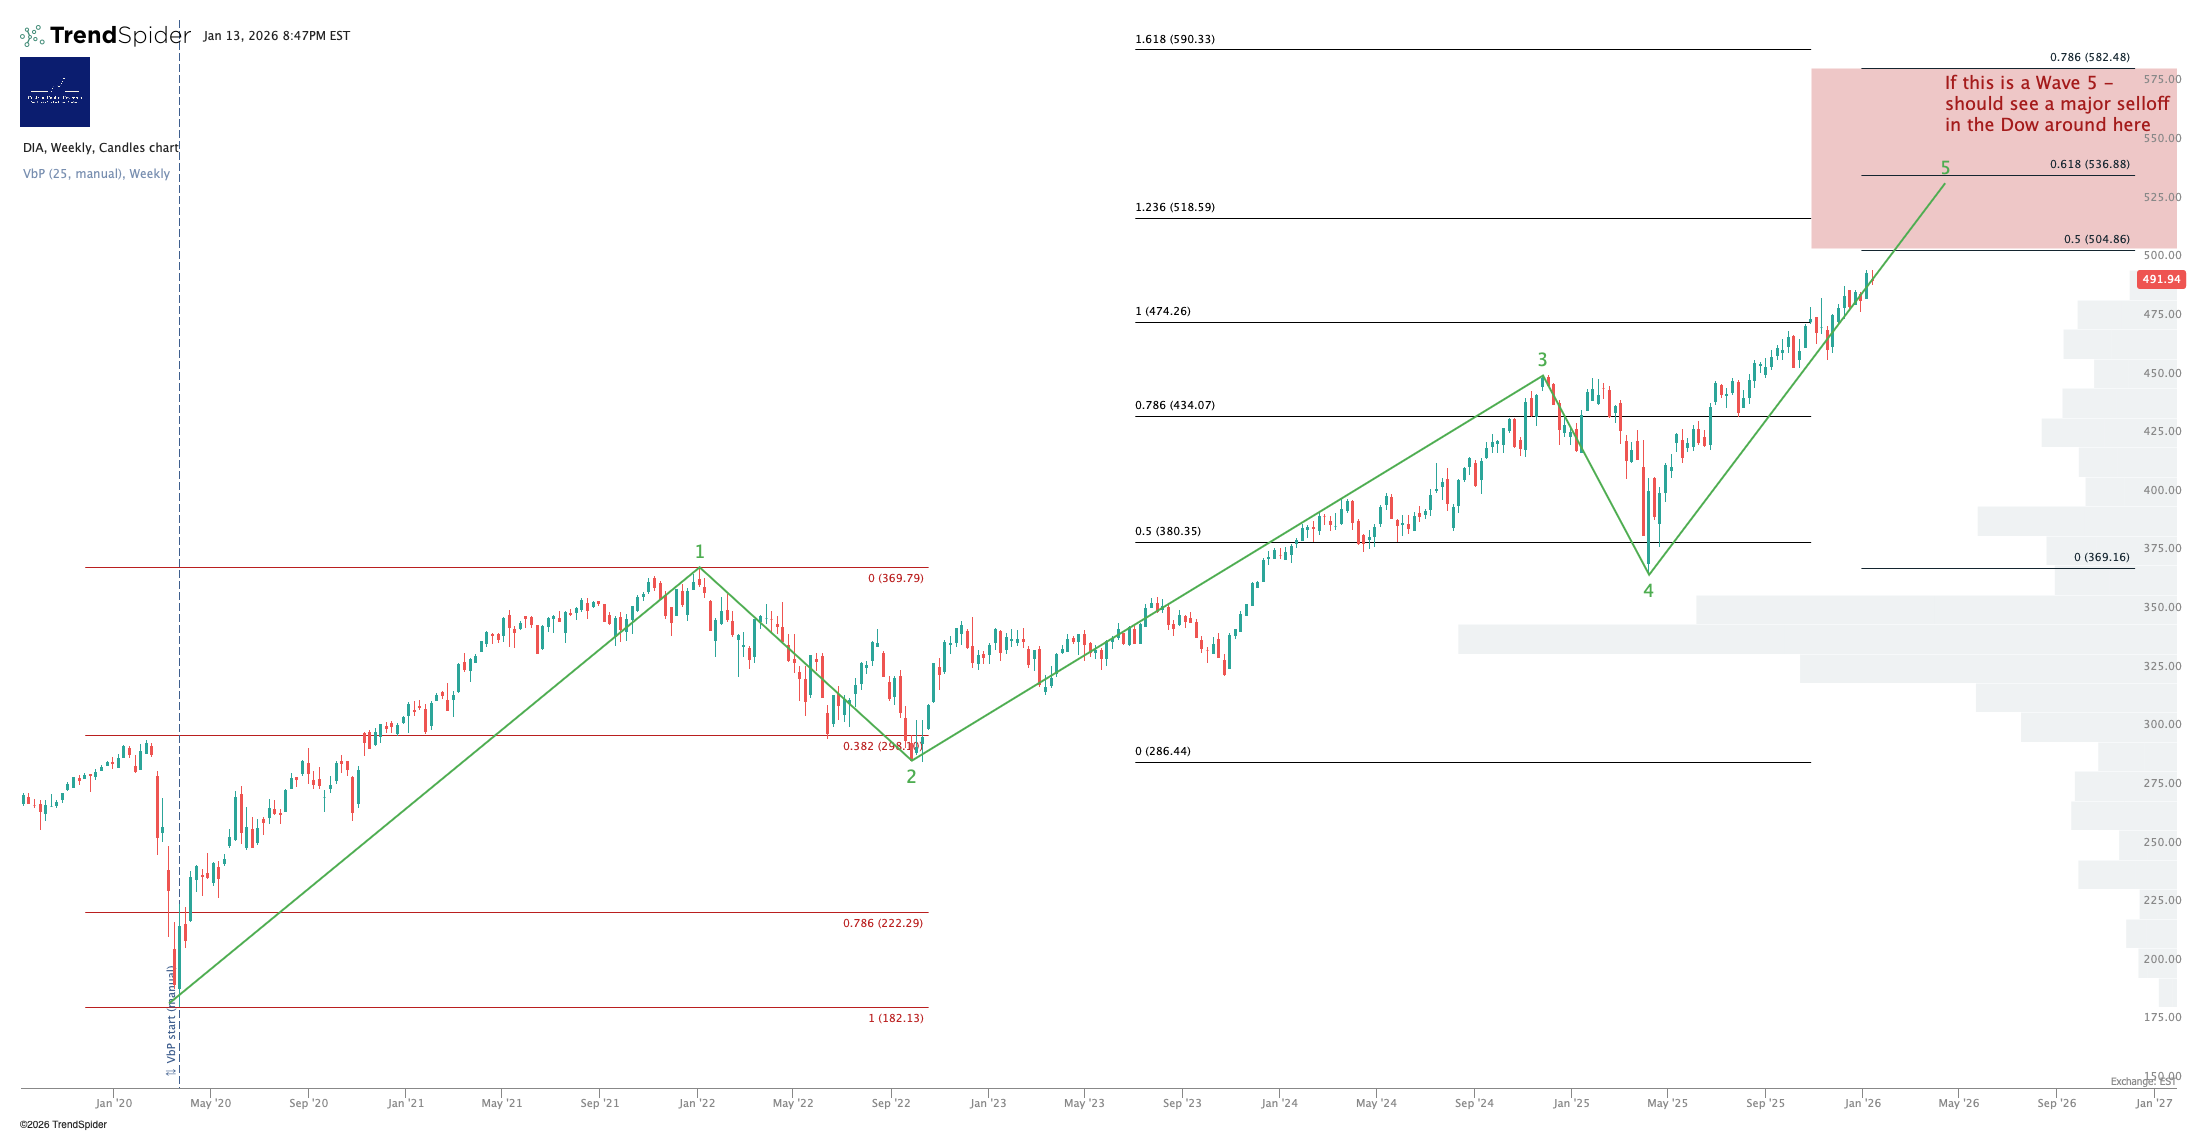
Approaching a local high perhaps.
3x Levered Dow - UDOW Long / SDOW Short
Note - Leveraged ETFs. Read the fund documentation if you are considering using these instruments.
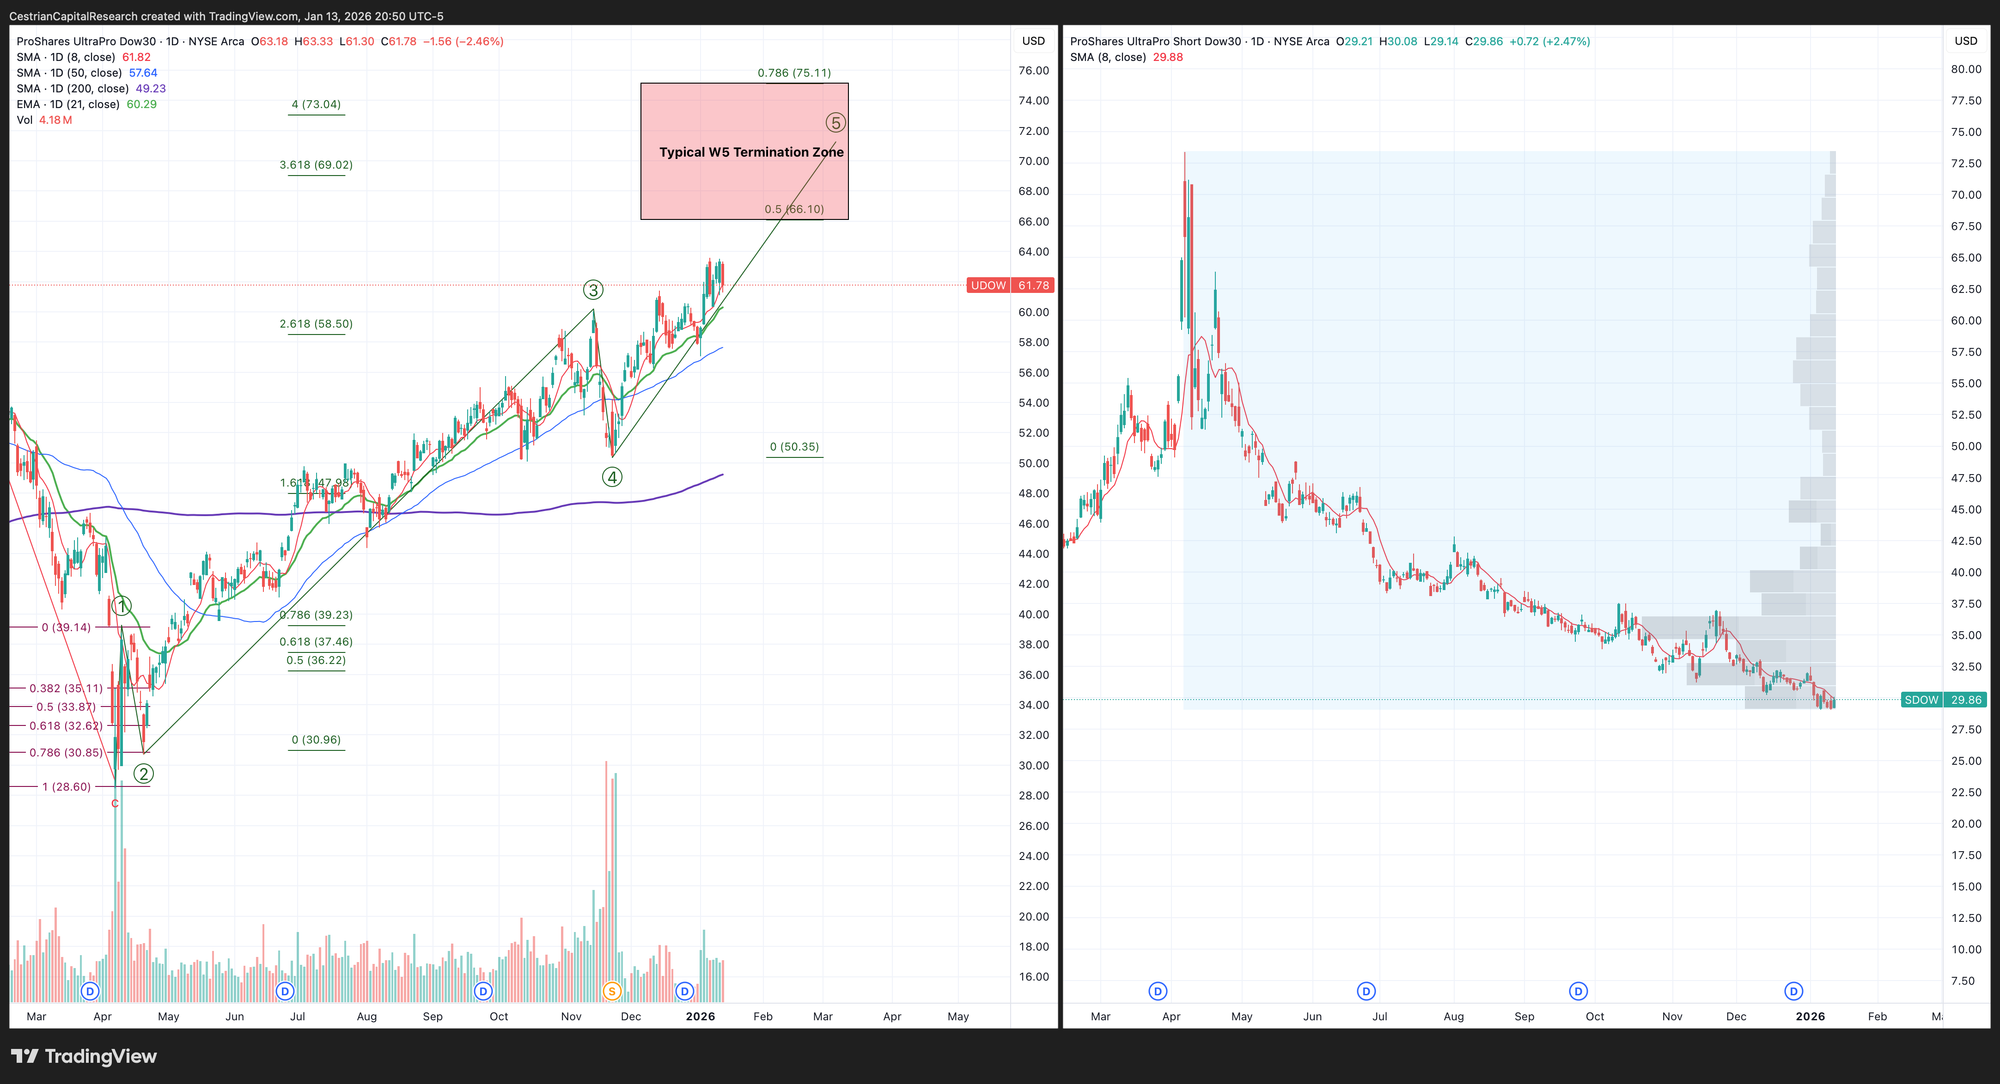
Disclosure: No position in the Dow.
NEW! Sector Rotation
Defense rules the YTD.
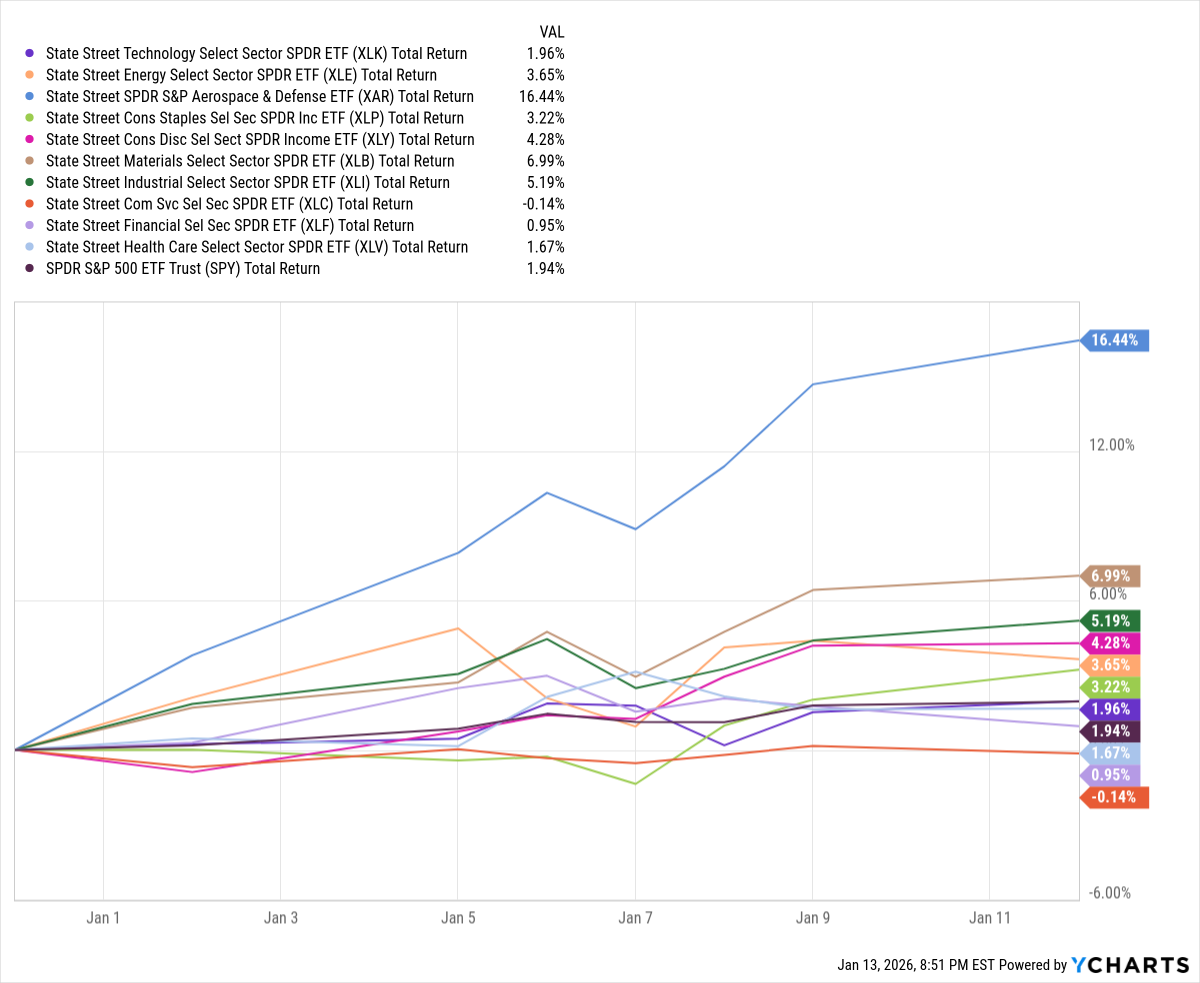
Looking upwards.
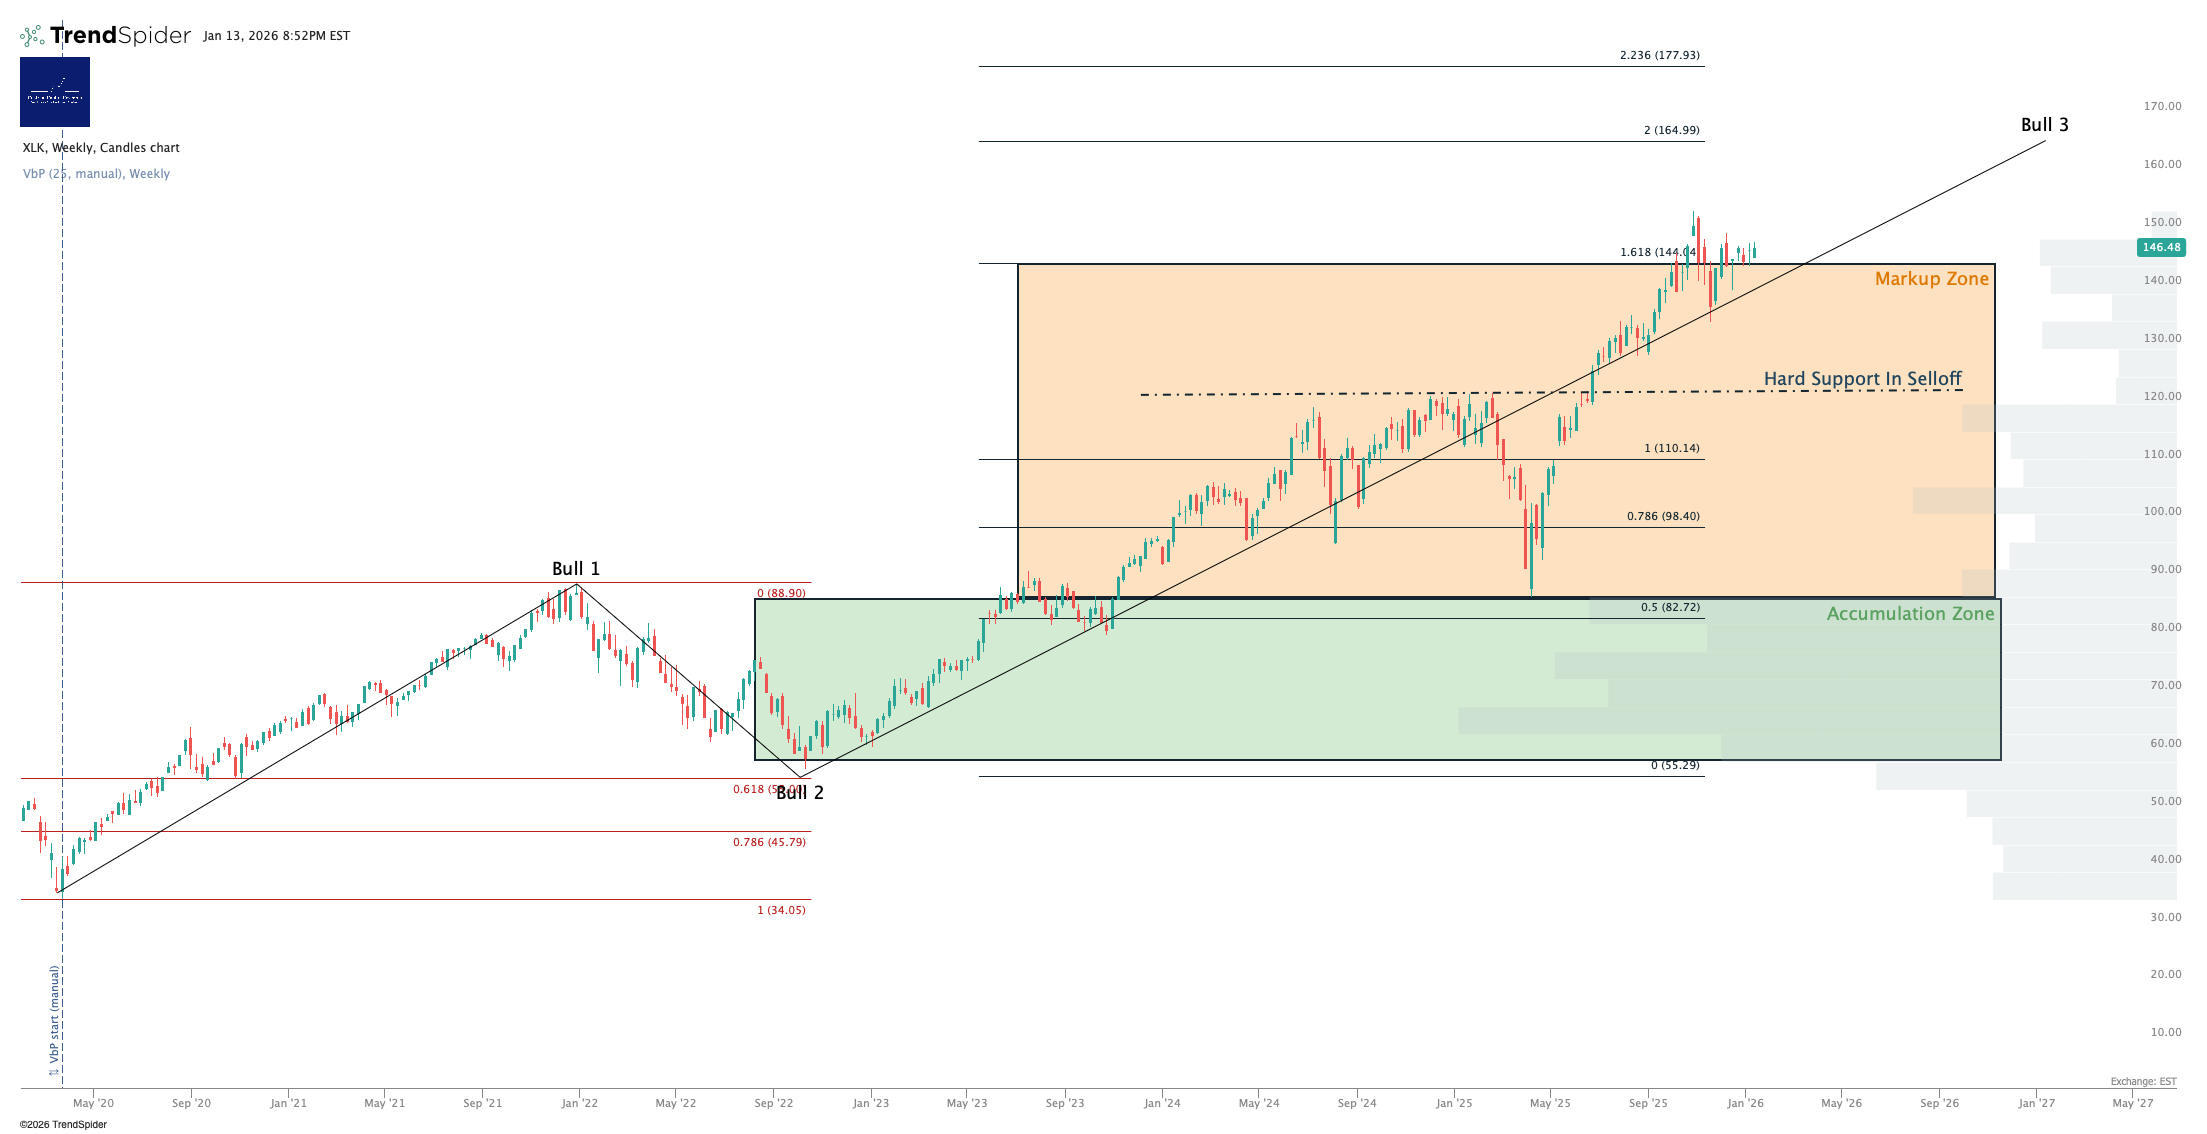
Disclosure: I am positioned in XLK per our SignalFlow AI Growth Service.
3x Levered Long/Short Tech - TECL/TECS
Note - TECL and its inverse TECS tend to be illiquid outside RTH with relatively wide bid/ask spreads.
Note - Leveraged ETFs. Read the fund documentation if you are considering using these instruments.
More on these long / short ETF pairs tomorrow.
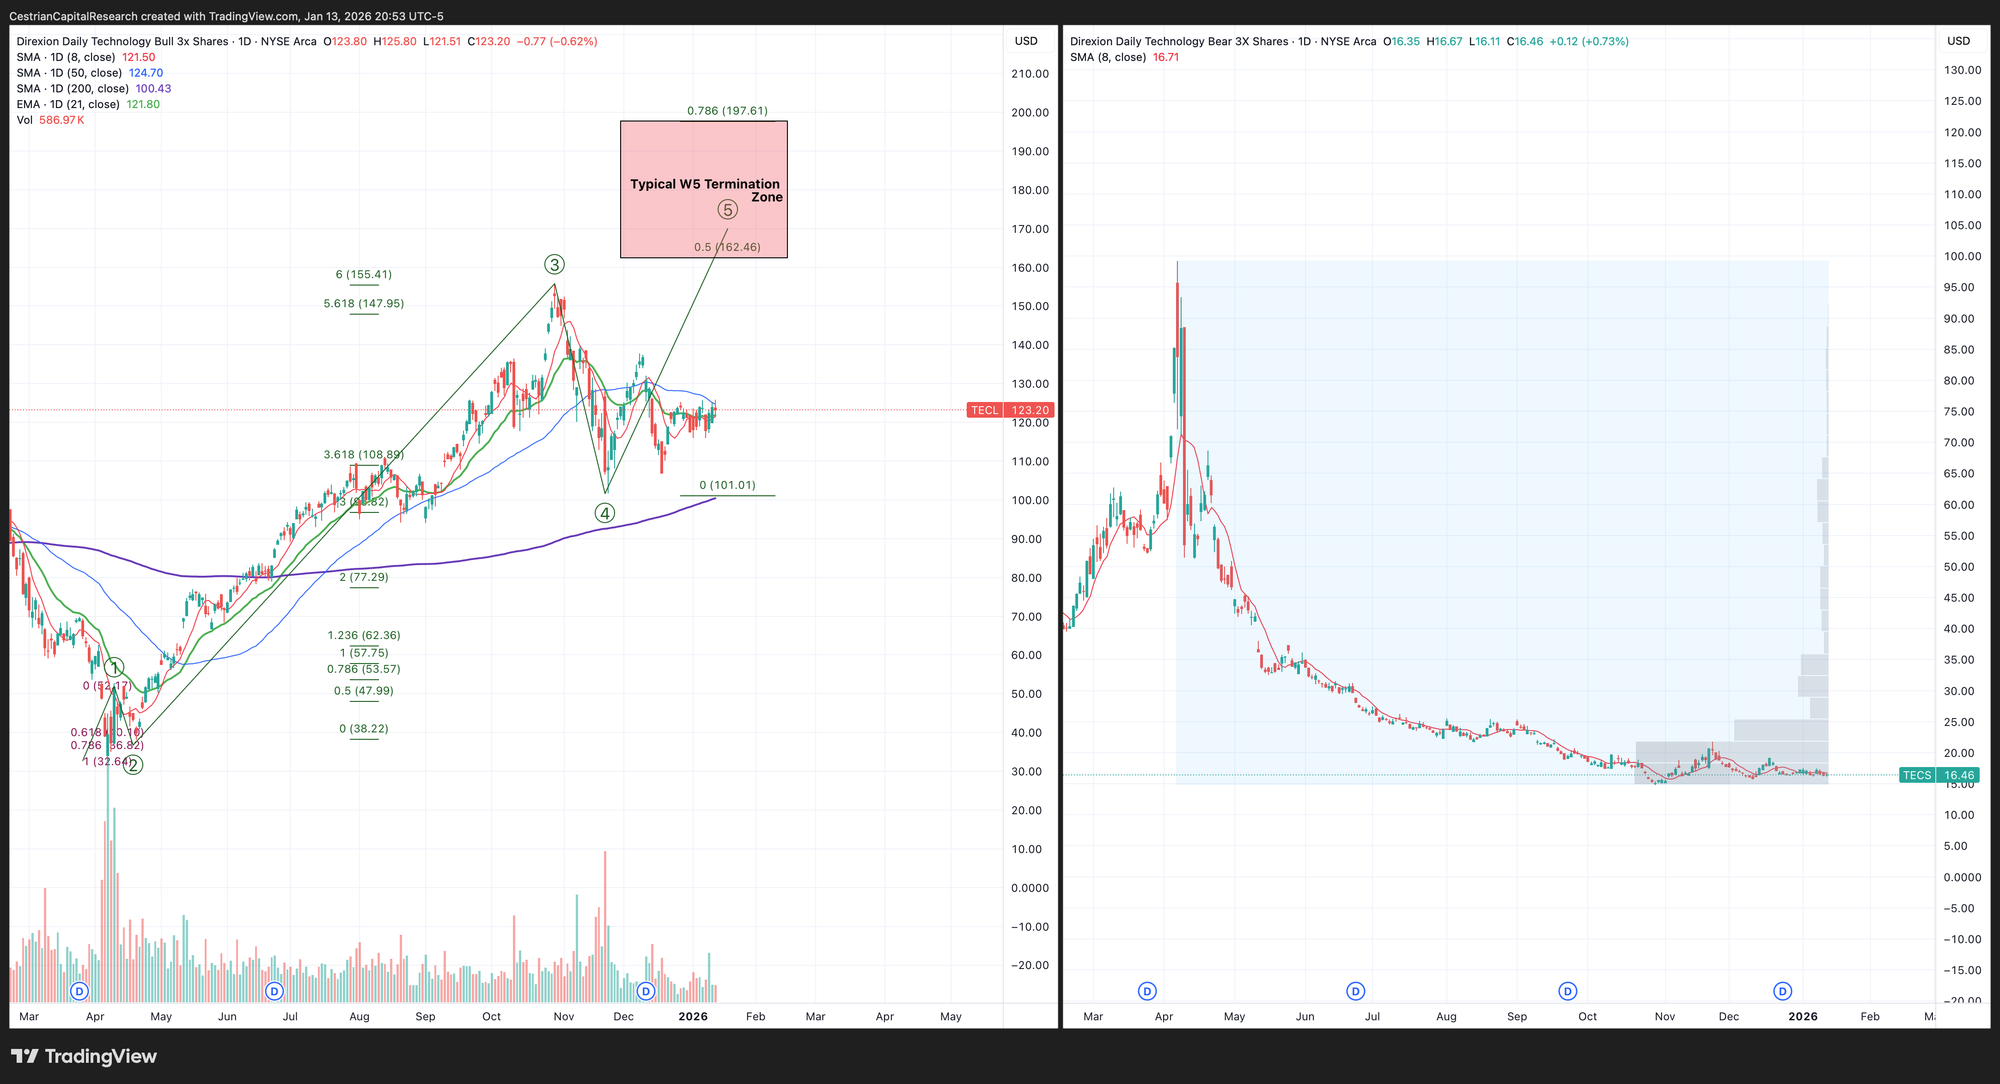
Disclosure: No position in TECL or TECS
SOXX (Semiconductor)
Getting closer!

3x Levered Long / Short Semiconductor - SOXL / SOXS
Note - Leveraged ETFs. Read the fund documentation if you are considering using these instruments.
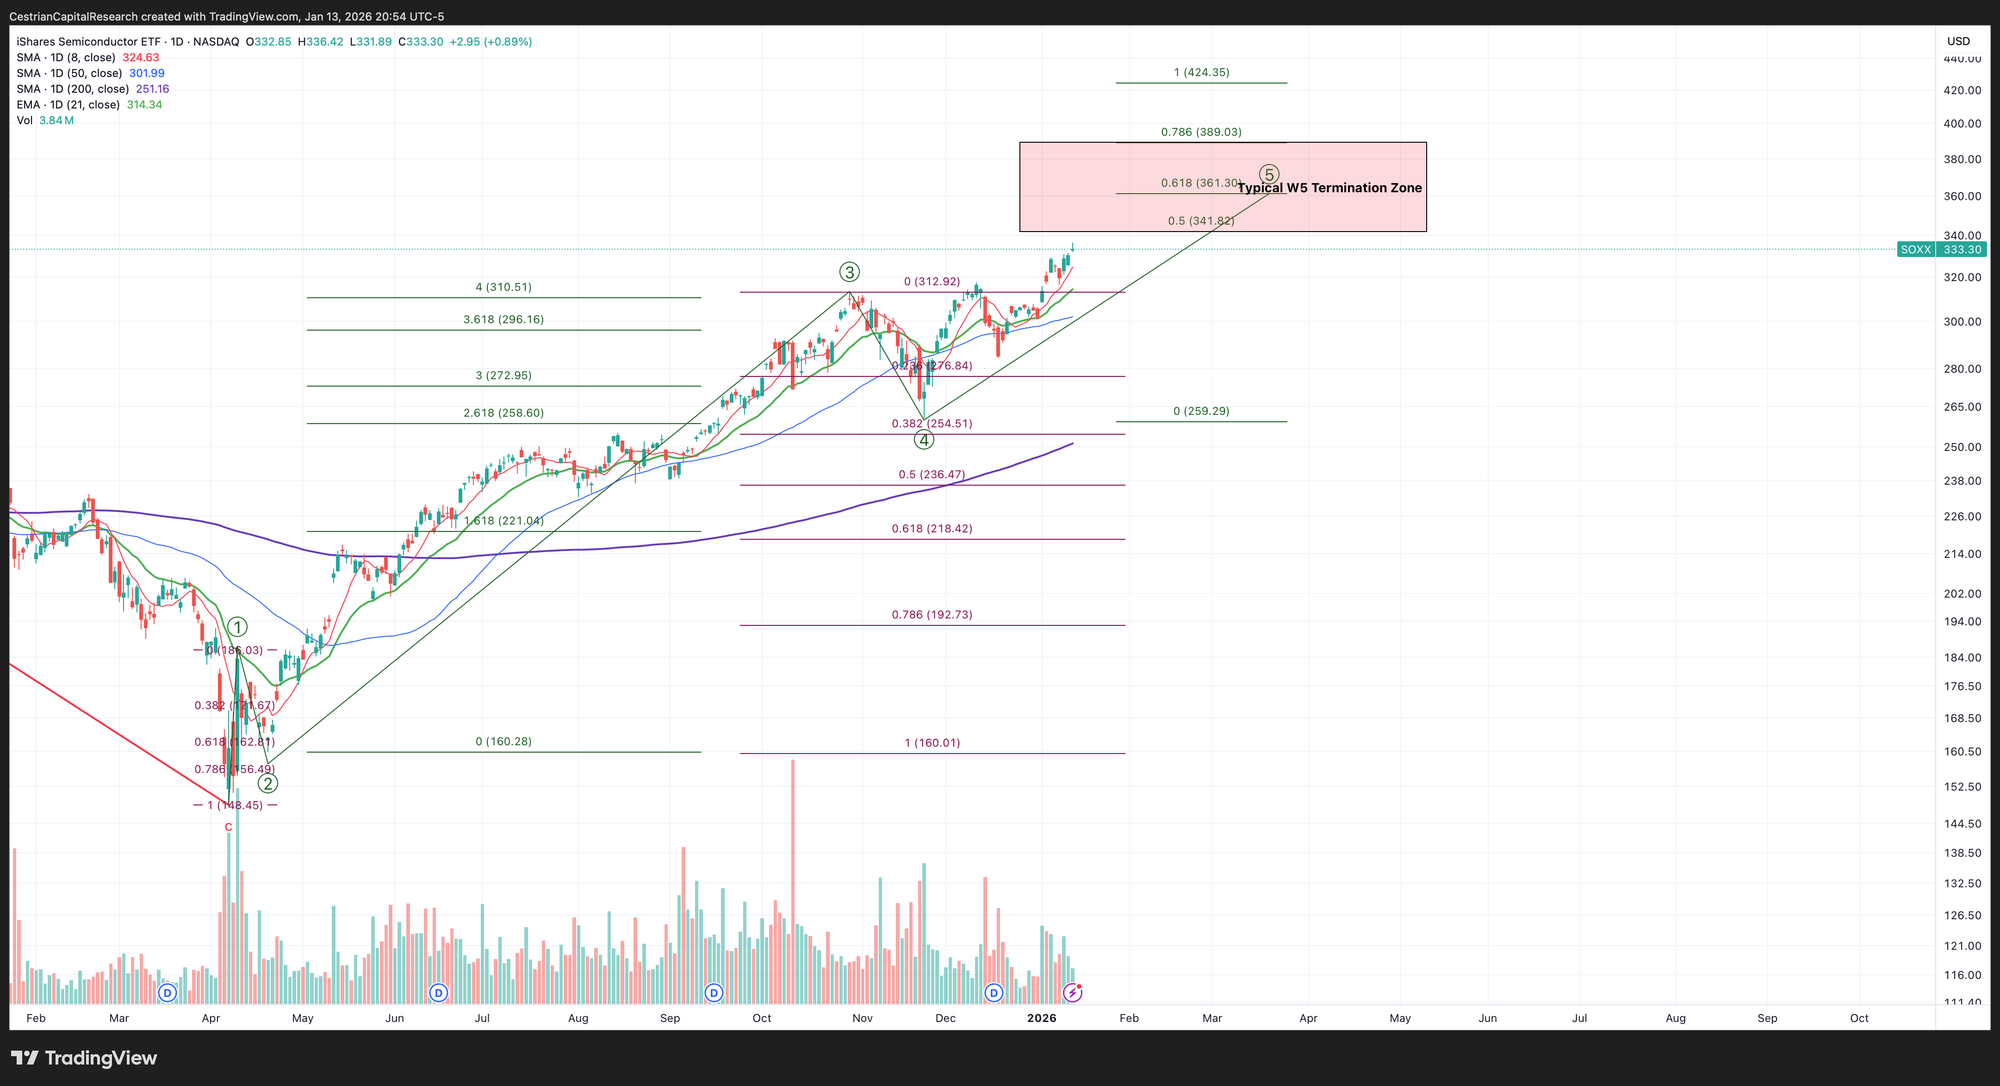
Disclosure: I am hedged approx 3.8:1 $SOXL:$SOXS
NEW! International Equity Indices
The Nikkei is also reaching for the skies.

Alex King, Cestrian Capital Research, Inc - 11 January 2026