
Market On Open, Wednesday 15 October

DISCLAIMER: This note is intended for US recipients only and, in particular, is not directed at, nor intended to be relied upon by any UK recipients. Any information or analysis in this note is not an offer to sell or the solicitation of an offer to buy any securities. Nothing in this note is intended to be investment advice and nor should it be relied upon to make investment decisions. Read our full disclaimer, here.
It Wasn’t The Cooking Oil.
by Alex King, CEO, Cestrian Capital Research, Inc
As everyone knows, POTUS’ tweets now drive the market. Trillions of dollars are swayed by posts on Truth Social and/or X like this one from yesterday:

Right around the time that happened yesterday, the S&P started selling into the close and turned a promising recovery day into a precariously volatile day.
Right.
Because the market-moving accounts in the S&P500, the largest investors who are hedged thisaway and thataway and so deliver a solid grind up in value year in year out, what they do is, when they see a post about Cooking Oil, they go, YIKES BETTER SELL THE S&P500 IN SIZE.
Seriously.
In an alternative set of facts which just maybe we should consider in our quest to better understand markets, maybe the S&P500 hit a key moving average from below, rejected it and sold off.
Something like this.
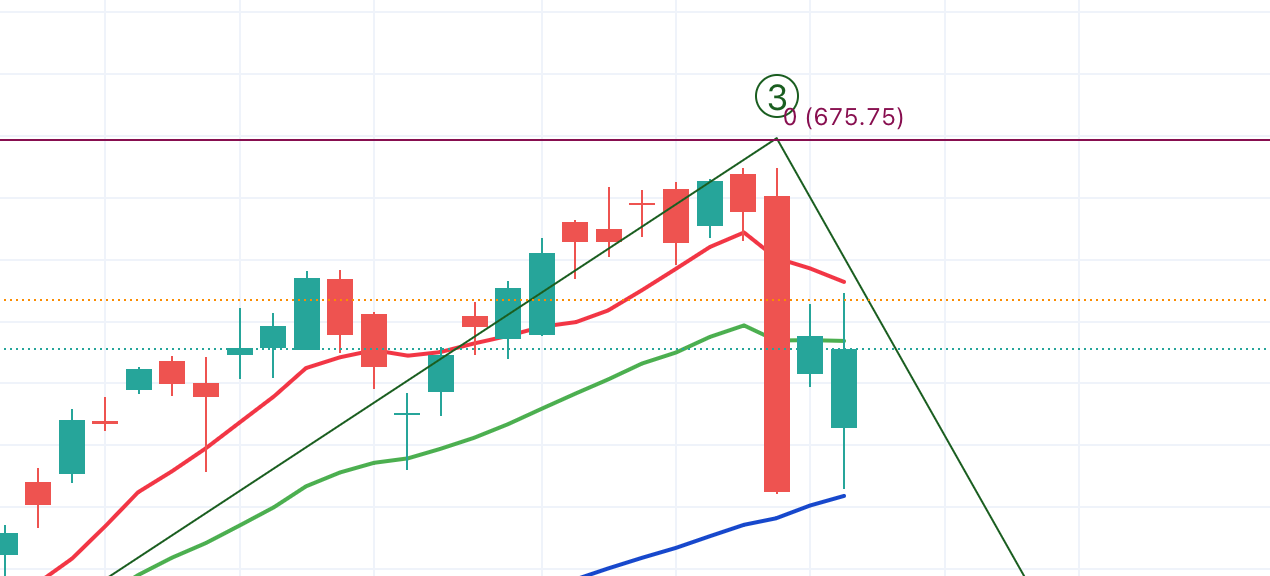
Blue line - 50-day simple moving average.
Green line - 21-day exponential moving average.
Red line - 8-day simple moving average.
On Tuesday, $SPY opened midway between the 50-day and the 21-day. It traded up to just below the 8-day, rejected it, and then traded down to close just below the 21-day.
You can explain literally the entire day’s trading by looking at how these moving averages were respected through the day. And that is the signature of Big Money at work. Not Oh Yikes Cooking Oil Woe Is Us.
There are other methods to analyze securities movements that aren’t charts. Another method that works is order flow; in essence looking at the actual live orders (real-time and resting orders ie. those placed previously with limits). And looking at option positioning is pretty useful too. All these methods usually converge on similar conclusions if you are doing them right. These are all good ways to try to predict where price will move to.
The market is many things, but magical mystery tour it is not. You can learn to read it, predict it a little bit, and most importantly learn to react to what it is telling you.
You can also outsource the whole thing.
Let The Machine Take The Strain
An update on how our simple long-only S&P500 algorithmic signal service is doing. As a reminder, this is about the easiest algorithmic service anyone could imagine. SignalFlow AI For $SPY prints a one or a zero right after the close each day. A one means the model thinks the market is likely flat or up the next day; a zero means the model thinks the market is likely down the next day. The model is designed to help investors avoid big drawdowns; in other words the intent is that the model flips to 0, risk off, before any big selloff in the S&P. And that if you traded according to model outputs, the idea is that you can step aside whilst the pain torments others, then get back in with your account relatively unharmed - thus preserving (1) capital and (2) emotional balance.
Here’s the cumulative performance of the algorithm vs. simply holding SPY over the same period. The service went live mid-2024; the data prior to that is backtested, the data after that is live trading ie. out in the wild, for real. You can see from a simple visual inspection the benefit of avoiding those material selloffs.
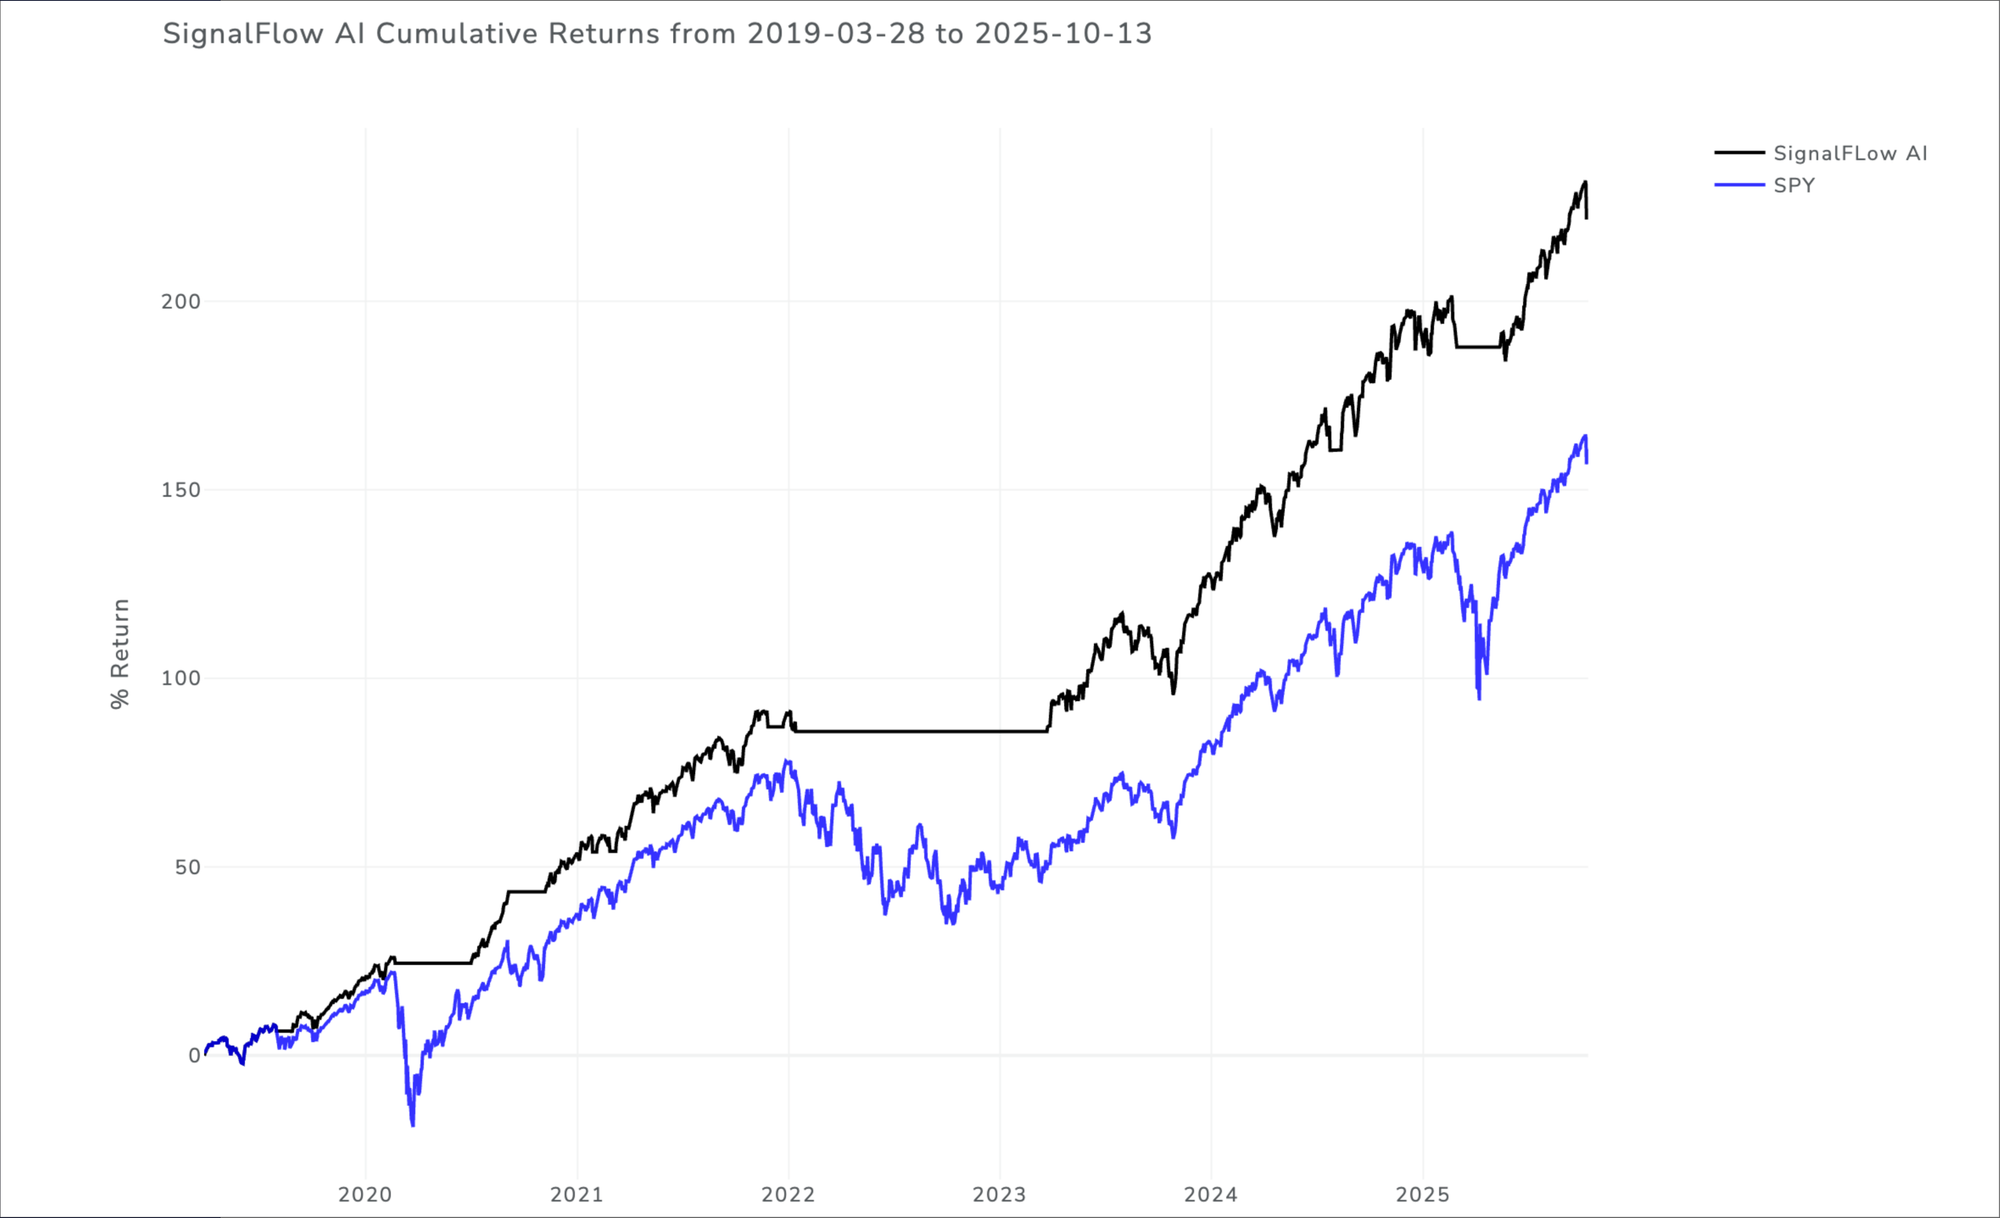
I myself run a pool of capital by following this algo. When it flips risk off, I take this pool of capital out of its S&P exposure. When it flips risk on, I put the capital back into the S&P. I like this a lot. It keeps my capital safe from material drawdowns and it takes the angst away from the decision to go to cash periodically.
You can learn more about this service here (if you’re an independent investor) and here (if you’re an investment professional). If you don’t know if you’re an investment professional or not, you can check our Ts & Cs here (look for section 1.5).
You can also read about the whole family of SignalFlow AI algorithm services here:

OK, let’s do it. Here’s our daily market note, covering yields, bonds, equities, volatility, oil, crypto, and key sectors. Join our Inner Circle service if you’d like this note in your inbox every trading day.