
Amazon Q3 FY12/25 Earnings Review

DISCLAIMER: This note is intended for US recipients only and, in particular, is not directed at, nor intended to be relied upon by any UK recipients. Any information or analysis in this note is not an offer to sell or the solicitation of an offer to buy any securities. Nothing in this note is intended to be investment advice and nor should it be relied upon to make investment decisions. Read our full disclaimer, here.
Meh
by Alex King, CEO, Cestrian Capital Research, Inc.
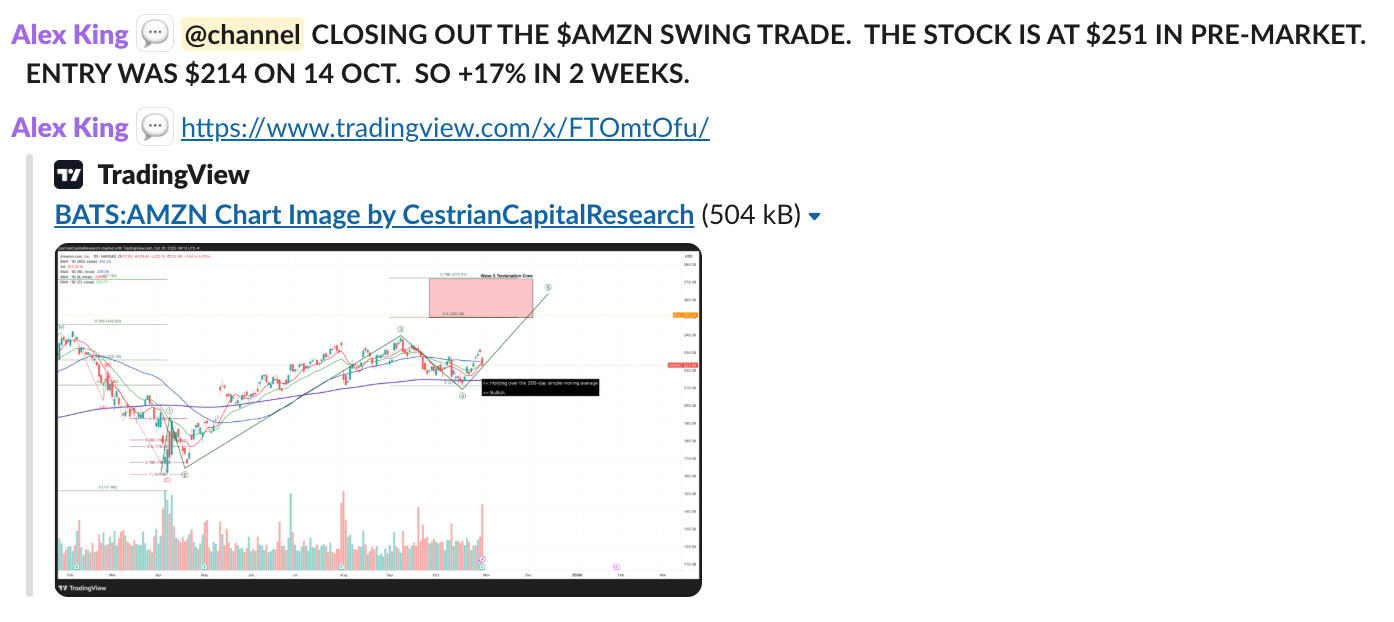
In our Inner Circle service we just closed $AMZN out as a swing trade.
This was the entry on 14 October, at $214 (with proposed stop-loss levels).
And here’s the exit this morning in pre-market trading at $251. So a +17% gain in two weeks.
It could be that $AMZN zooms higher from here; if it does, great, since speaking personally I have long S&P500 and long Nasdaq-100 positions that should benefit.
On a single-stock basis though, I think the stock is ripe for selling.
- The fundamentals look unimpressive to me; growth is fine, yes, but cashflow margins are razor thin and the balance sheet is weakening.
- The stock is at the lower end of a typical topping price zone for the bull phase that began at the April lows this year.
I wouldn’t short the stock personally - we’re in a bull market, shorting big names is a great way to lose money and be unhappy when everyone else is happy and making money. But I’m happy we closed out another winning swing trade.
Summary Fundamentals
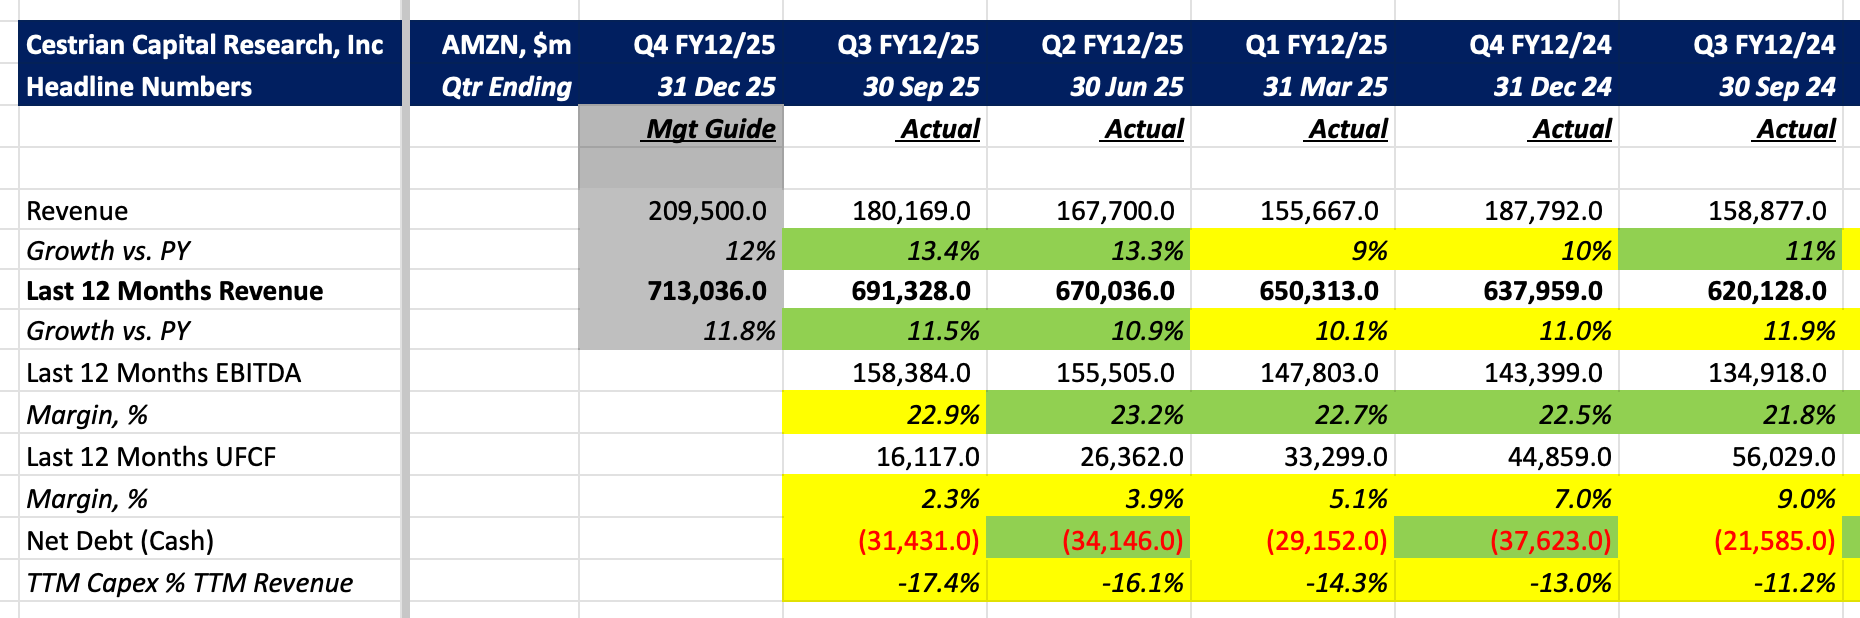
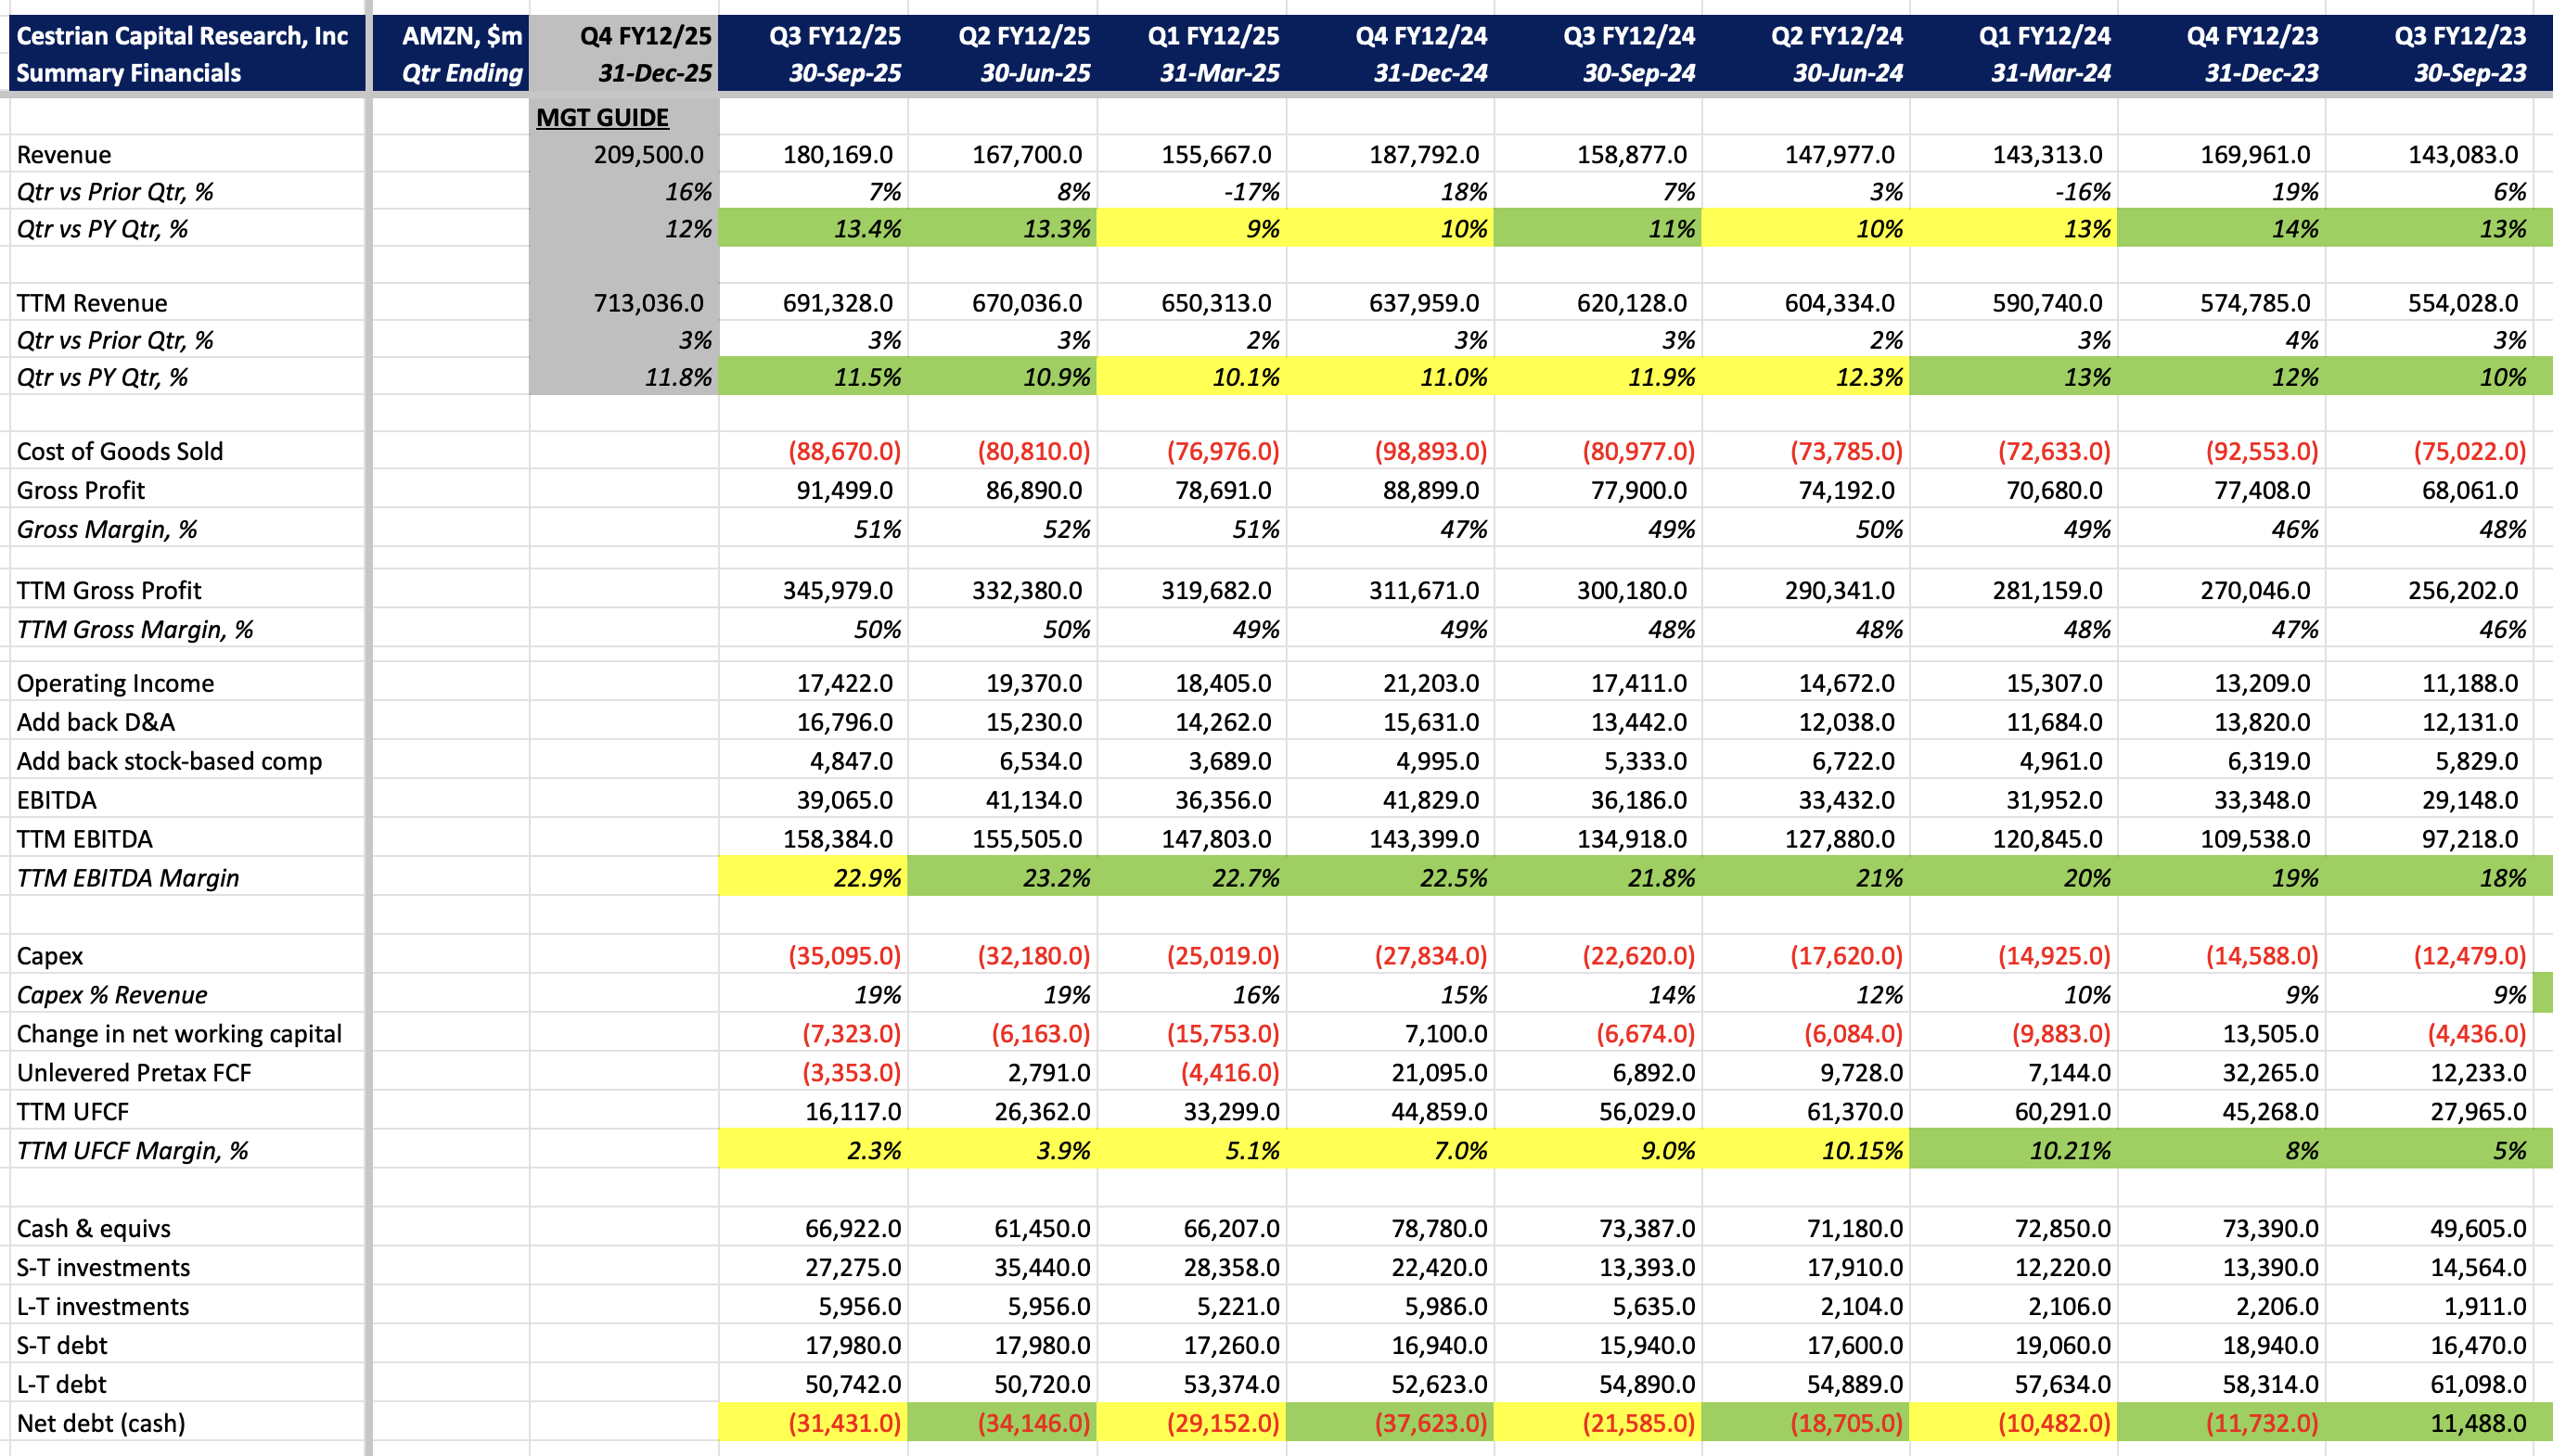
Growth holding up fine at +11.5% on a TTM basis, which has been fairly consistent for the last year or so. Cashflow margins are collapsing as the capex as a % of revenue ramps. 2.3% TTM unlevered pretax FCF margins now, vs. 9.0% a year ago. Capex as a % of revenue is up 50% in that time, from 11% a year back to 17% now. Yes, AI, I know, but numbers are numbers.
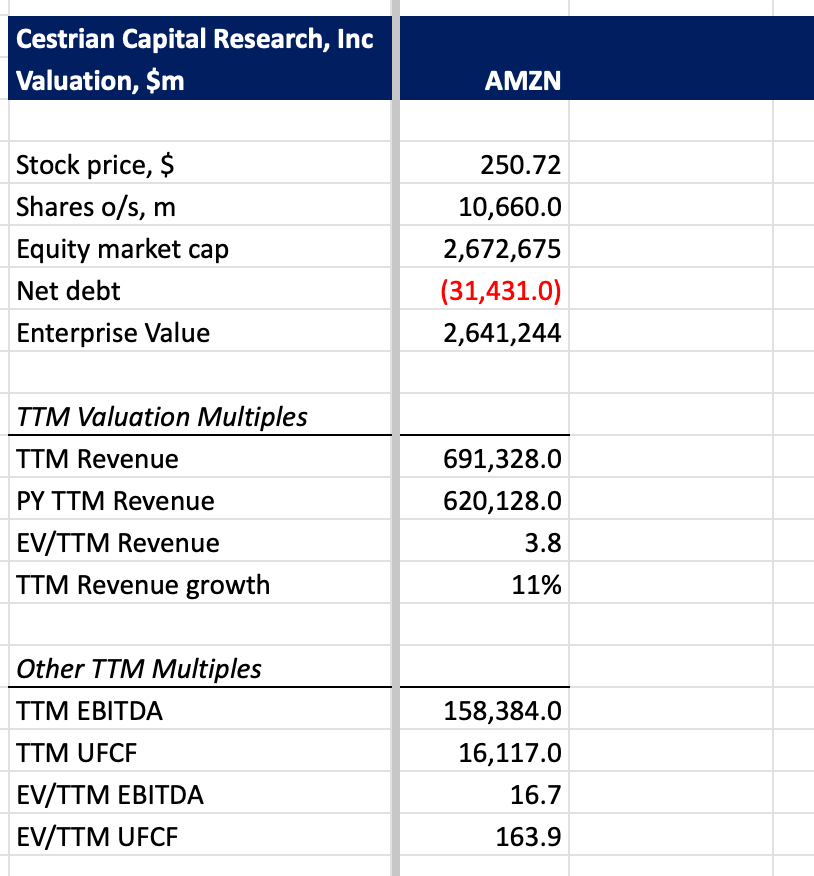
Valuation
I think that 163x TTM unlevered pretax FCF is very high for an 11% growth business.
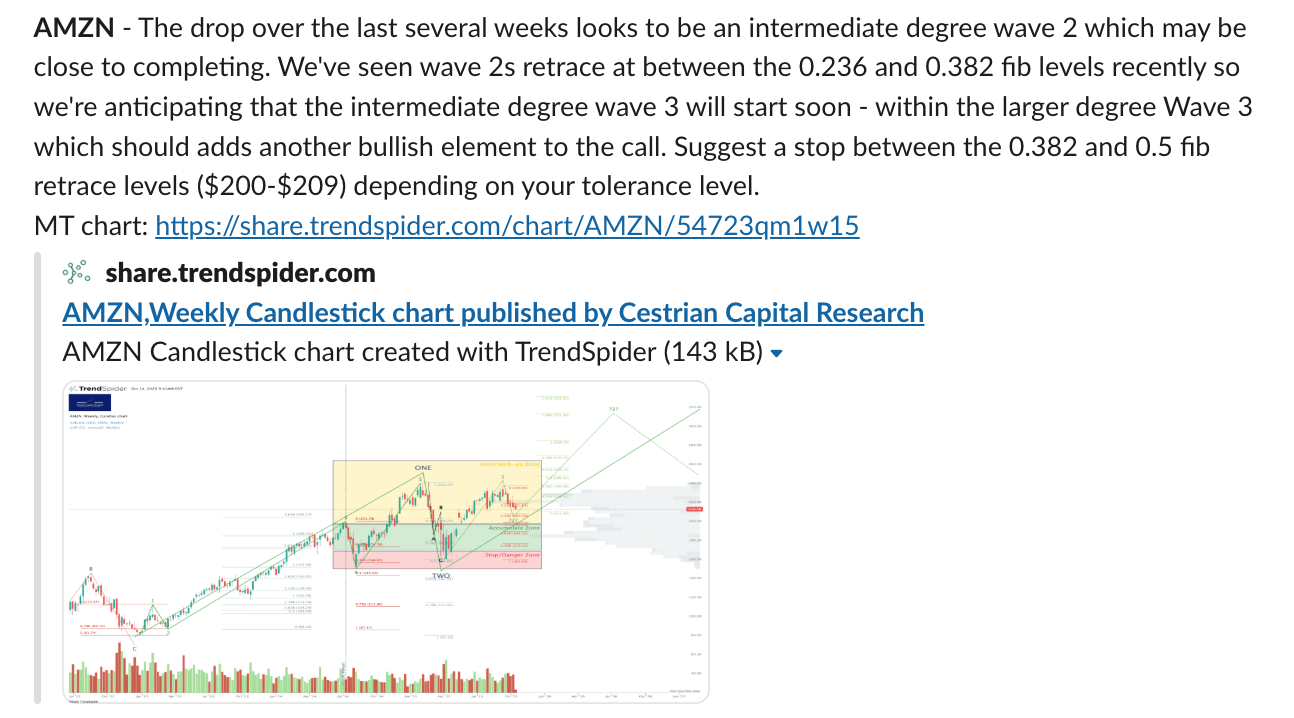
Stock Chart And Price Outlook
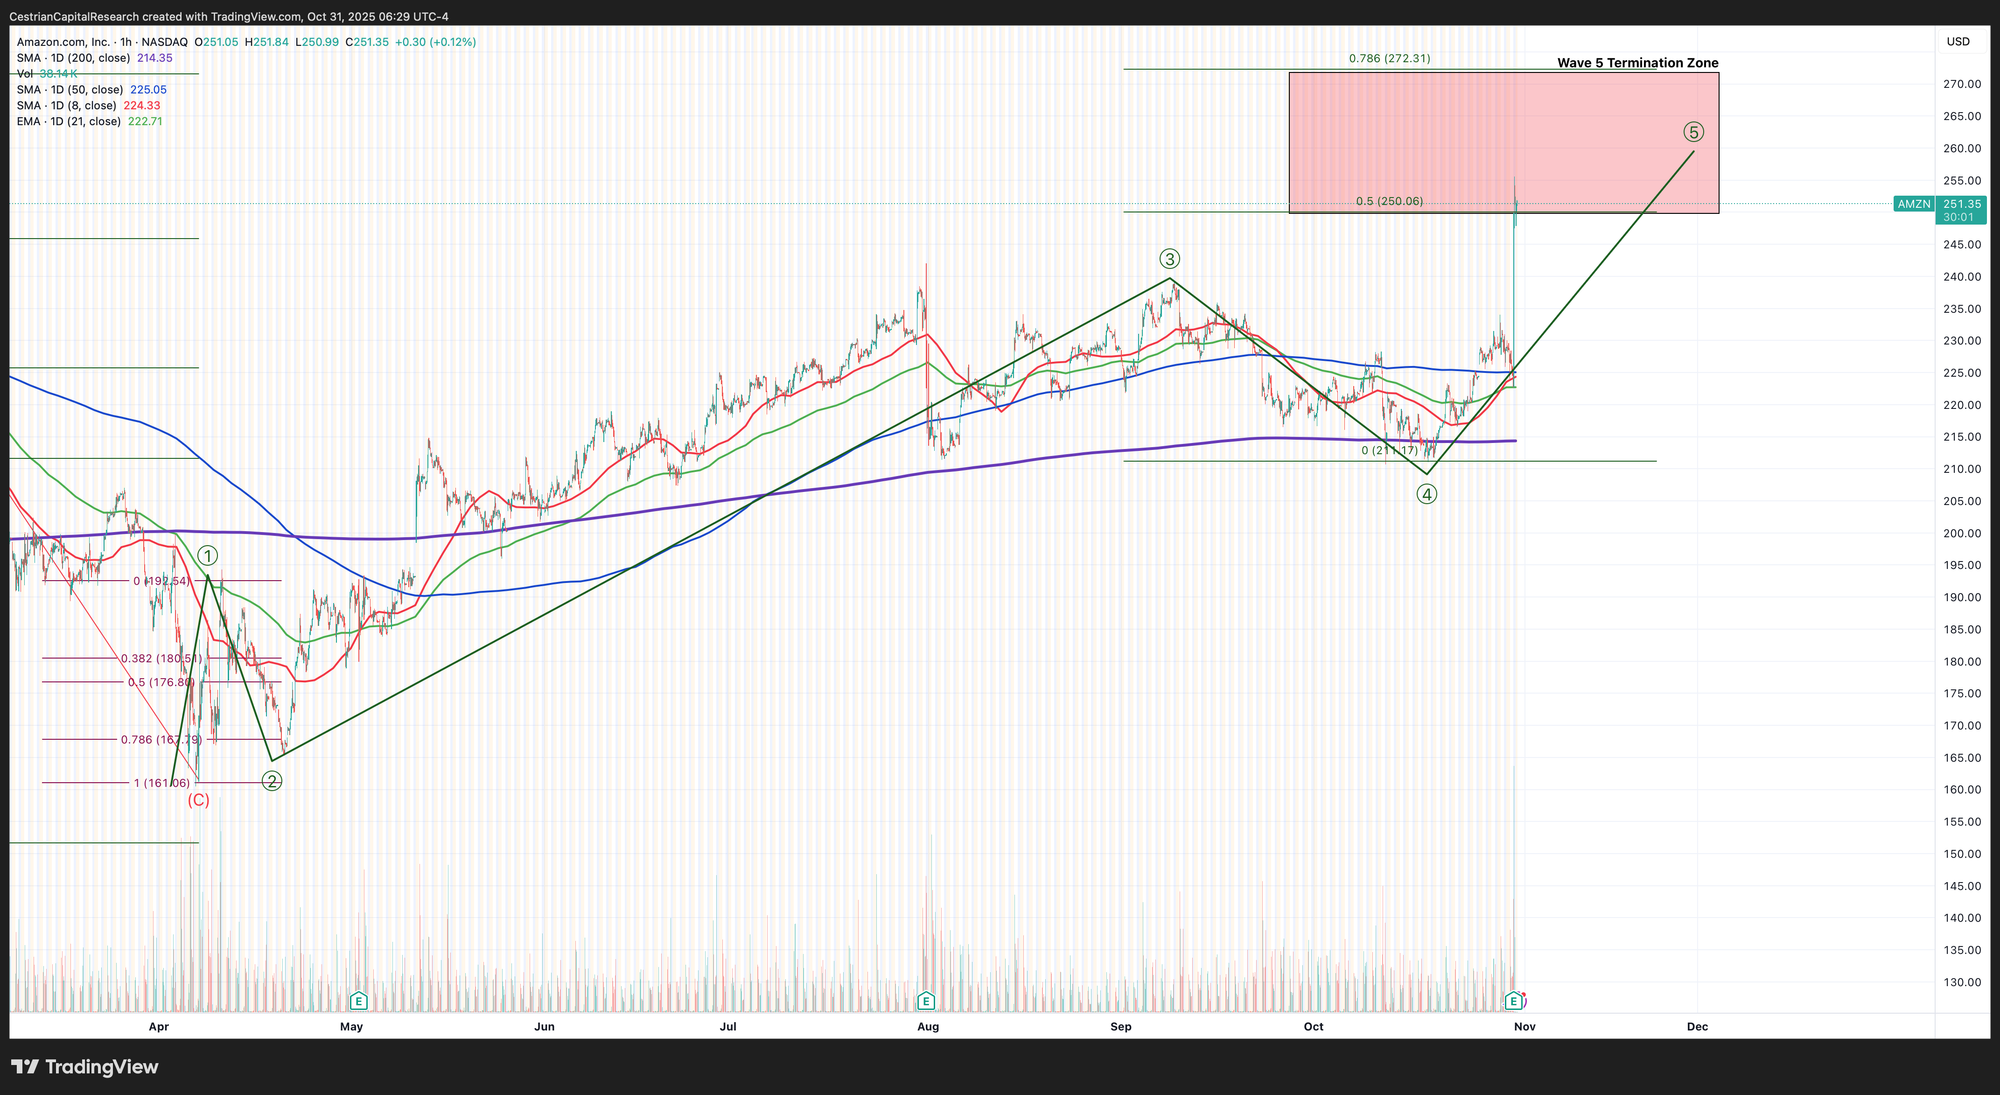
You can open a full page version of this chart, here.
From the post-Liberation Day lows in April, the stock has just crossed up and over the lower bound of our typical Wave 5 Termination Zone, which is to say that at $251 it’s at around the 0.5 Fibonacci extension of the Waves 1-3 placed at the Wave 4 low. Oftentimes stocks can shoot higher than here, so it is cautious to sell now, but from a swing trade perspective my own view is that +17% in two weeks is good enough to take the money and not wait. You may have a longer-term view of course!
Rating
Well, a more aggressive investor than myself would rate this at Hold, since the stock could well surge from here to maybe $330 and it wouldn’t be out of kilter with the current price pattern. You can open a full page version of this longer term chart, here.
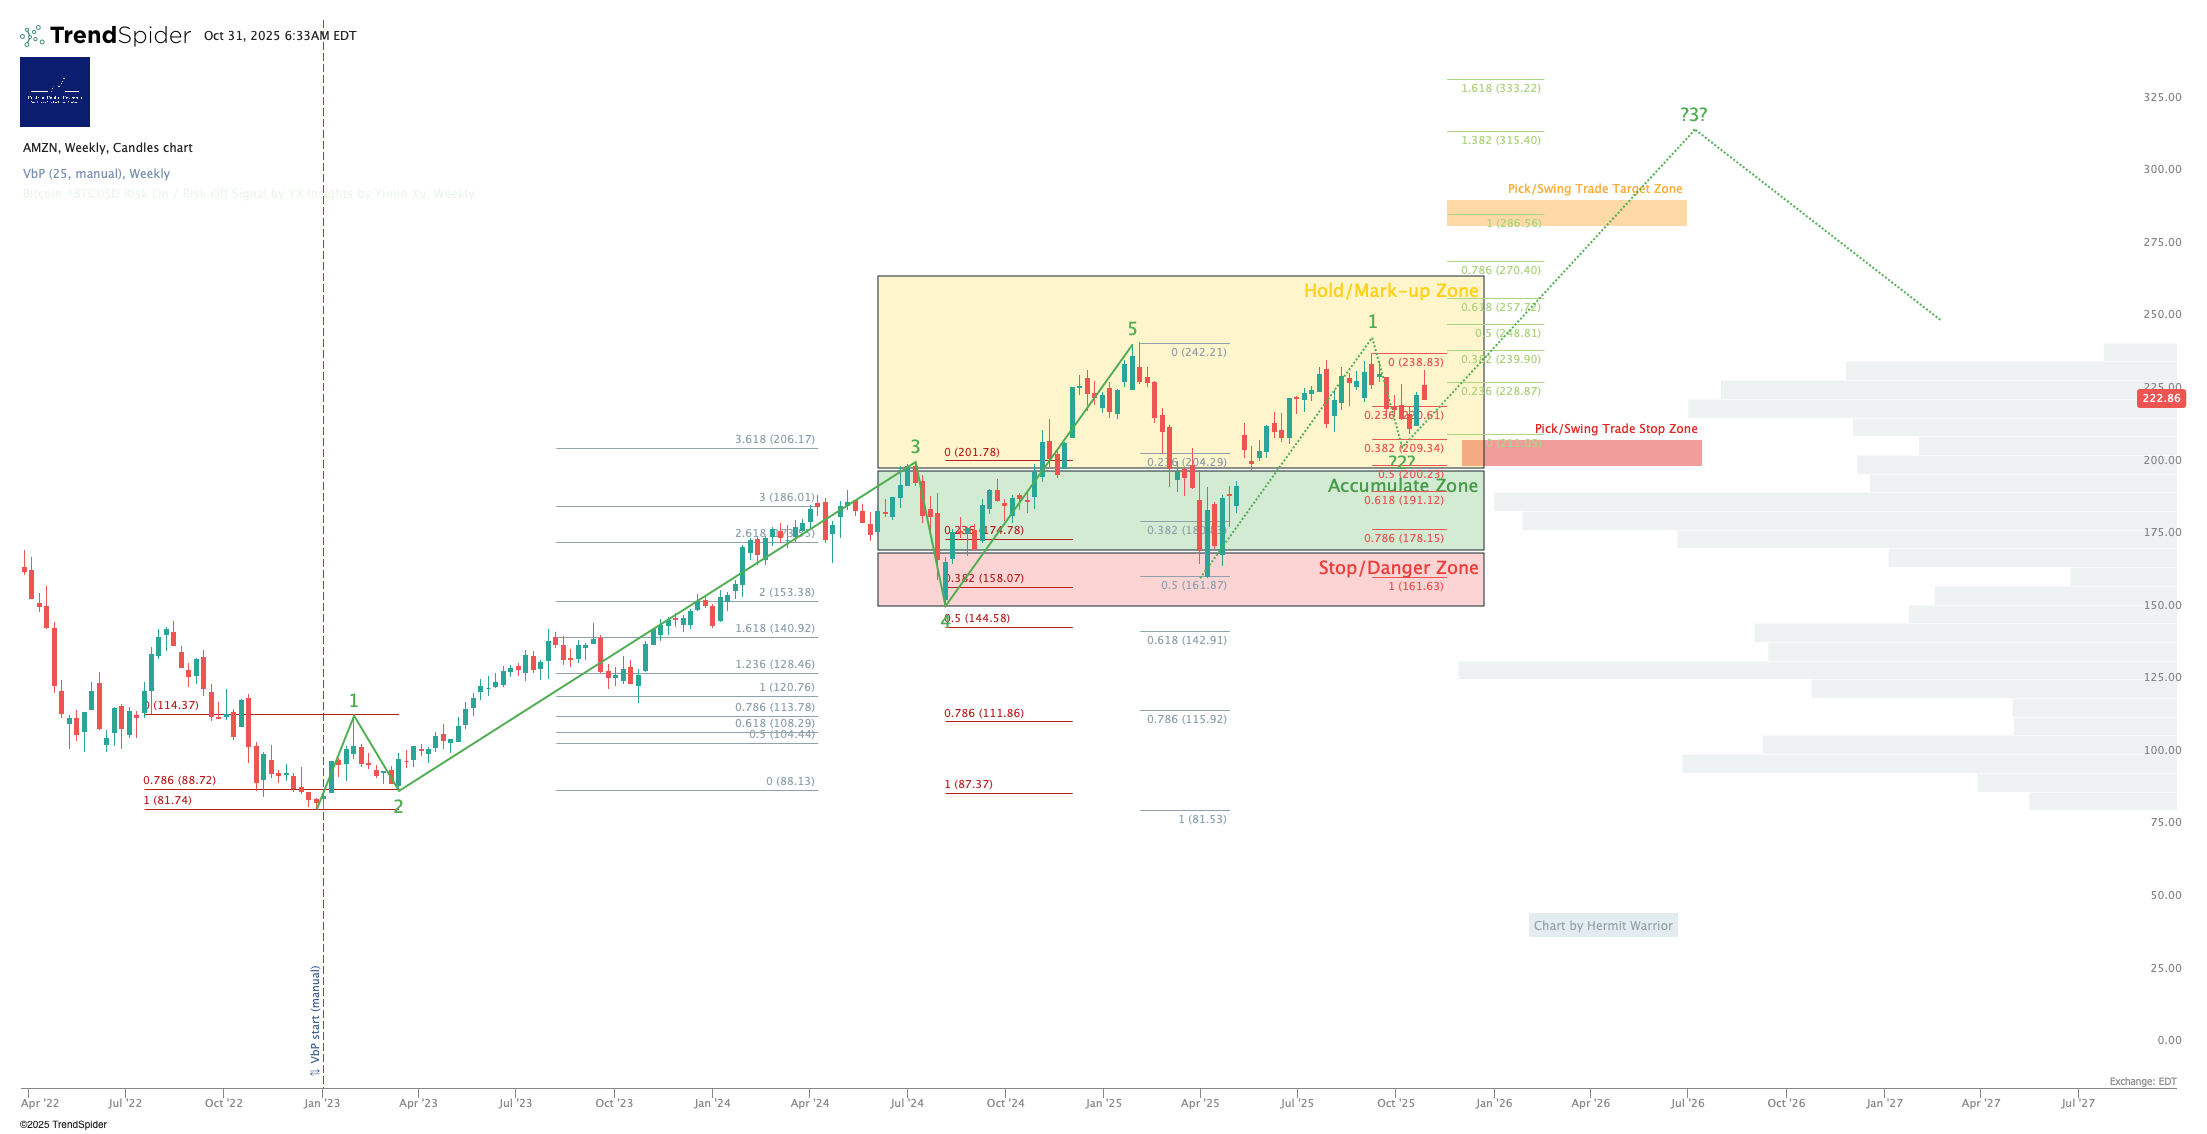
If you own this and you decide to hold, consider setting some stops to protect your gains.
Appendix: Detailed Fundamentals
Cestrian Capital Research, Inc - 31 October 2025.
DISCLOSURE: Cestrian Capital Research, Inc staff personal accounts hold no position(s) in $AMZN save via index ETFs.