
ExxonMobil Q2 FY12/25 Earnings Review

DISCLAIMER: This note is intended for US recipients only and, in particular, is not directed at, nor intended to be relied upon by any UK recipients. Any information or analysis in this note is not an offer to sell or the solicitation of an offer to buy any securities. Nothing in this note is intended to be investment advice and nor should it be relied upon to make investment decisions. Read our full disclaimer, here.
Reality vs. Securities Pricing
If you want to invest in small cap and/or highly specialized energy players then you need to know a lot about the energy sector, and you need to be spending time researching these companies in great depth in order to choose your fighter wisely.
If you are an energy tourist, like me, then you can make good money in ExxonMobil, Chevron, Occidental Petroleum etc by just understanding when in the cycle to invest, and when to divest. And the best way to do that is, you guessed it, stock charts.
Why is this? Well, if you look at $XOM fundamentals, you’ll learn nothing much about the direction of travel of the stock. Here’s the headlines up to and including Q2.
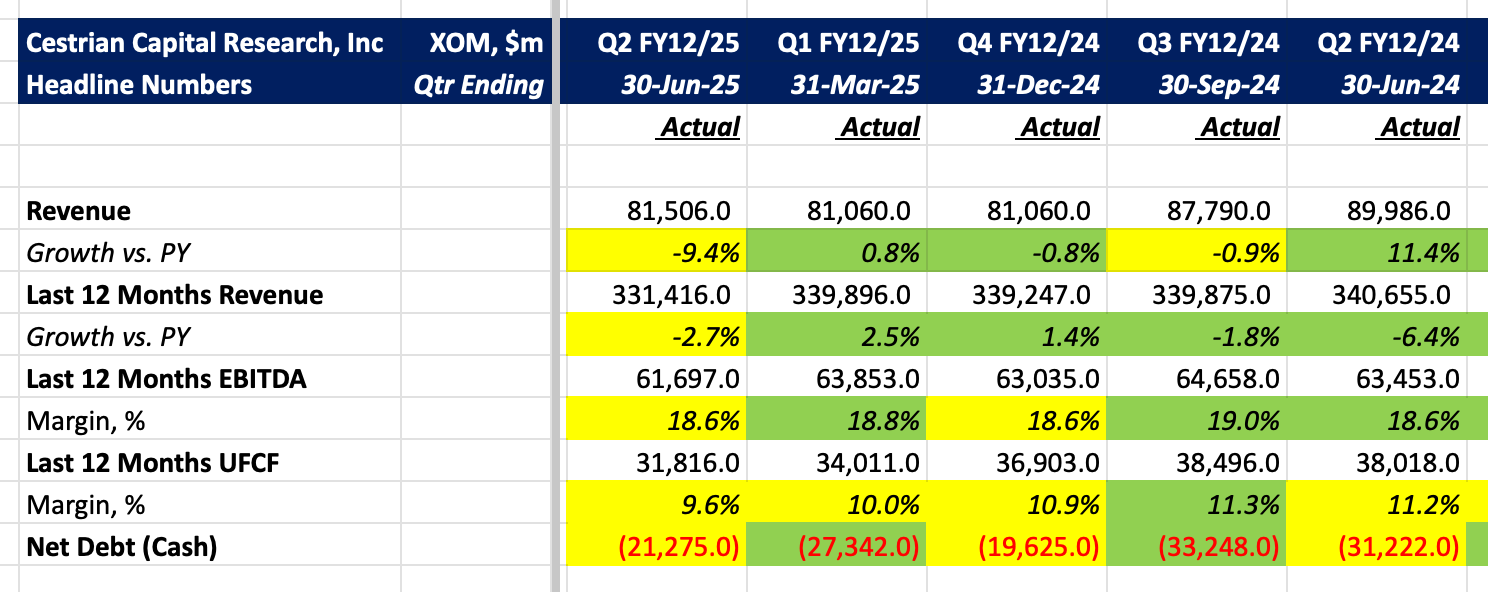
If you can work out from that which way the stock is going to go, congratulations, please join me on a podcast and you can explain to the rest of us mortals how it’s done.
Maybe more detail would help?
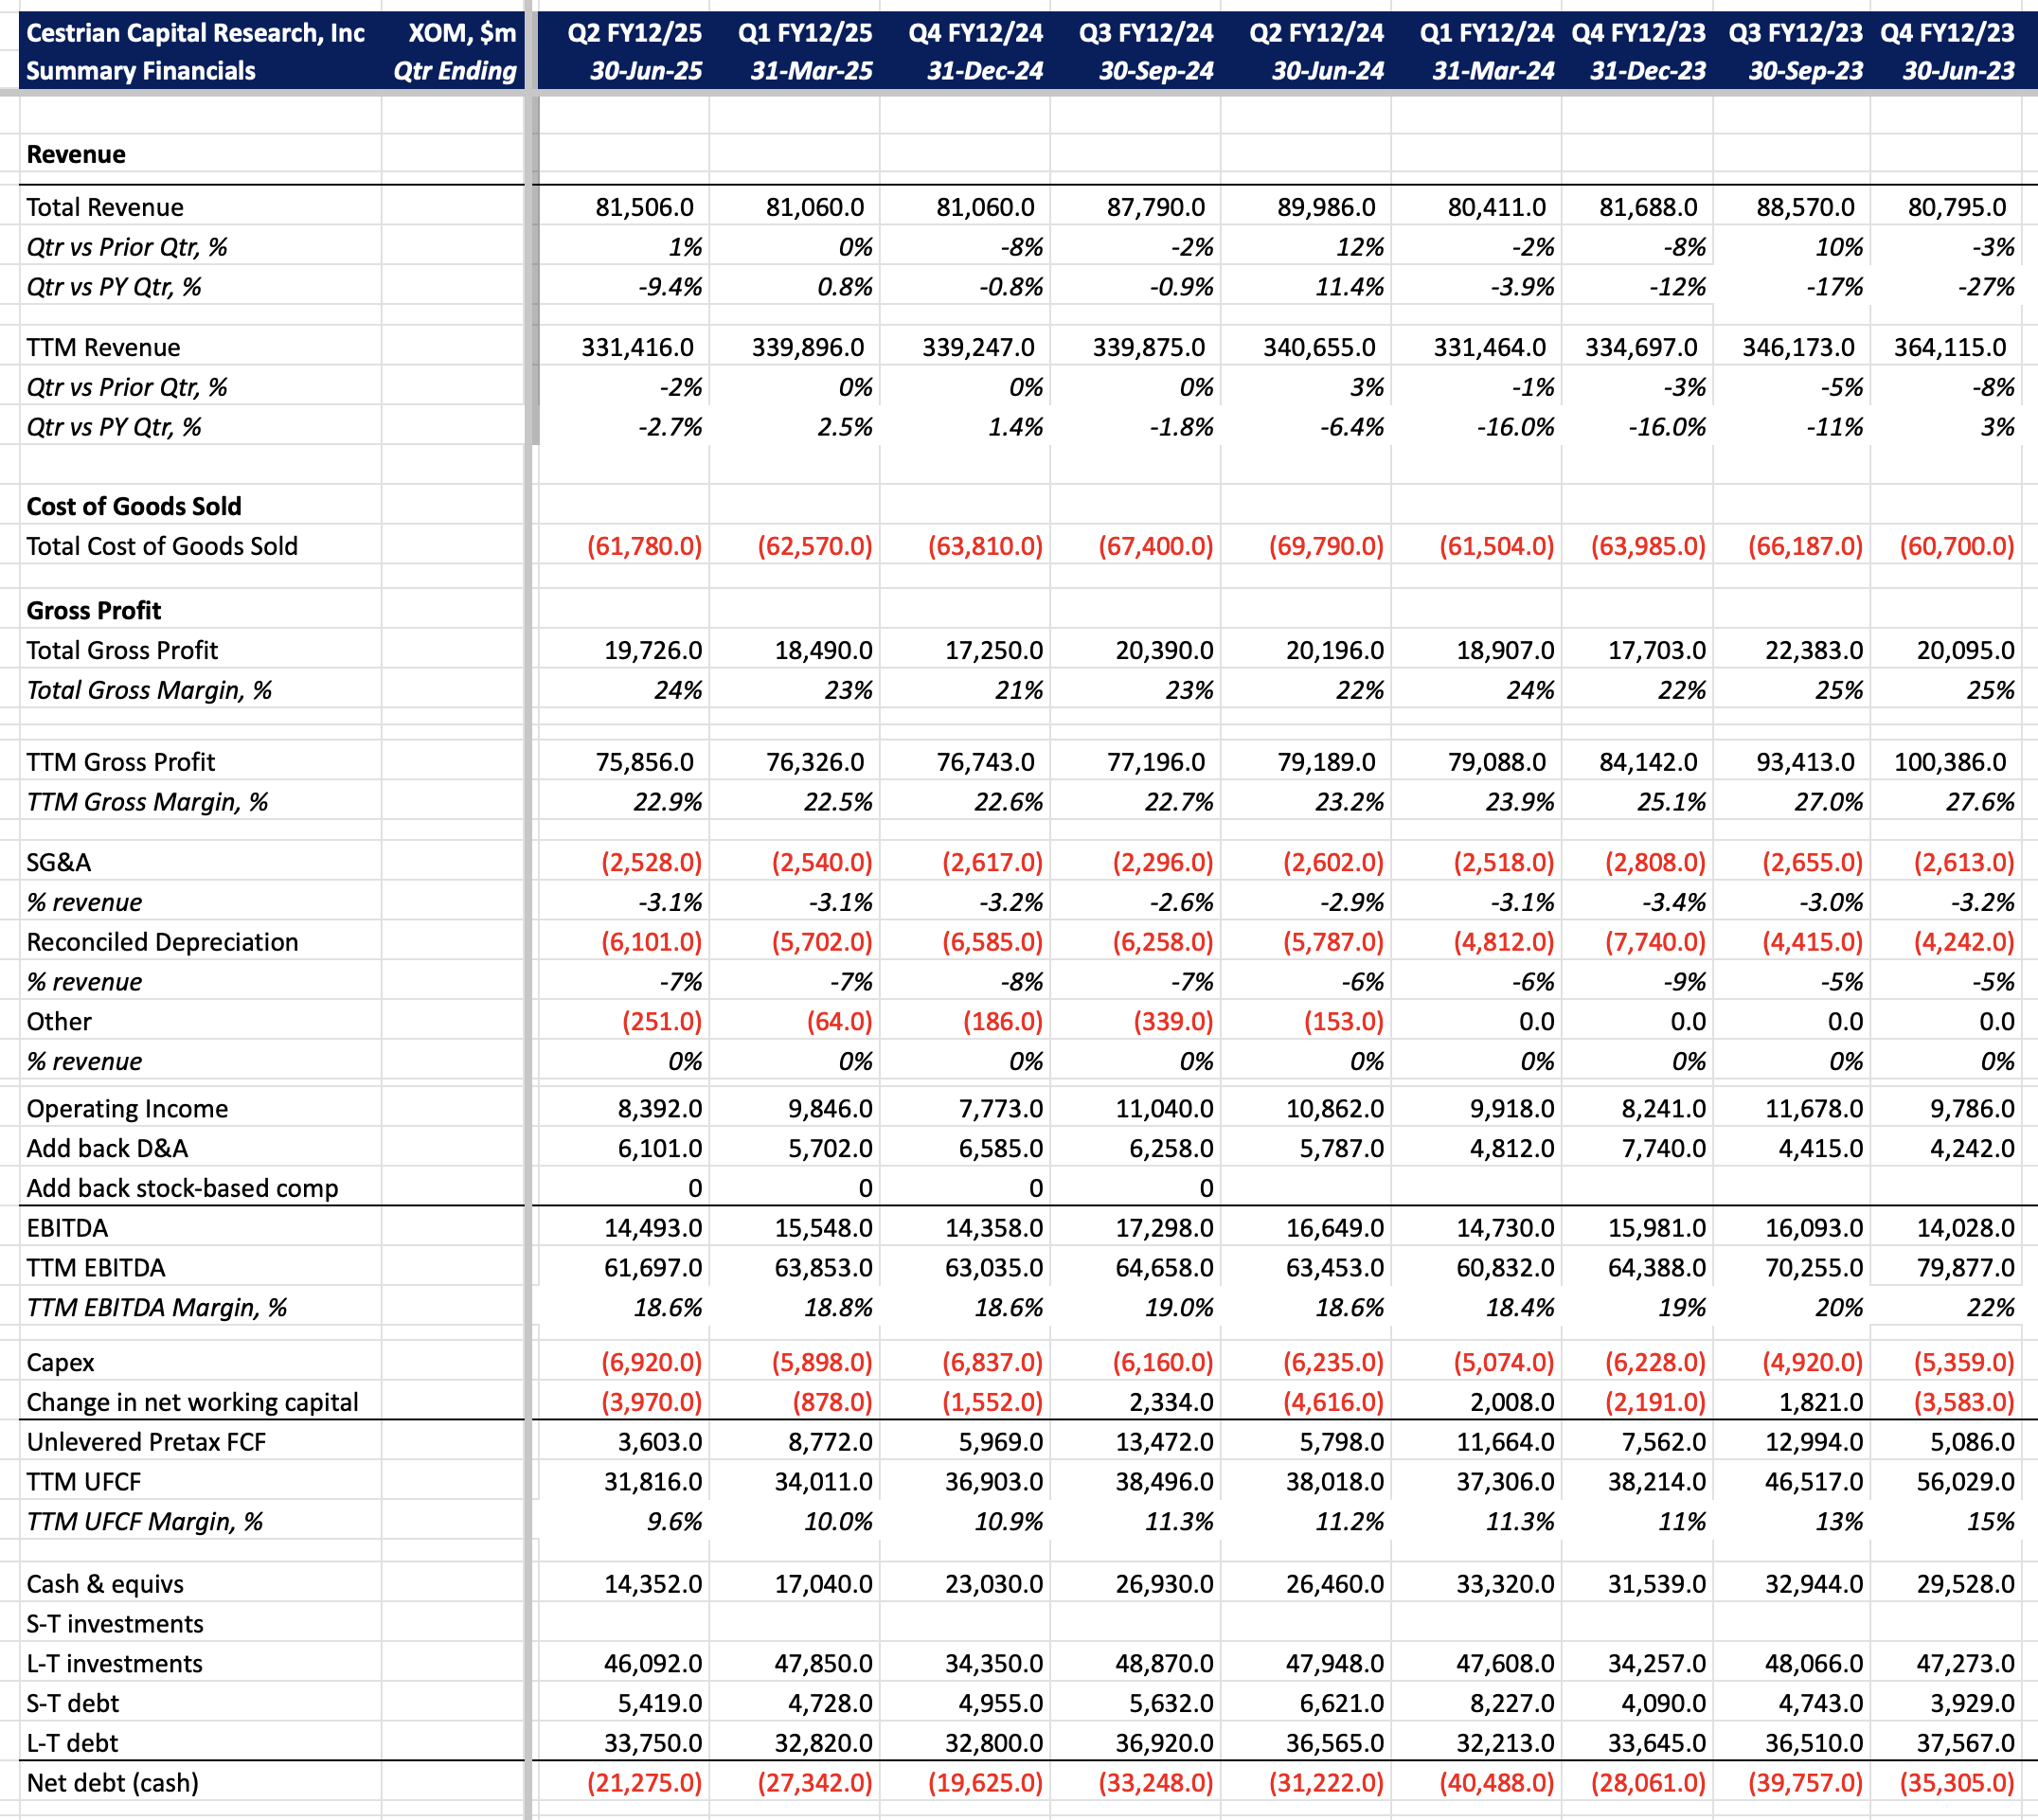
Hm. Nope.
Maybe valuation is helpful? Is the stock a buy, hold or sell on this?
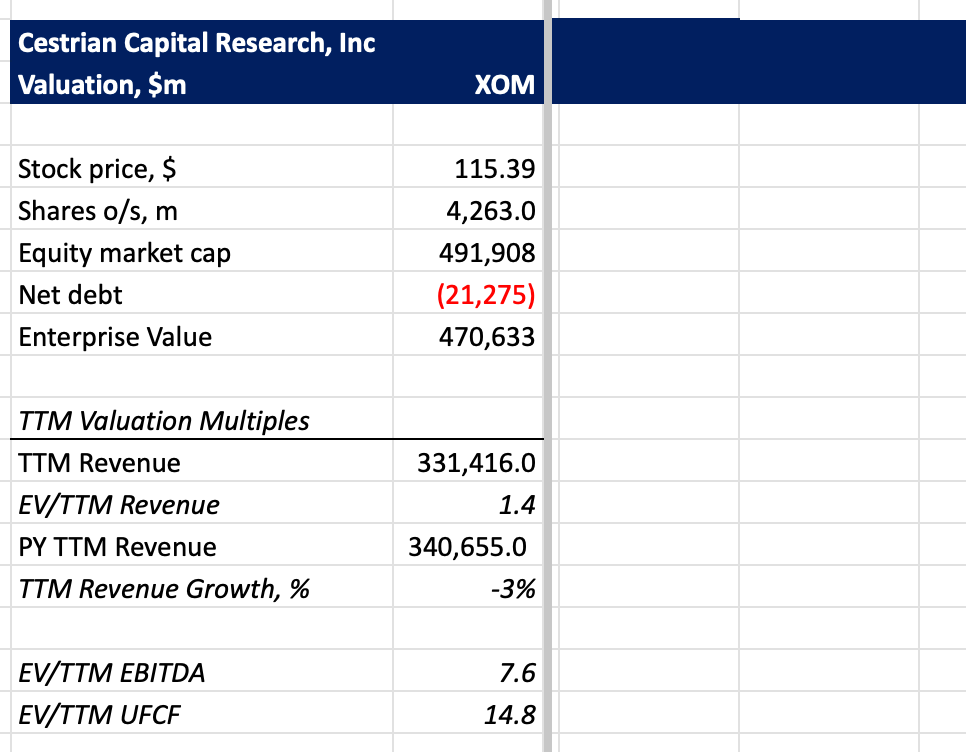
No idea.
What about dividends and buybacks and all that old-fashioned stuff that energy companies (oh, and Larry Ellison) like to do?
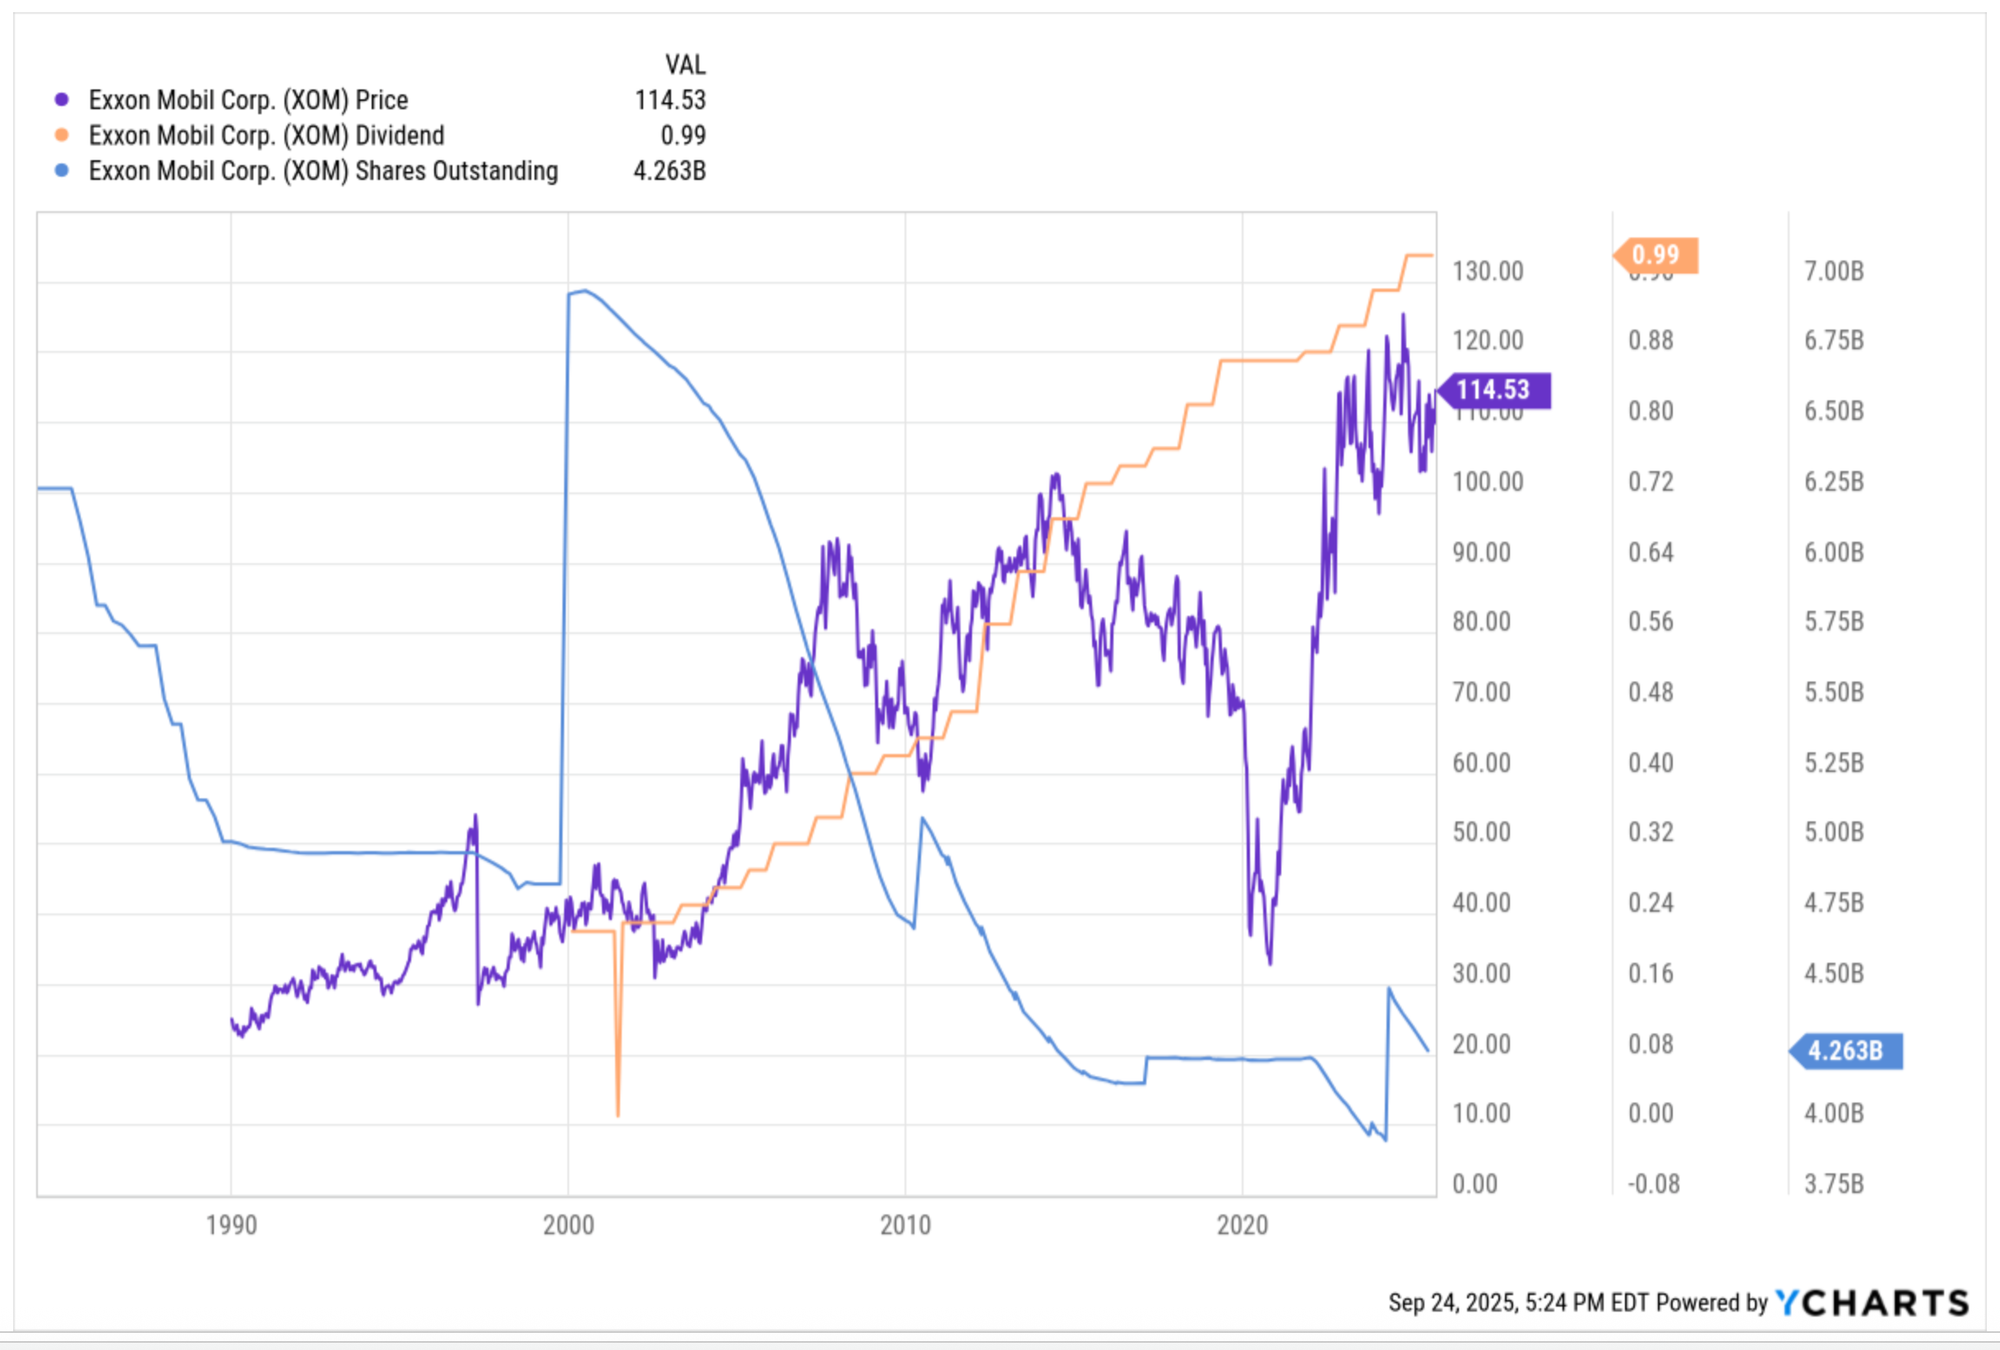
Same question. Can you project from that where the stock is going to go next? Me either.
So let’s turn to the stock chart, the One Truth To Unite Them All, just our old friends Price and Volume, and see what it tells us.