
FULL NO-PAYWALL NOTE: Market On Open, Friday 28 November

DISCLAIMER: This note is intended for US recipients only and, in particular, is not directed at, nor intended to be relied upon by any UK recipients. Any information or analysis in this note is not an offer to sell or the solicitation of an offer to buy any securities. Nothing in this note is intended to be investment advice and nor should it be relied upon to make investment decisions. Read our full disclaimer, here.
Too Much Gravy?
by Alex King, CEO, Cestrian Capital Research, Inc
Today this note is paywall-free, in full. As our Inner Circle subscribers know, we publish this daily to give you our best analysis of the S&P500, Nasdaq-100, Dow Jones-30, oil, gold, bonds, Bitcoin, Ether, volatility, and key sector ETFs.
The market right now is in the process of a fragile recovery from the selldown across multiple asset classes in October and November. As to the cause of the selldown I would observe the usual “more supply than demand”. But I suspect that at its core is an effort by large institutions - actually funds in particular, not so much your old-line quietly-accumulating insurance business - to reset the record for 2025. Many funds found themselves on unstable footing during the aftermath of Liberation Day. The market in my opinion massively over-reacted in April, reading the mutual tariffs as likely to become actual policy, rather than a negotating stance. Whilst funds wound on hedges and went long only carefully, risk-loving retail investors pounced on the April lows and enjoyed wonderful returns from the highest of high beta names that ran up rapidly into October. The poorer quality the asset, the closer to vertical the price trajectory during this time. This led to the inevitable posting of YTD returns by Robinhooders everywhere. A red rag to a bull of course. Cue a brutal take-down in these names and in crypto, wherein many will have been humbled, turning huge gains into modest gains or, worse, liquidated losses. And now funds have a few short weeks to run it back up into year end to reclaim their rightful positions as Masters of the Universe rather than mere single-digit postoors.
There was an accumulation of short hedges beginning September - below I’ve used the example of SQQQ, a 3x inverse Nasdaq ETF, but the same pattern can be seen in the S&P and in key sectors like semiconductor - which would have provided a cushion against the November dump. The lows were marked when these hedges returned to the level at which the accumulation of said hedges started.
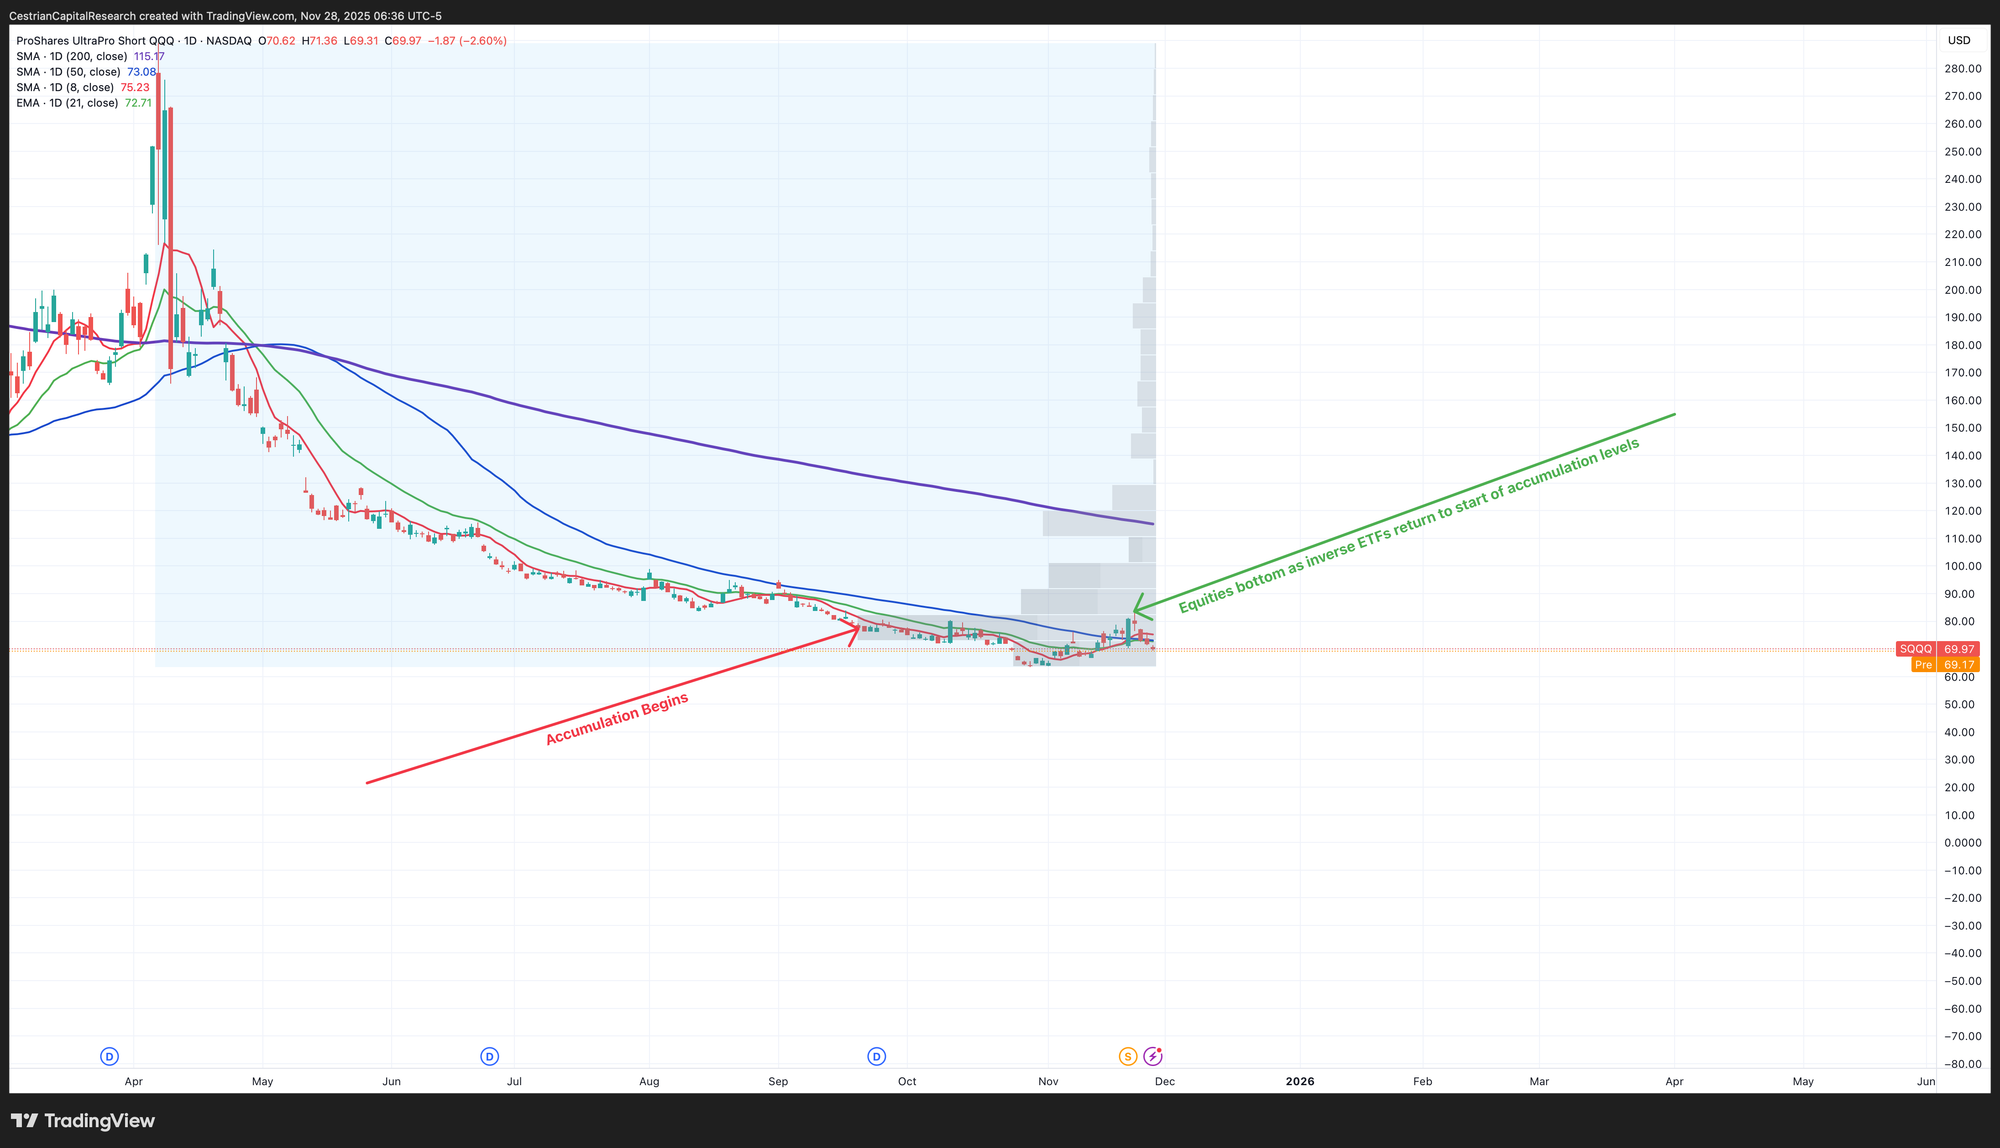
In other words it looks very much like bigs were well insulated ahead of time, profited or at least didn’t suffer in the dump, released capital from those shorts and now have capital available to deploy on the way back up. Reports from the prime brokerage desks at Goldman Sachs and others - indicating deleveraging of fund positions in the last week or so - are supportive of the notion of those short hedges being sold so that margin capacity is available to go net long.
My expectation therefore is for a climb into year end in equities, and the charts below seem to support that idea. 2026? Well, we’ll deal with that when we get there. Top-callers abound at present; but most have been present since the beginning of this bull phase in Q1 2023 so as always one should let price tell the story - not storytellers.
Black Friday Offers
We have two Black Friday offers available until the close of Monday.
Cestrian Inner Circle 6Yr Extended.
The cheapest way to get our best work. 30% discount. Here for independent investors, and here for investment professionals. If you’re an existing Inner Circle member, contact me personally at alex.king@cestriancapital.com so that we can give you a further reduced price by deducting any remaining value you have in your annual or monthly subscription.
YX Insights.
If you’ve yet to sign up for any of the algorithmic signal services or indeed the full-service research package from my colleague Yimin Xu, you really should consider it. You can read all about his work here, including the superb user reviews. Until the close of Monday you can sign up for your first YXI service at a 33% discount to rack rate - and a full 40% discount on any subsequent YXI service. If you are already a member of any of Yimin’s services then right now is a great time to add a second or third.
Please note that the Commodities Algo service is excluded from this offer as it is already running at a 50% launch pricing discount, which ends 1 Jan.
Email us at minerva@cestriancapital.com or use this contact form, tell us which YXI services you want to add, and we’ll get it done for you.
OK. Let’s get to work.
US 10-Year Yield
A break down through that recent low of 3.95% would be market-critical I think. Bullish for equities in the short term (because it implies an abundance of cheaper money with which to buy stocks on margin) and for bonds of course.

Equity Volatility
A drop through 17 would be the critical bullish break.
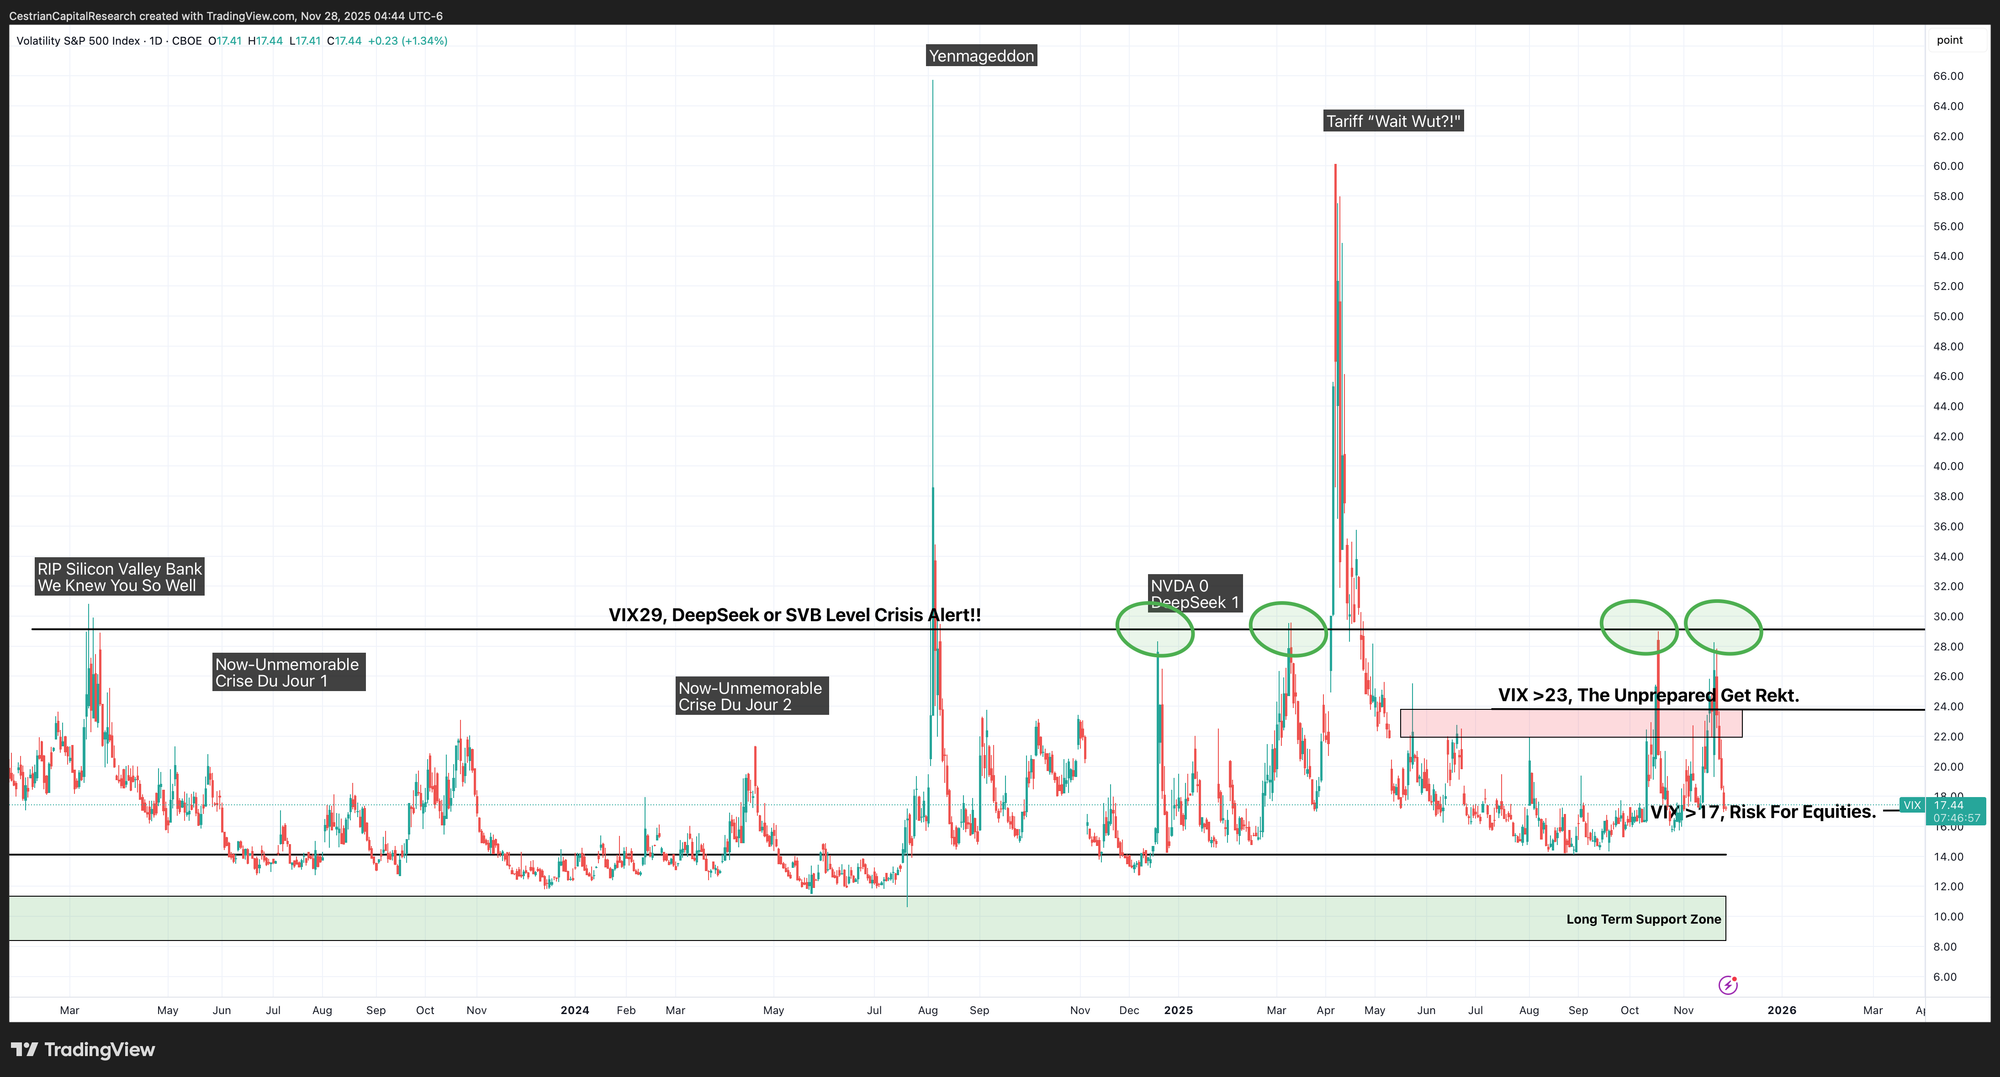
Disclosure: No position in any Vix-based securities.
Longer-Term Treasury Bonds (TLT / TMF)
No change. Bullish.
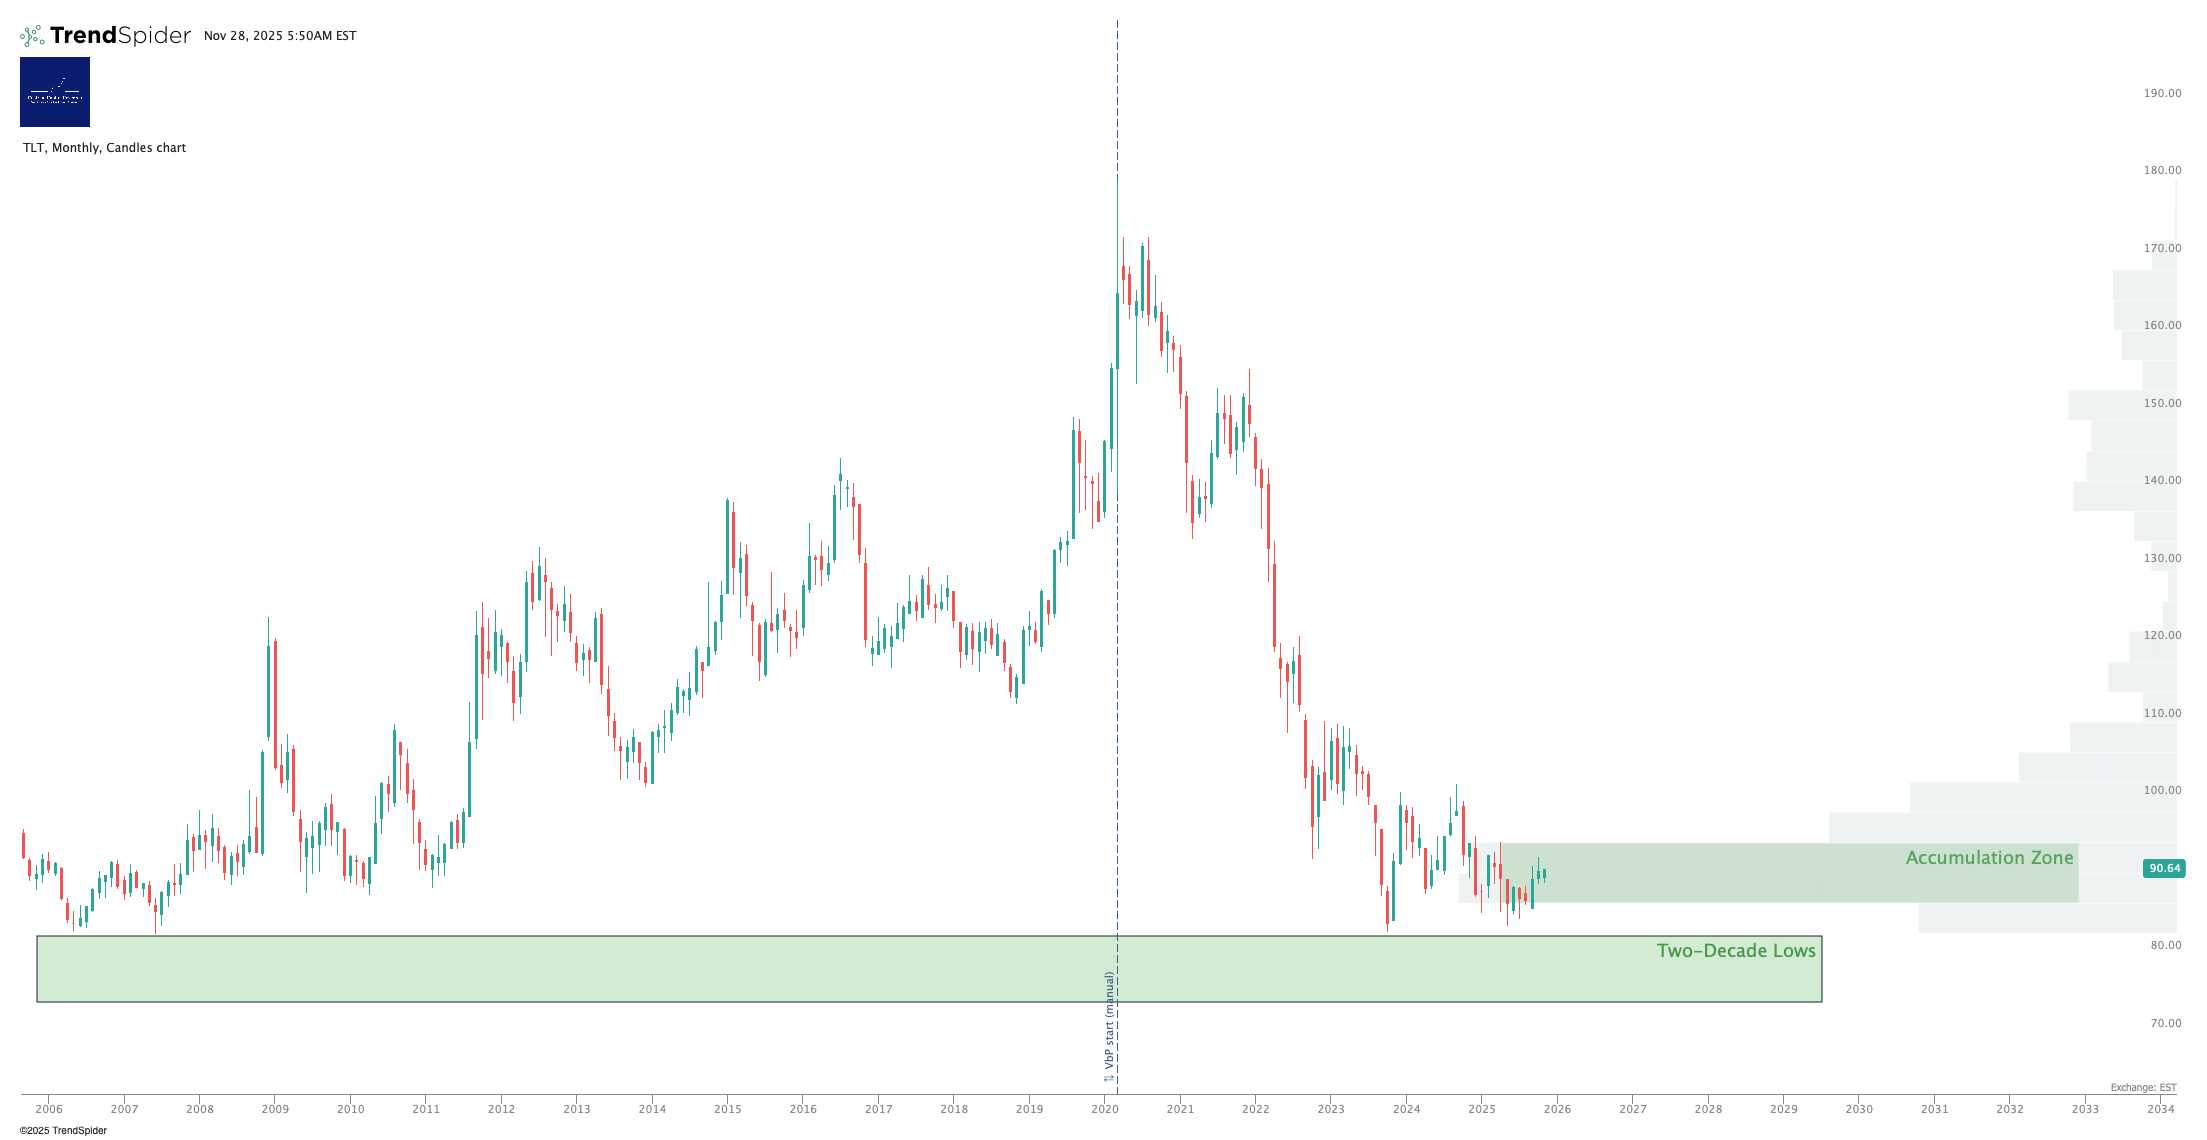
Watching for that near-term Wave 2 down and in particular where it stops - above the “Support” line shown below is bullish.

Note - Leveraged ETF. Read the fund documentation if you are considering using this instrument.
The levered ETFs like TMF can be traded nicely by following the underlying charts. If, for instance, TLT bottoms in a Wave 2 low and starts to break up into a Wave 3, TMF can be used with a stop close by in order to get some accelerated gain potential as TLT climbs the Wave 3.

Disclosure: I am unhedged long $TLT and $DLTA (an EU UCITS TLT proxy).
Gold
Still looking like a Wave 3 up.
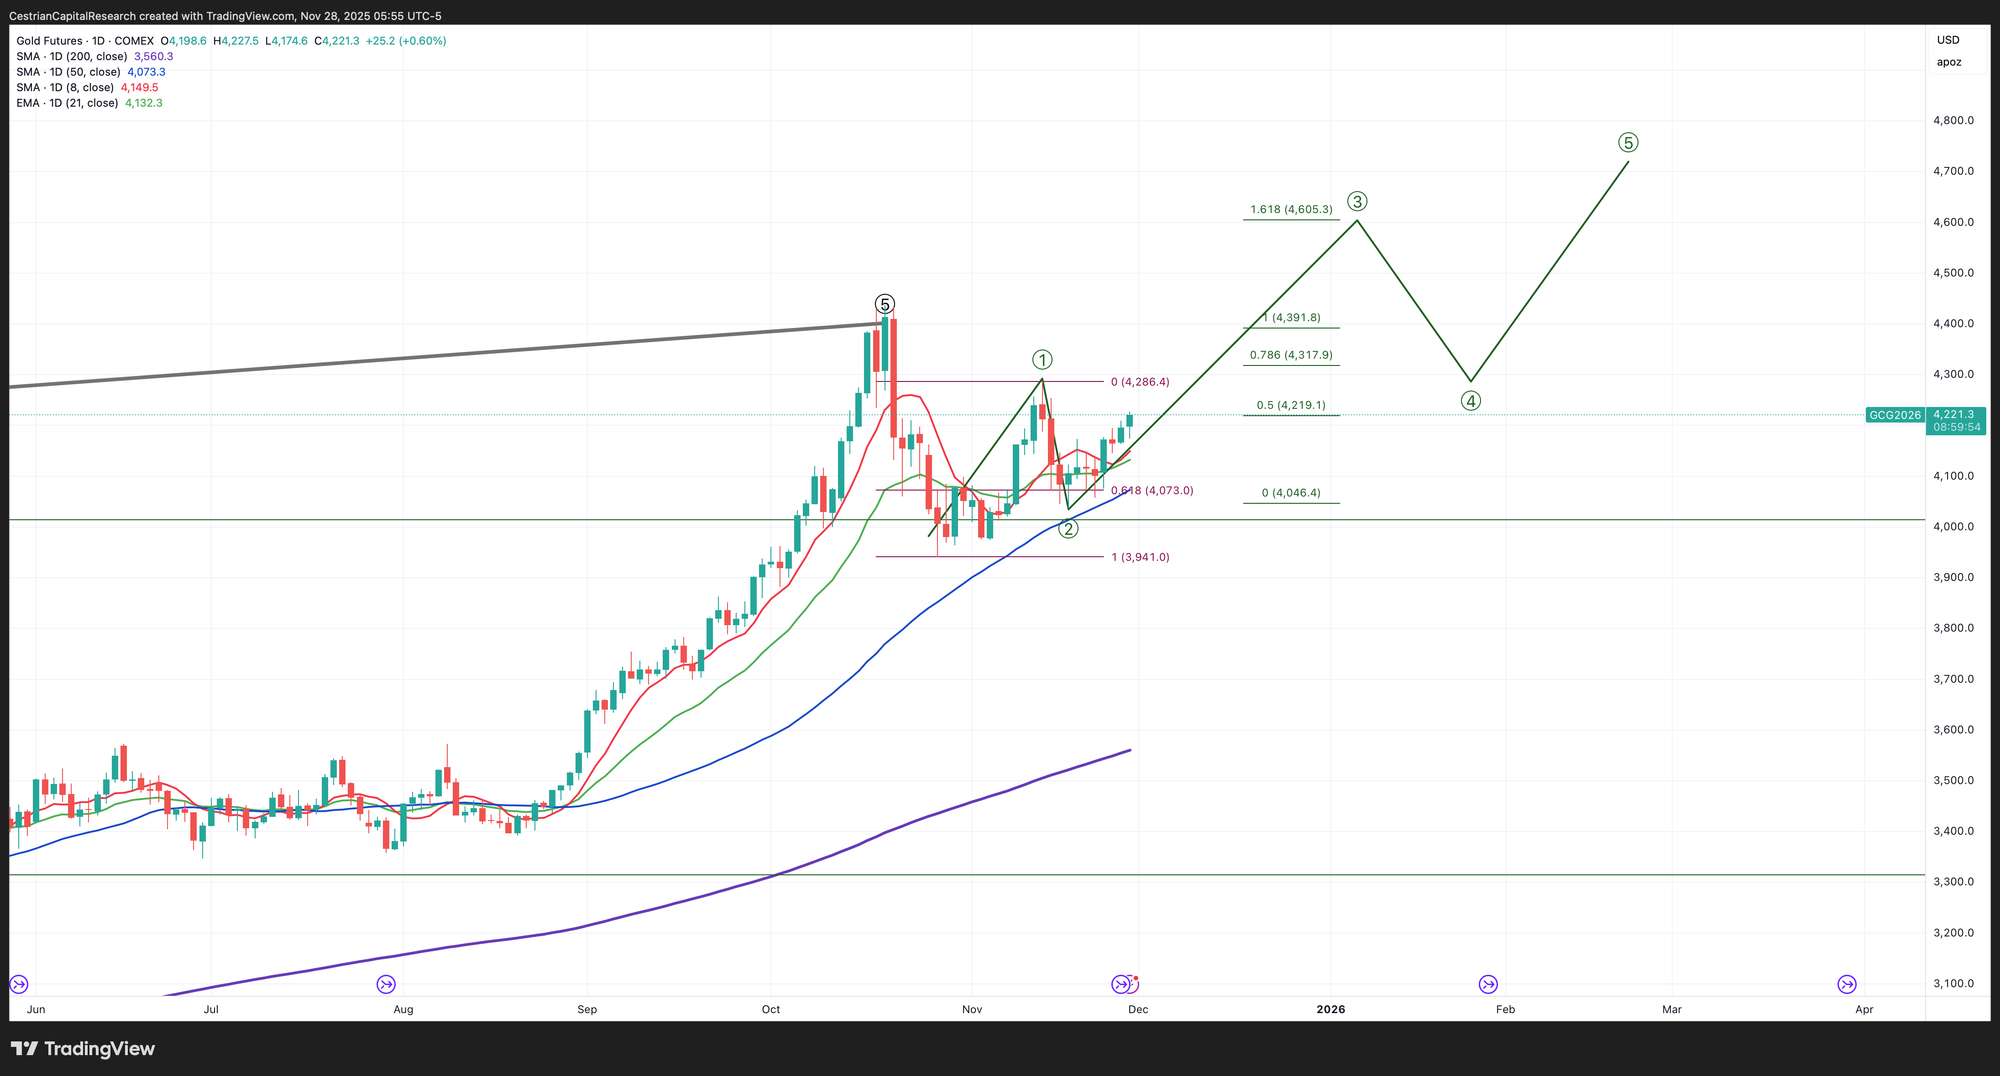
Disclosure: Positioned in gold according to our Commodities Algo Service.
Bitcoin
For commentary and a longer-term set of charts on Bitcoin and Ether, read last week’s no-paywall note What On Earth Is Happening In Crypto?.
$93.6k is the 21-day EMA, which is a critical test for this recovery. A rejection there is bad news.
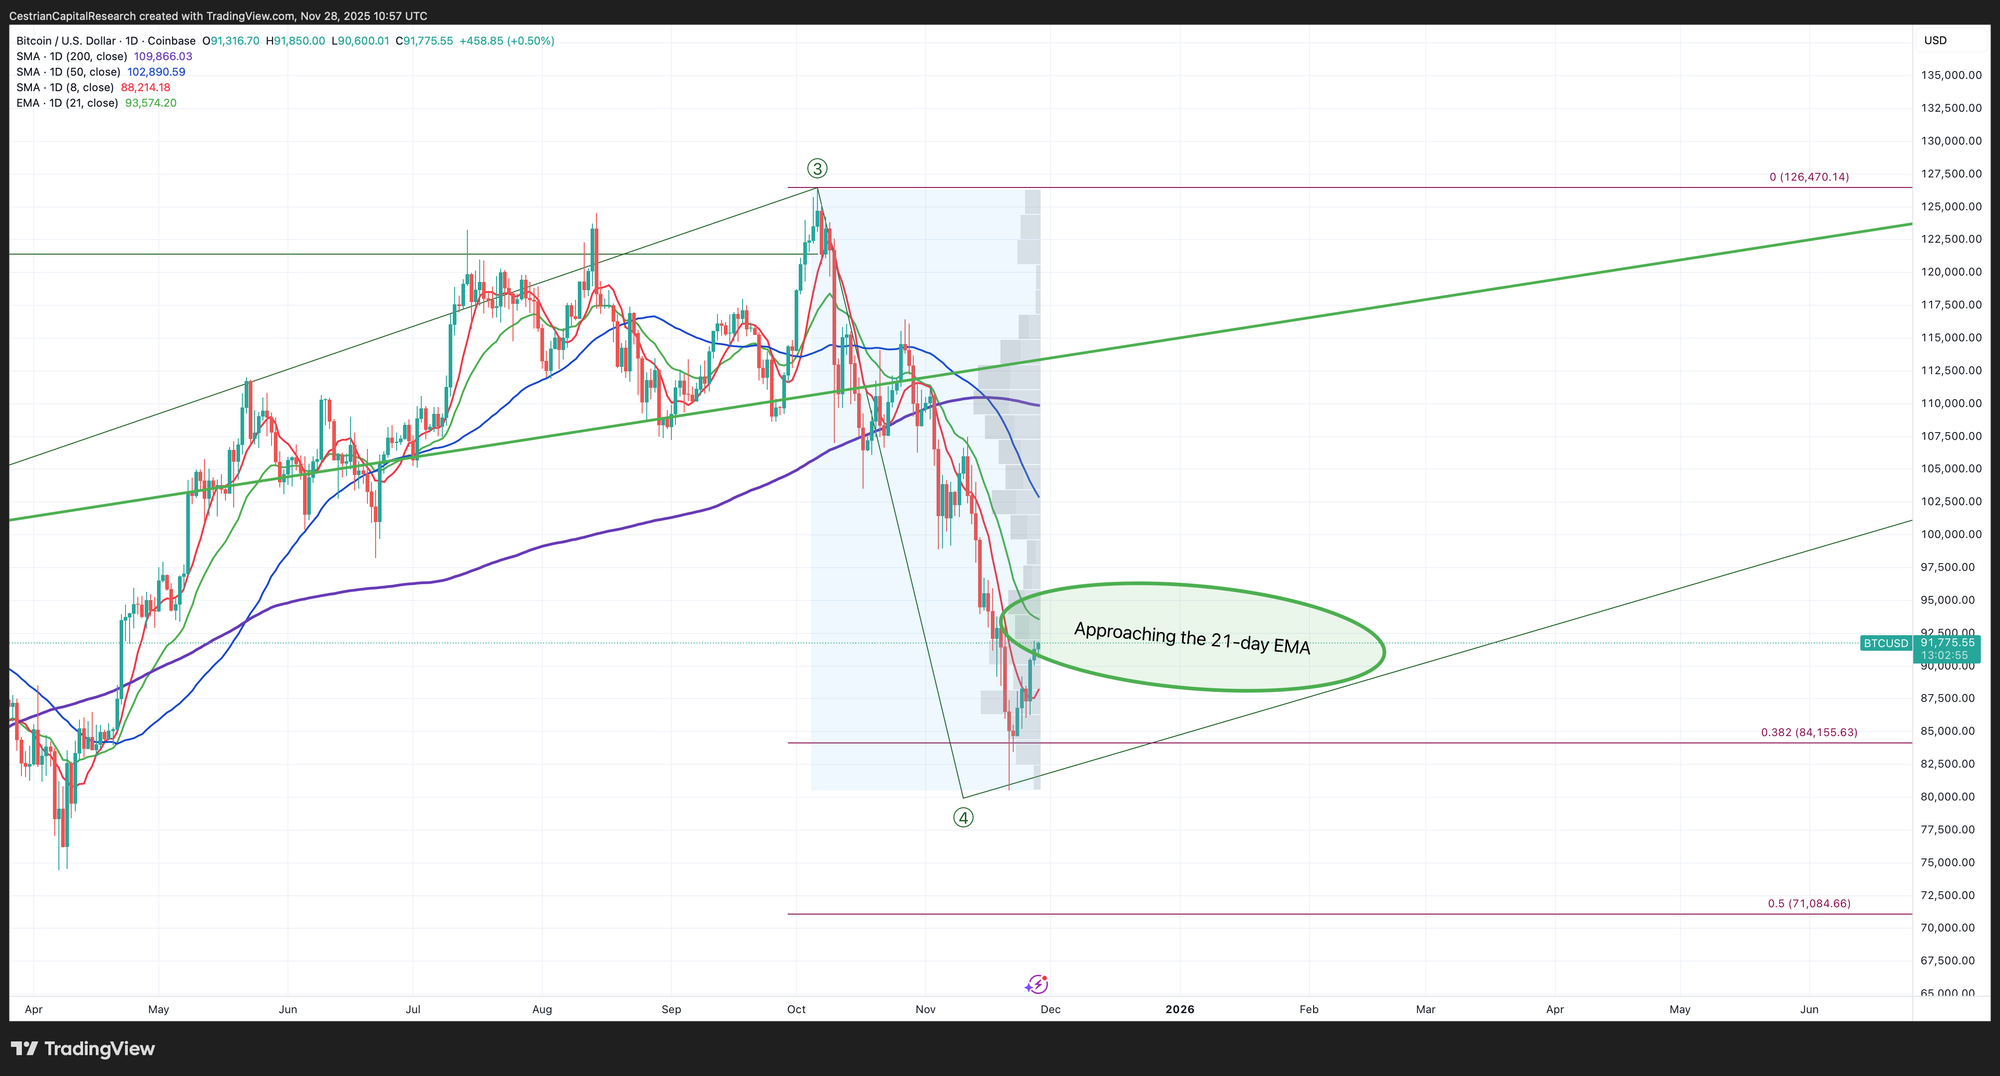
Disclosure: I am long $IBIT.
Ether
Also approaching its own 21-day EMA.
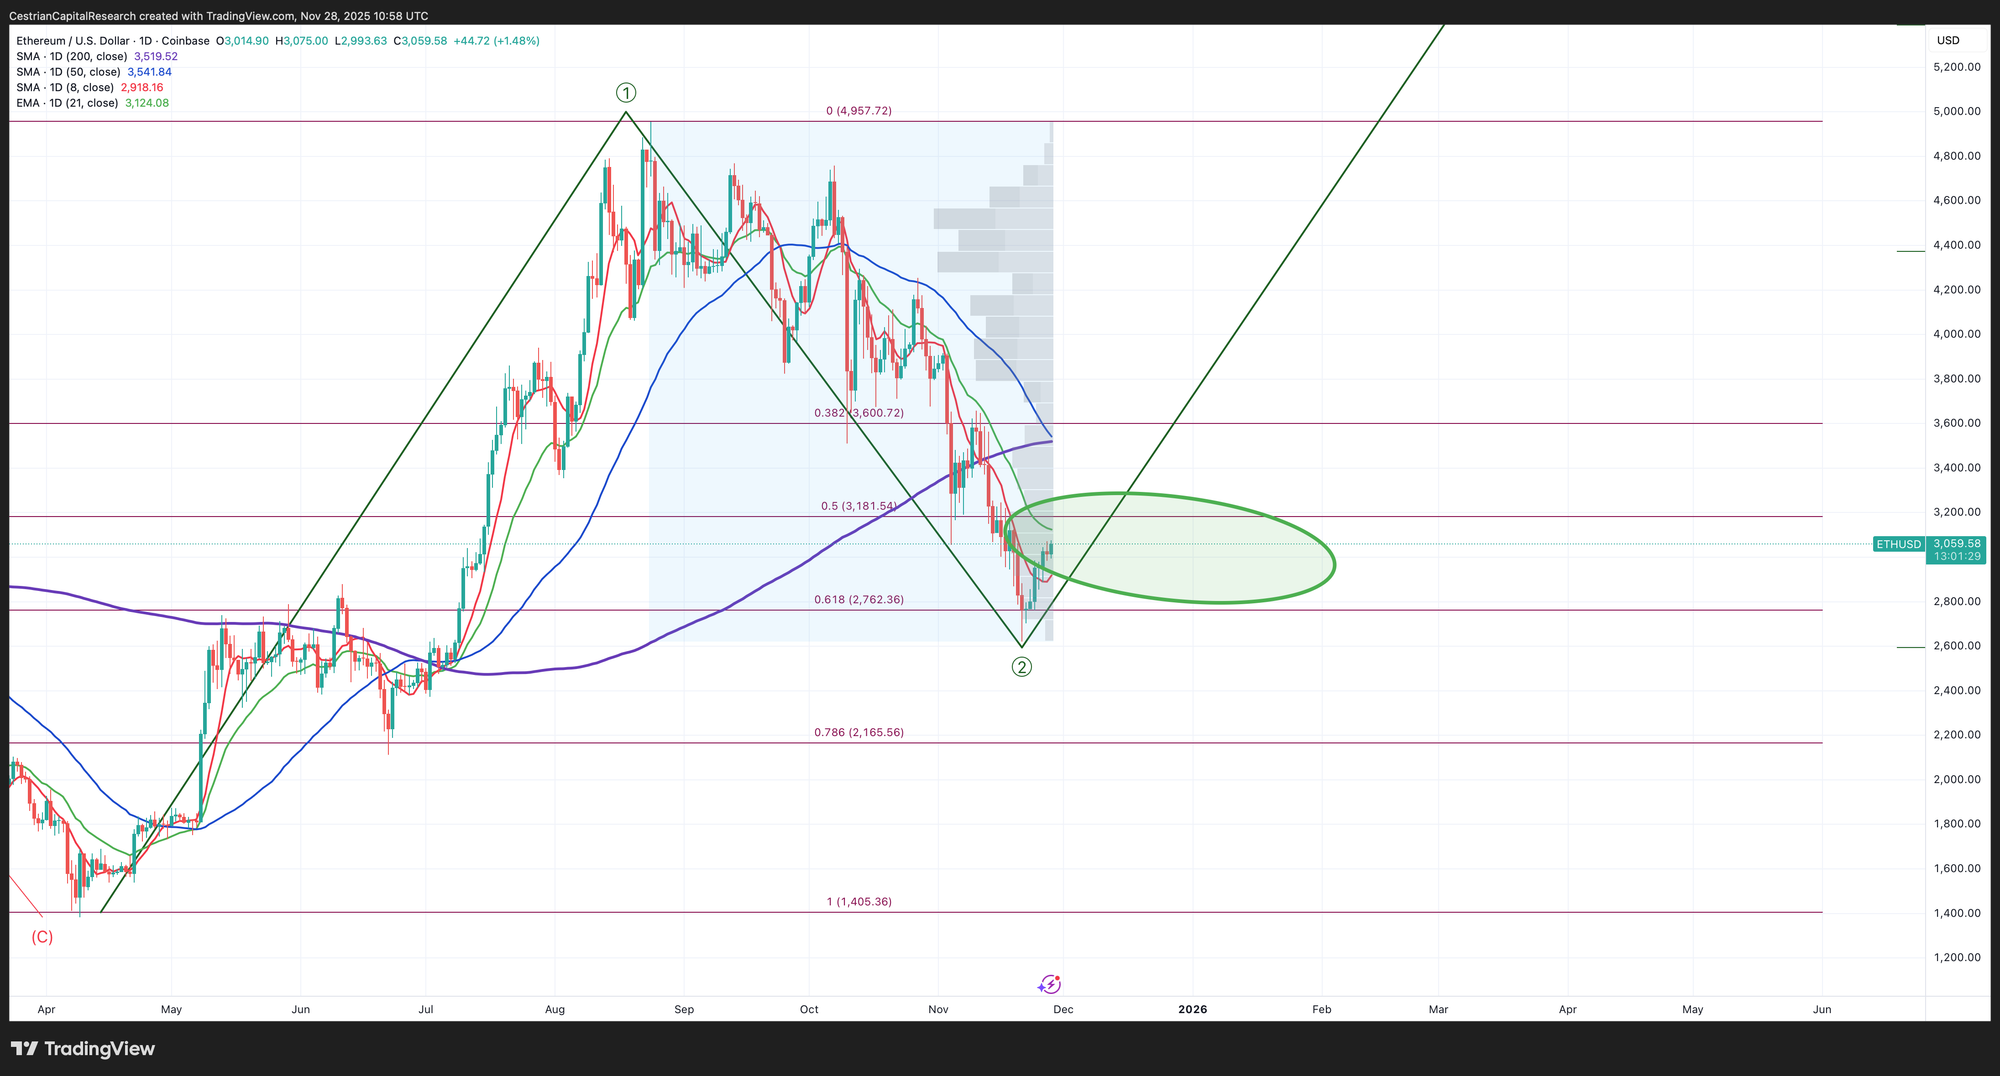
Disclosure - Long $ETHA and others in the Ether complex.
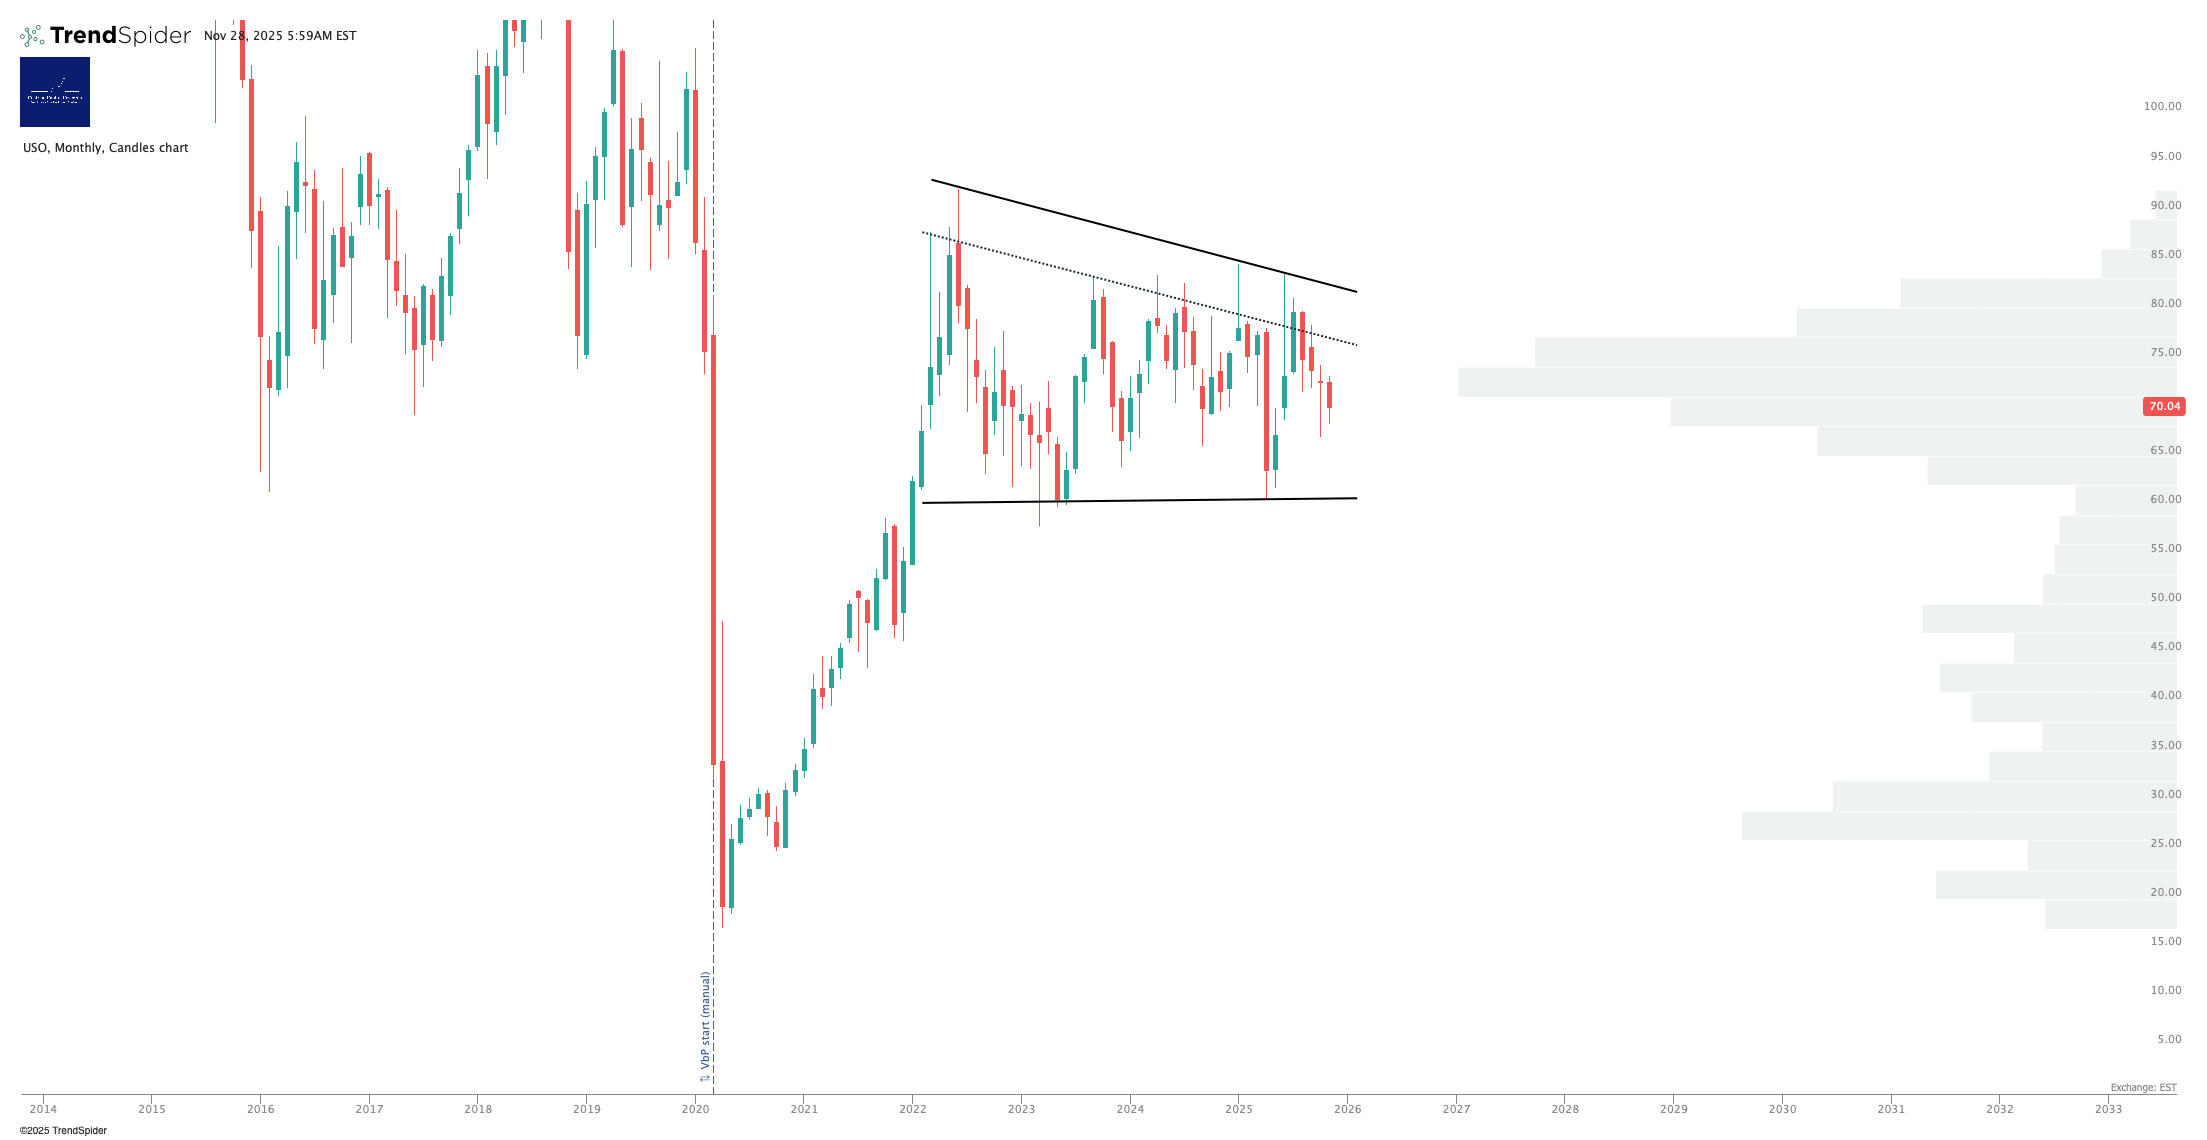
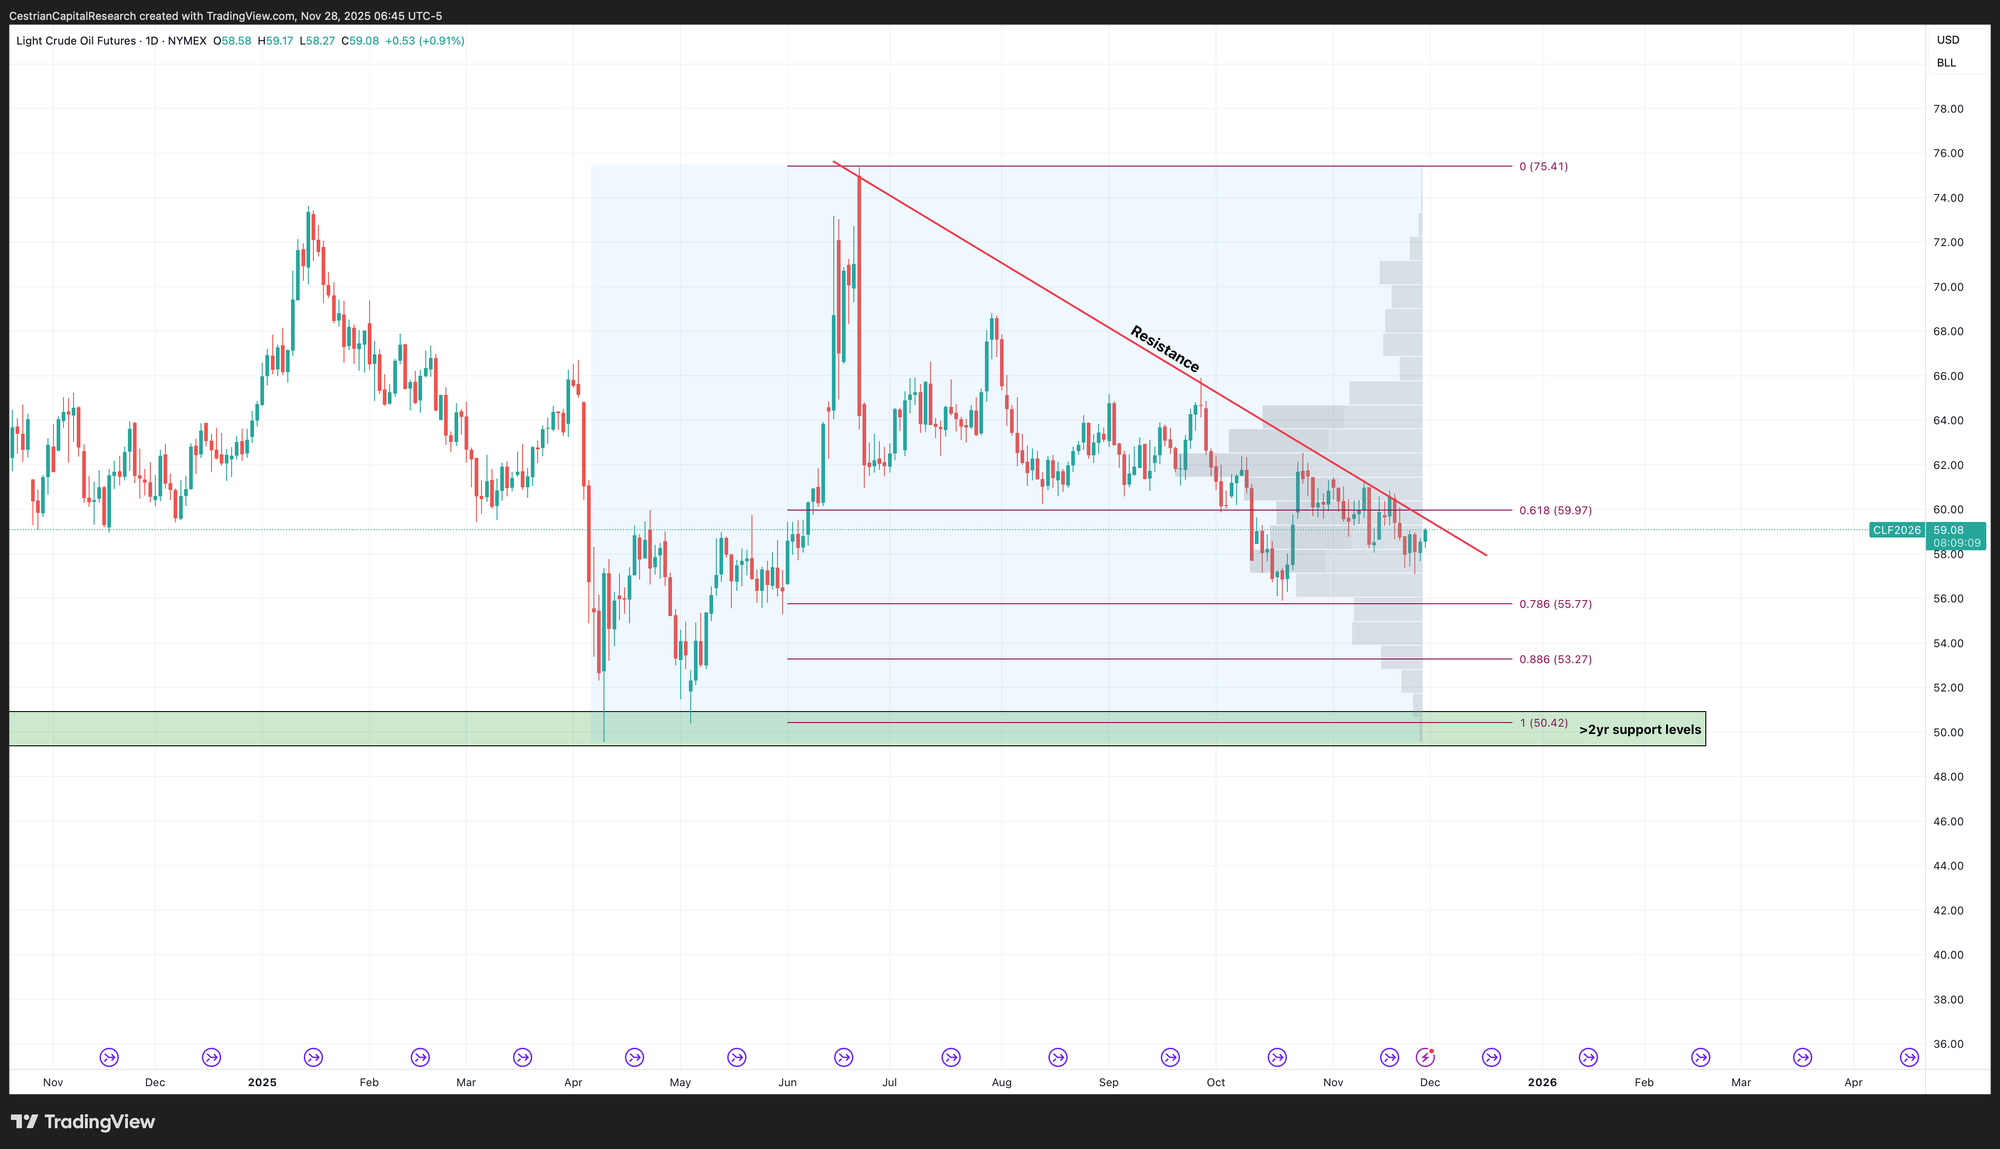
Oil (USO / WTI / UCO)
Continues to be weak.
Approaching that downward-sloping resistance line. A break above it would be meaningful.
2x Levered Long (UCO) / Short (SCO)
Note - Leveraged ETF. Read the fund documentation if you are considering using this instrument.
UCO holding over support and approaching the 8-day SMA. Weak until it gets up and over that 8-day.
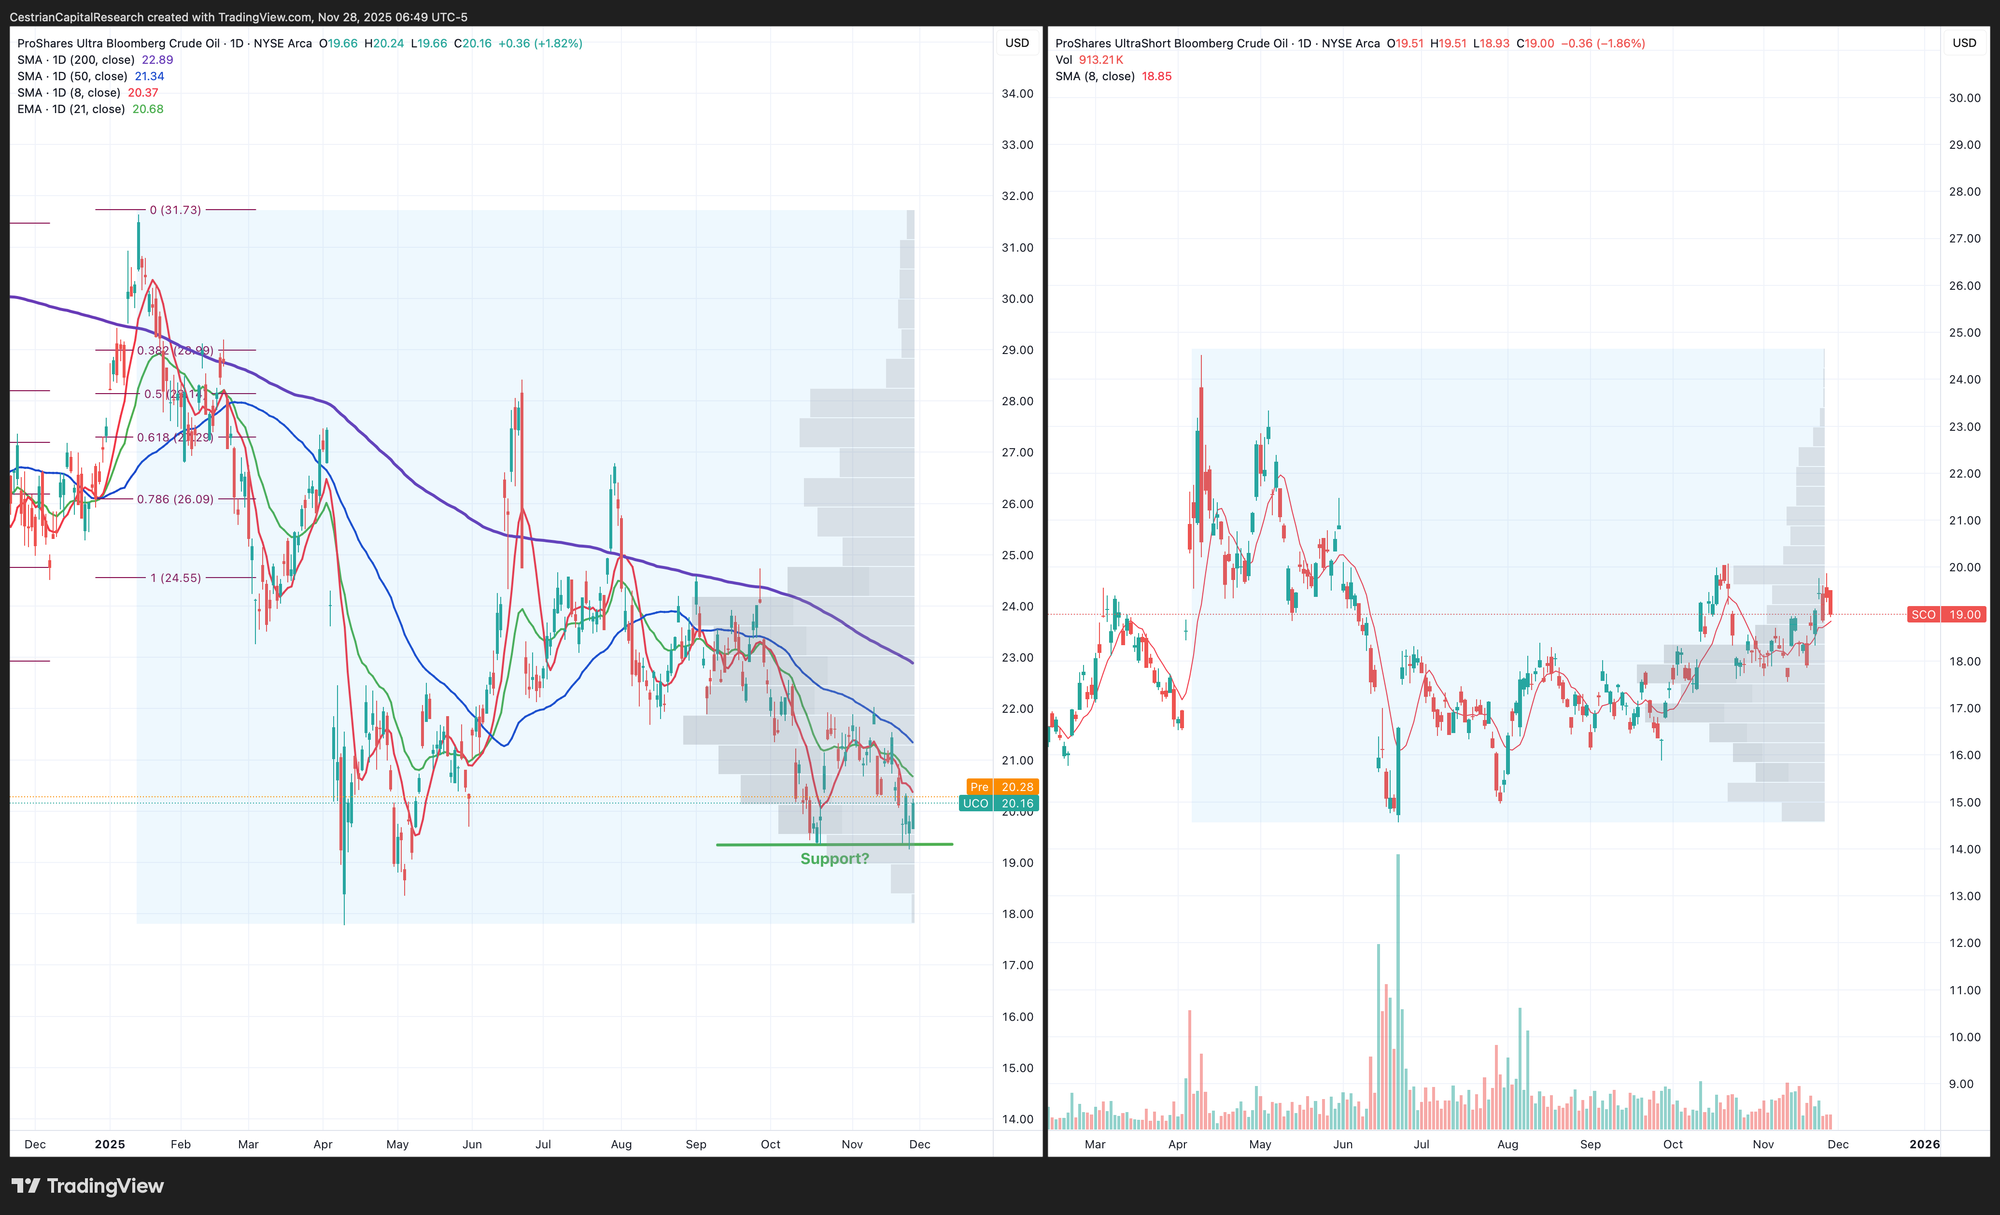
Disclosure: I am positioned in oil per our Commodities Algo Service.
S&P500 / SPY / UPRO
Almost back to October’s closing levels now.
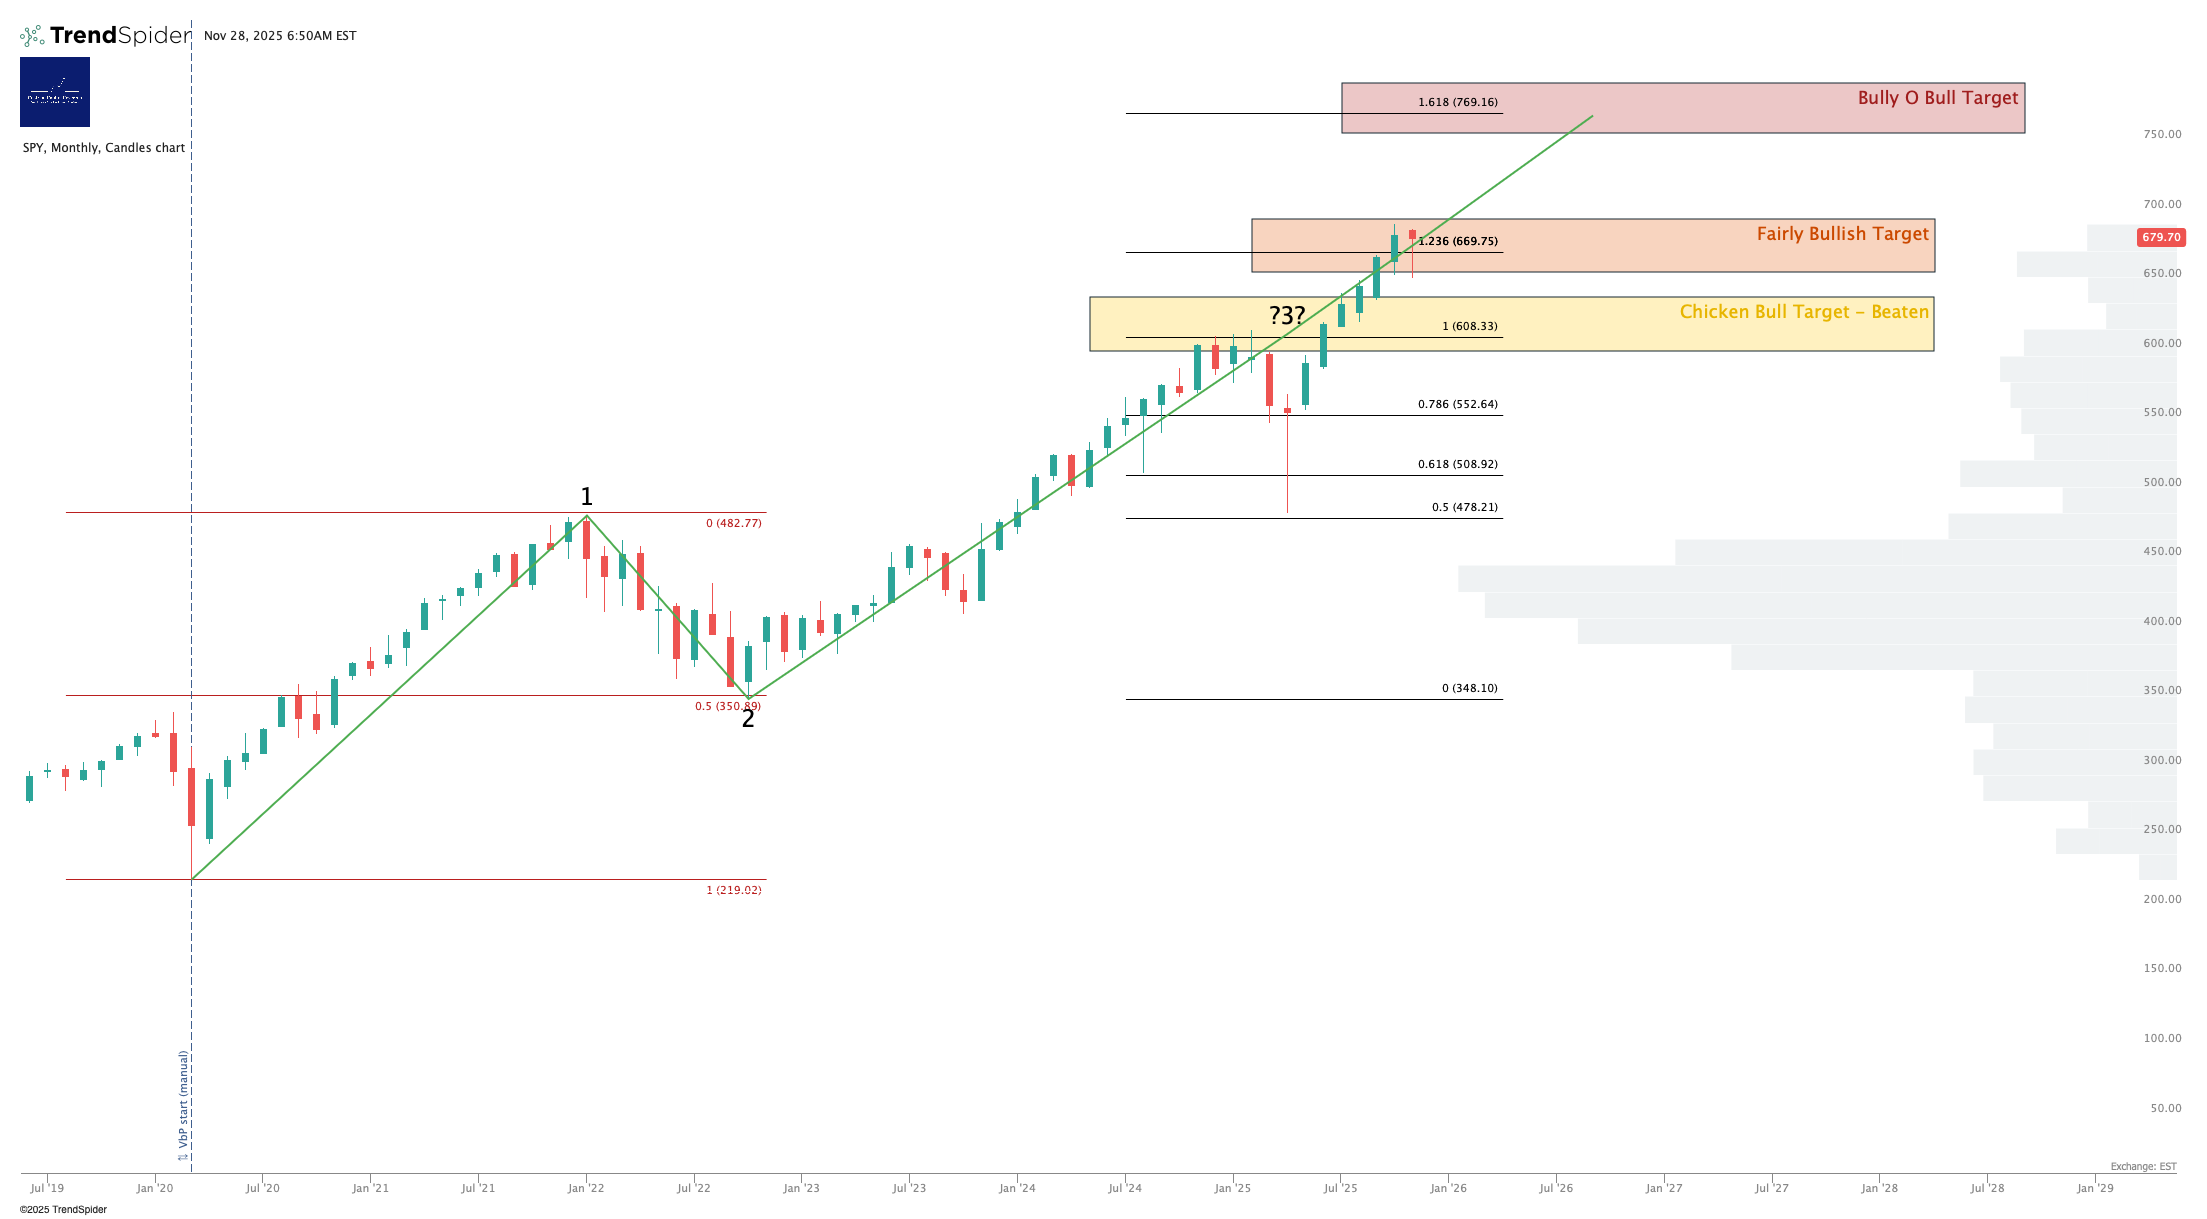
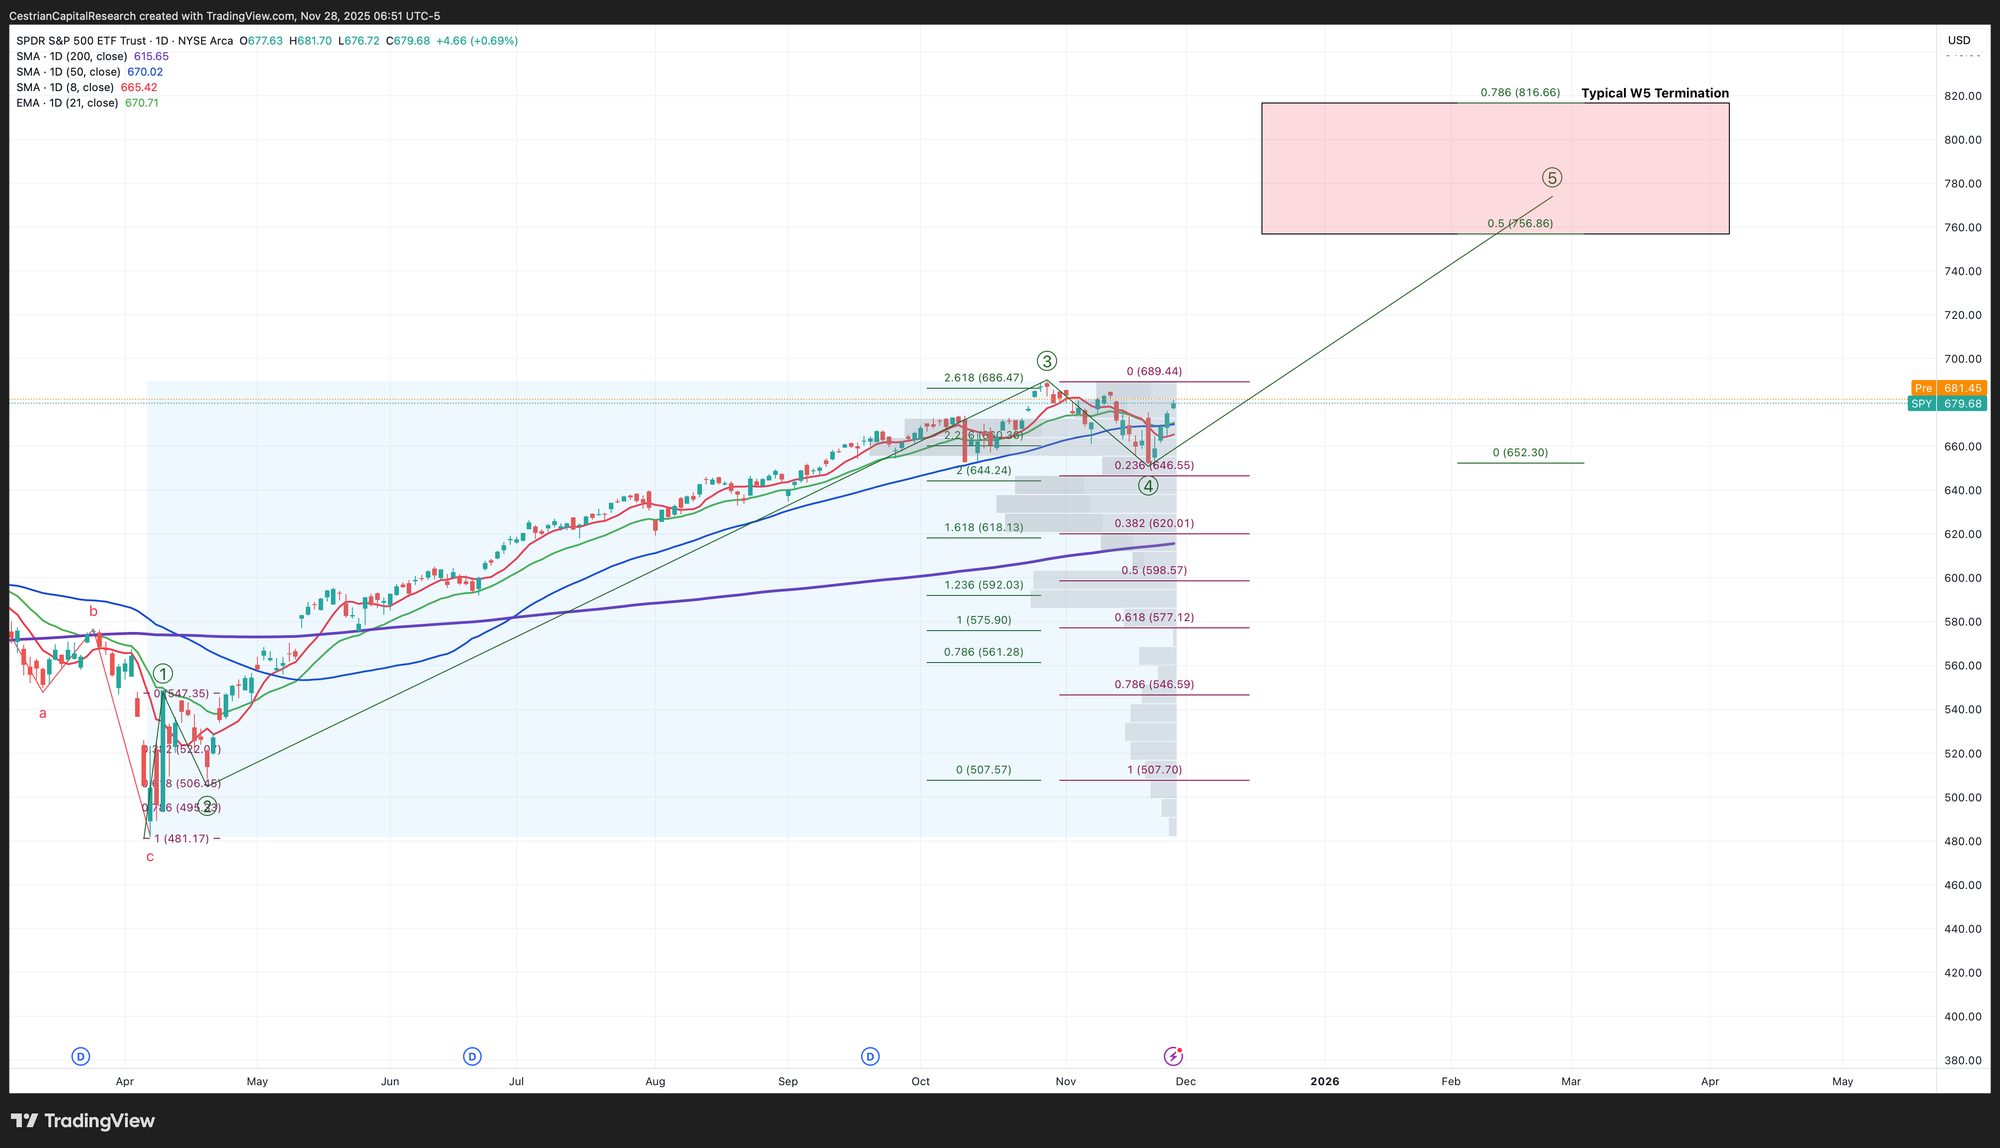
3x Levered Long / Short ETF - UPRO, SPXU
Note - Leveraged ETF. Read the fund documentation if you are considering using this instrument.

Disclosure: I am long $IUSA, long $SPY, and long SPY puts for December expiry ie. net long the S&P.
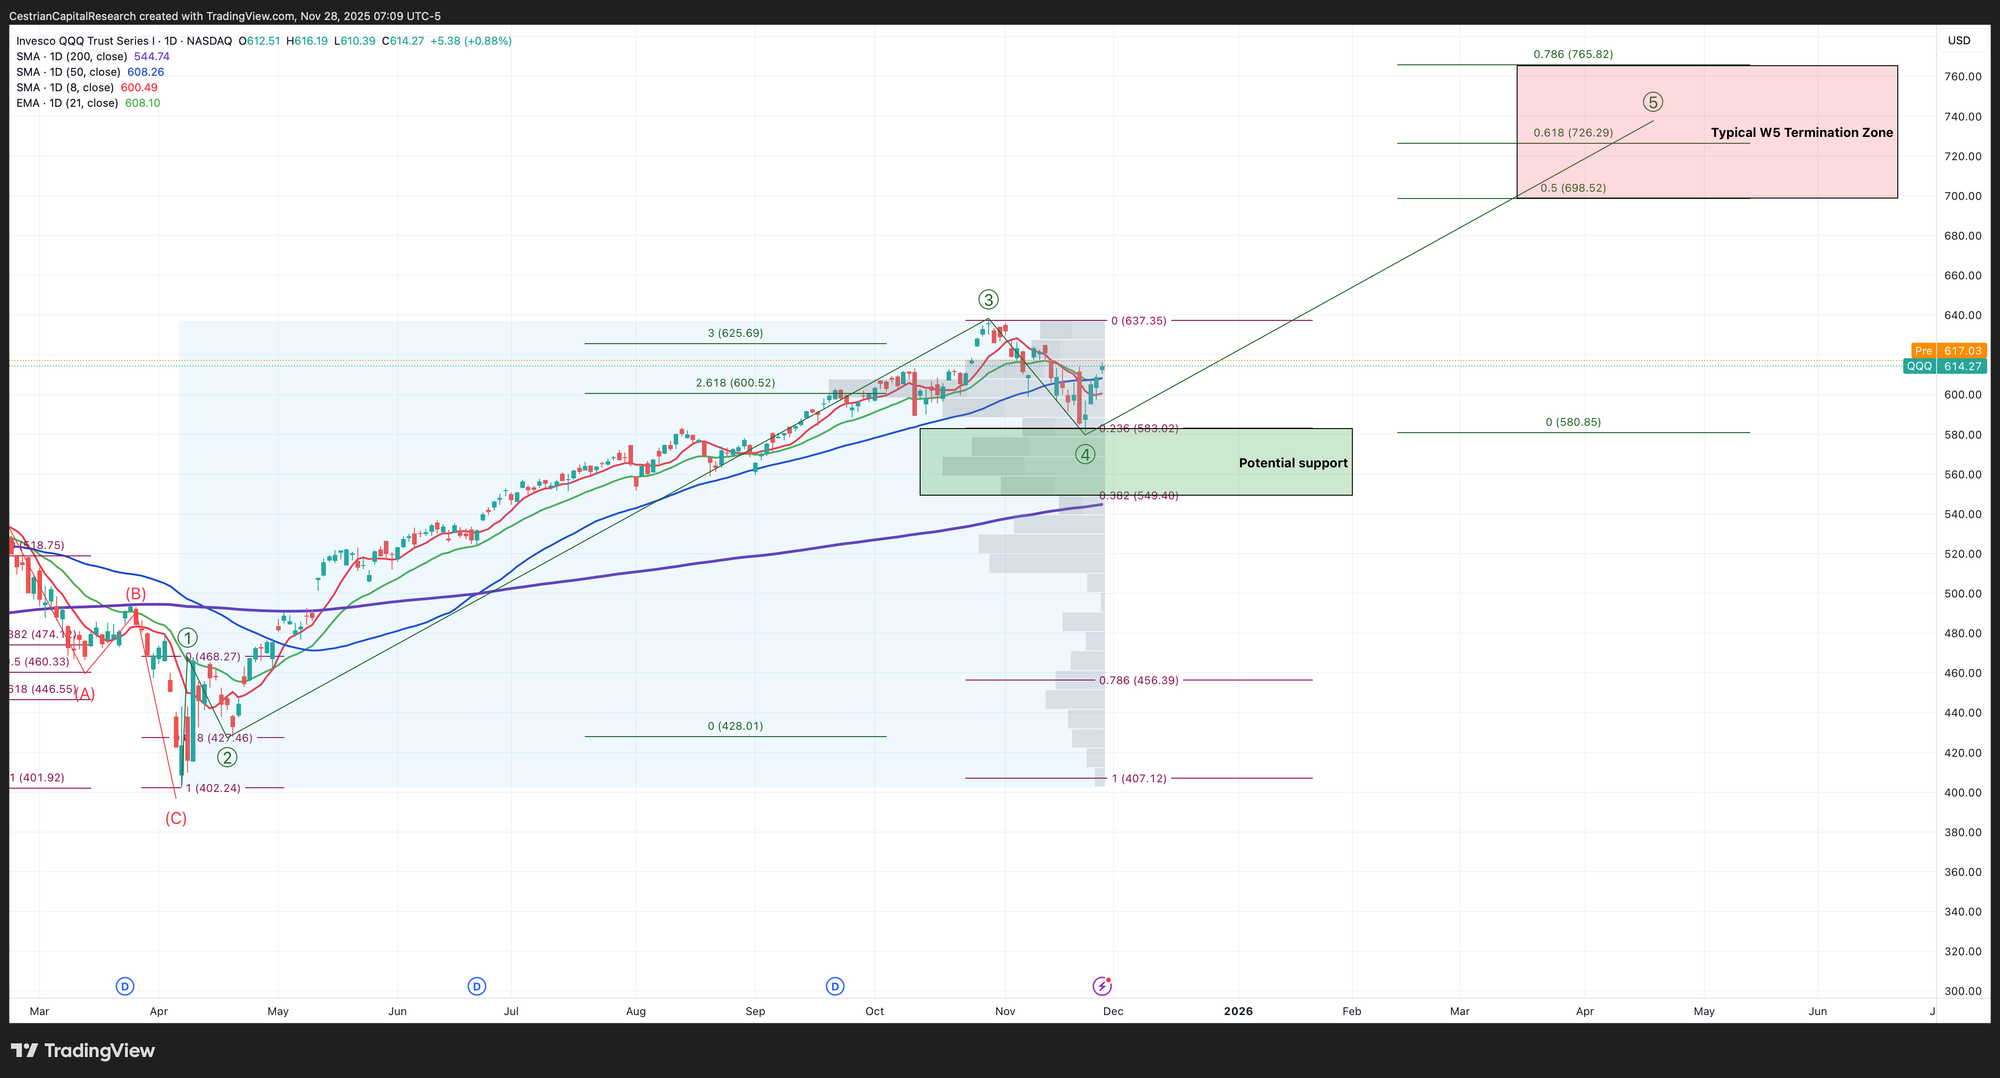
Nasdaq-100 / QQQ / TQQQ
Here’s the two cases we’re now tracking. “Blow-Off Top” is the notion that equities have one more move up yet, a Wave 5 fuelled by liquidity and FOMO, to be followed by a material correction sometime in 2026. “Longer Term Bull Case” sees any new high as a Wave 3 high to be followed by a modest correction then a final Wave 5 high. This is a useful lens I think.
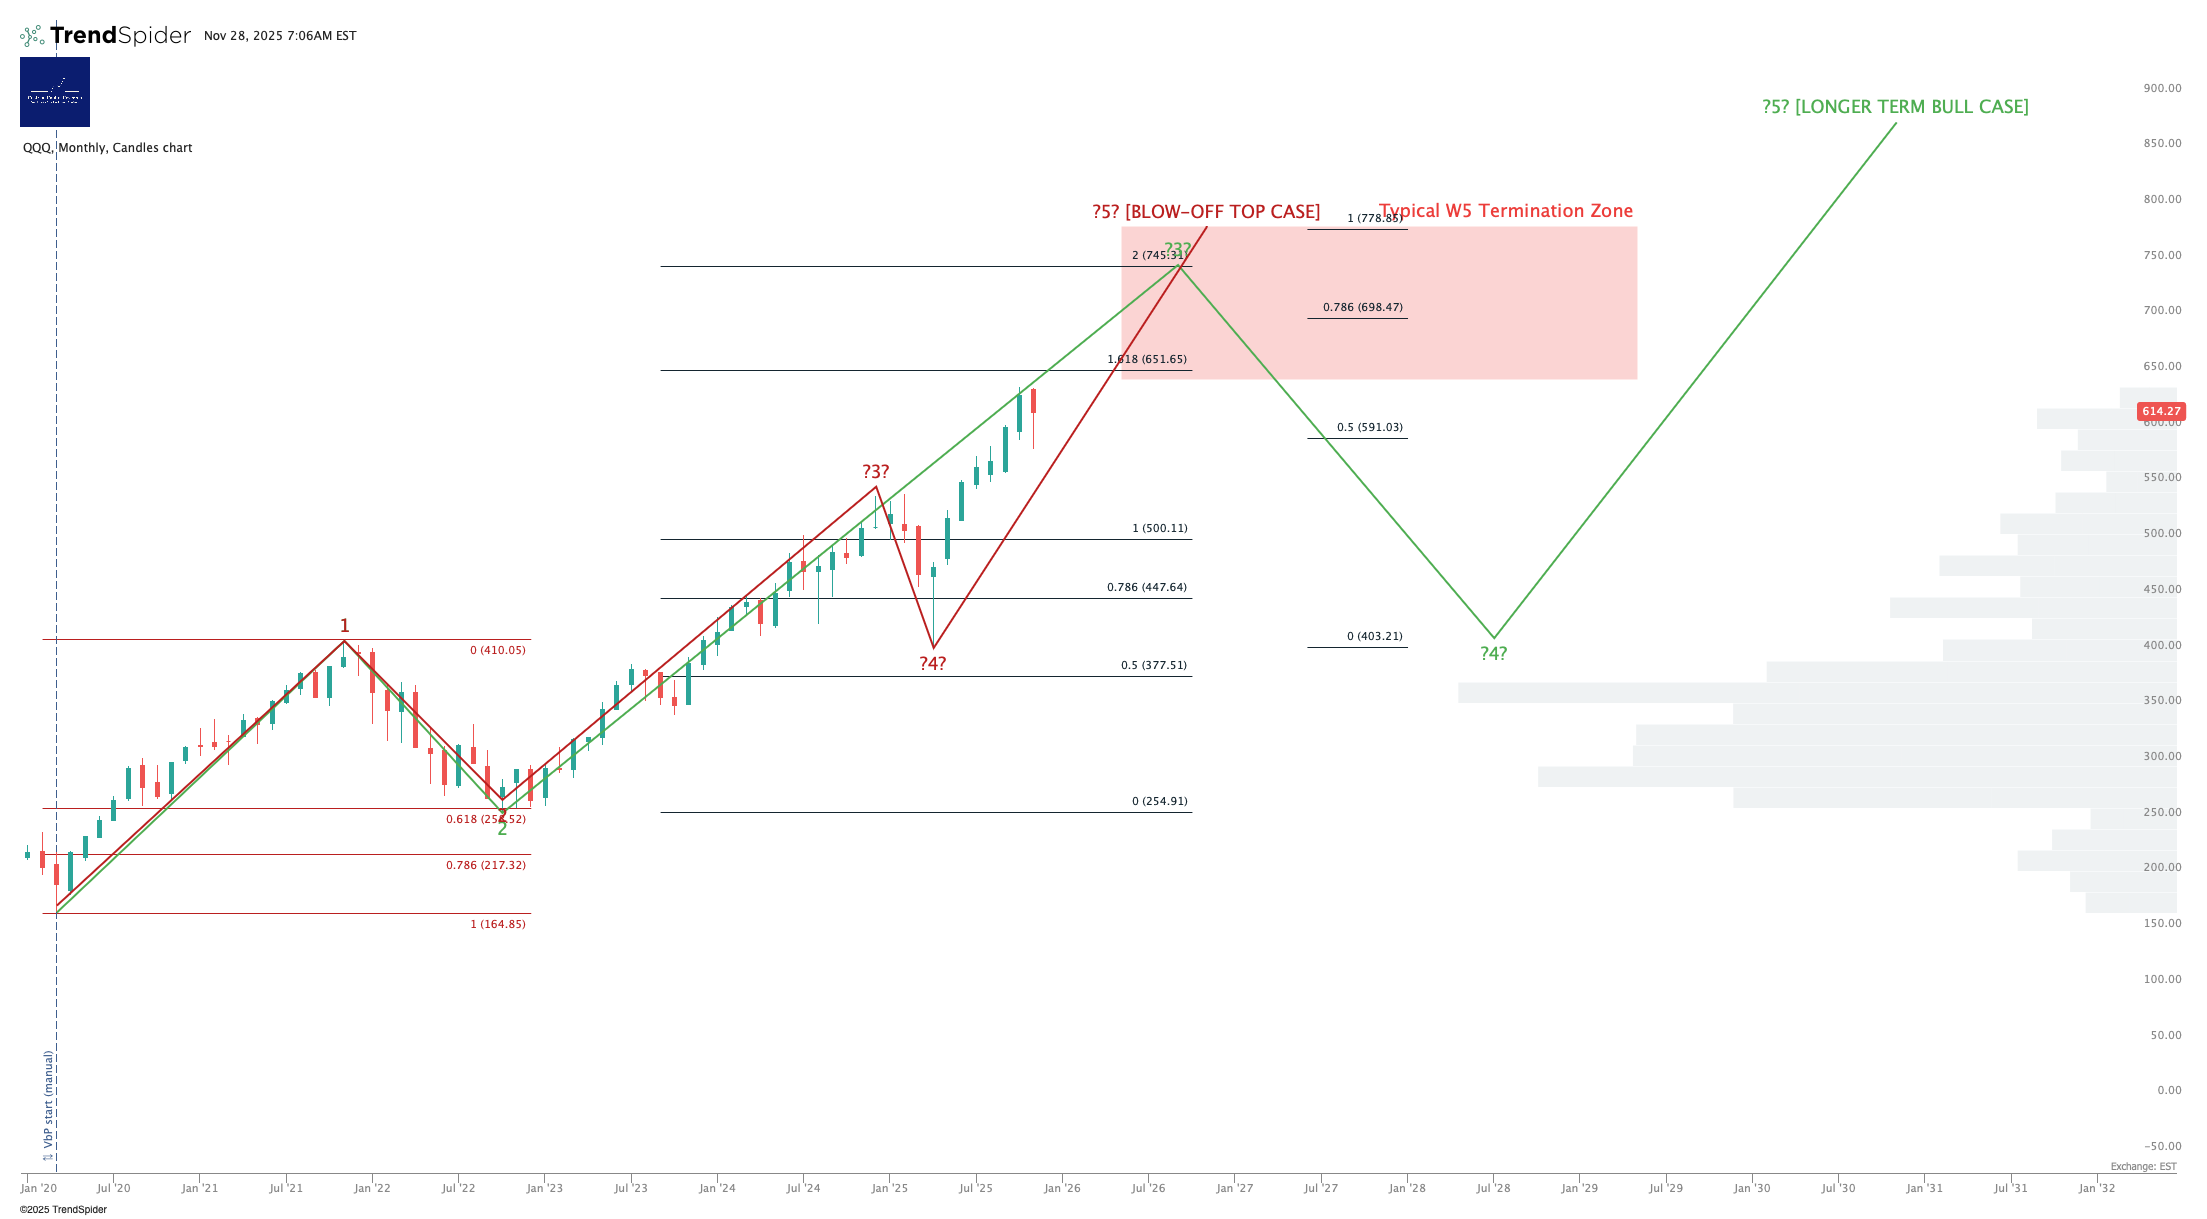
Back over the short-term moving averages as of Wednesday’s close.
Levered Nasdaq - TQQQ Long / SQQQ Short
Note - Leveraged ETF. Read the fund documentation if you are considering using this instrument.
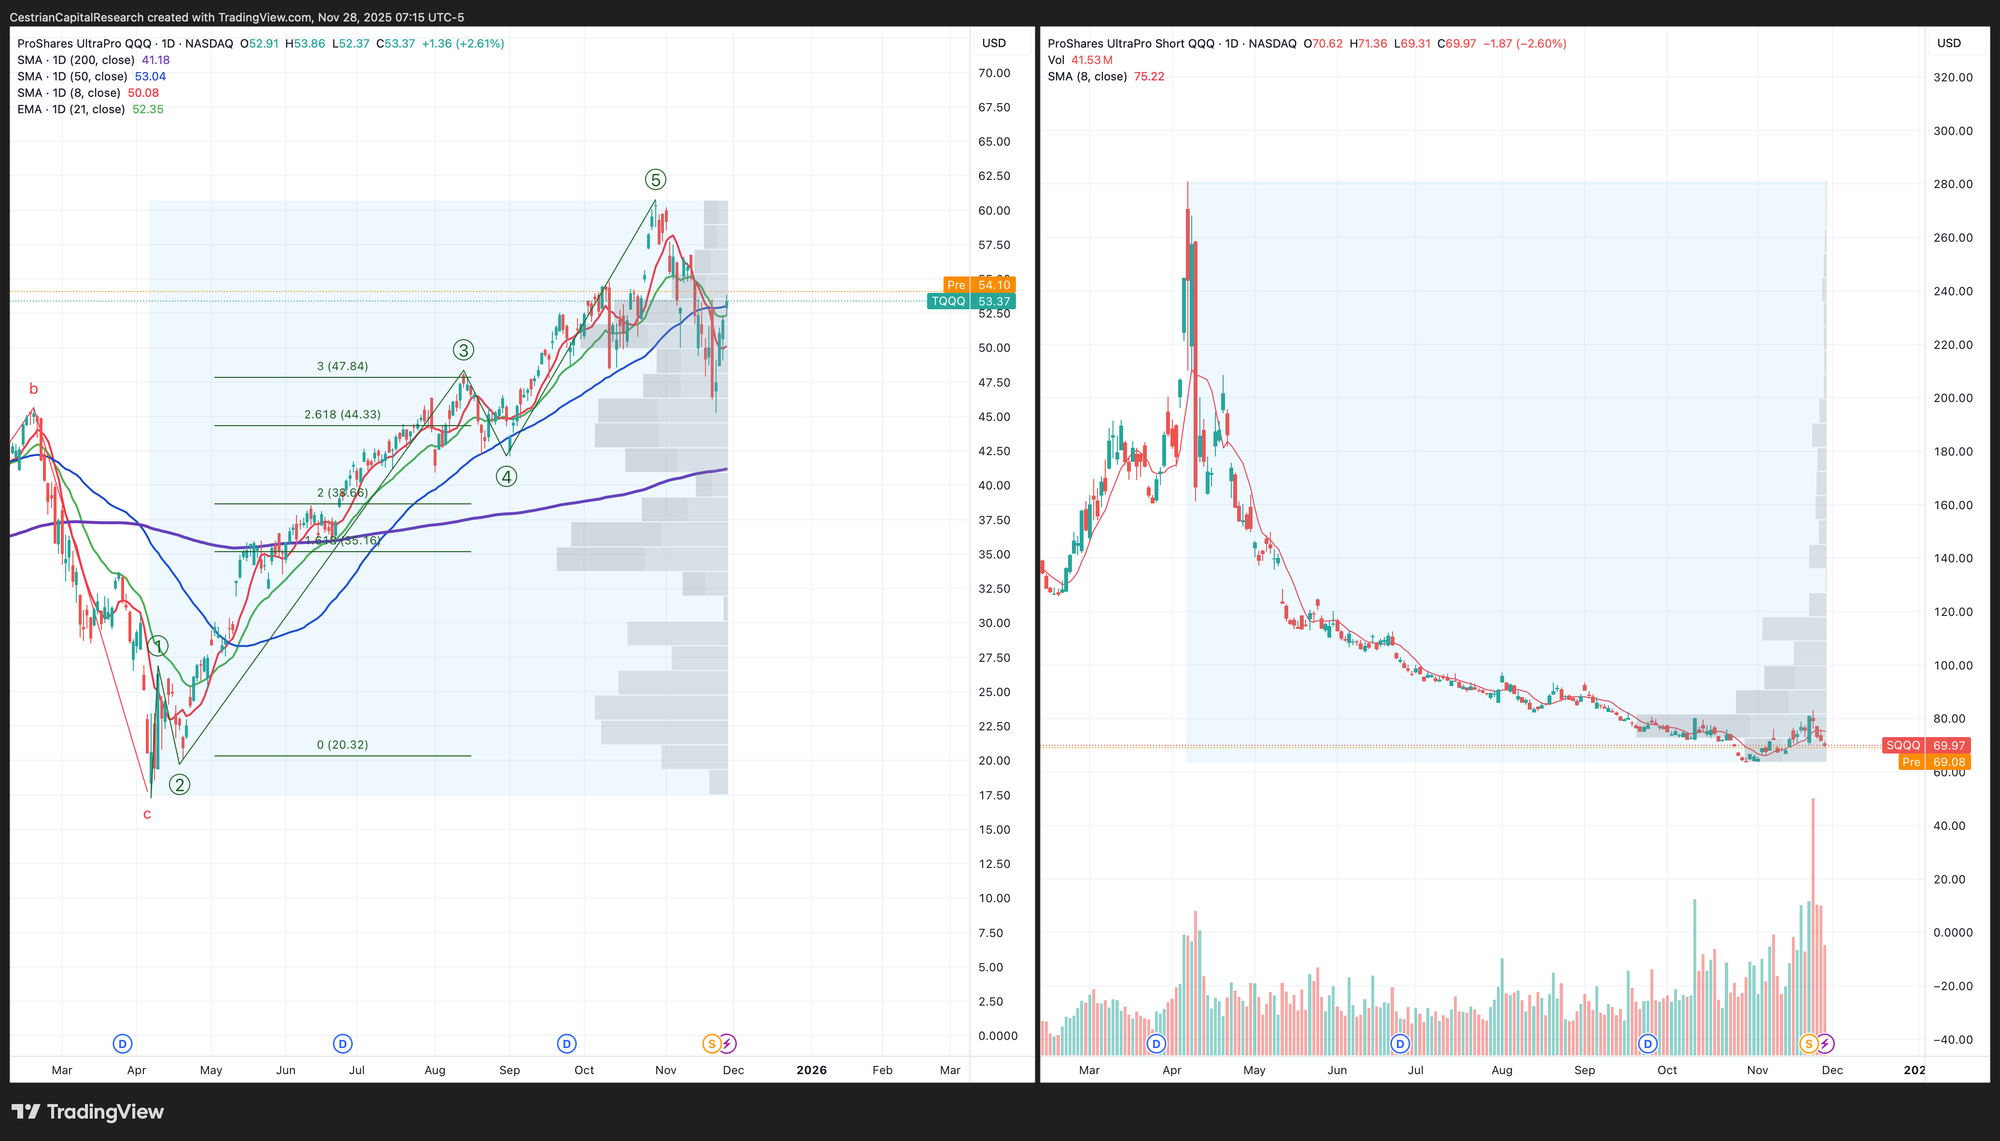
Disclosure: I am hedged 2.2:1 $TQQQ:$SQQQ, and have $TQQQ and $QQQ puts for December expiry. Overall net long the Nasdaq.
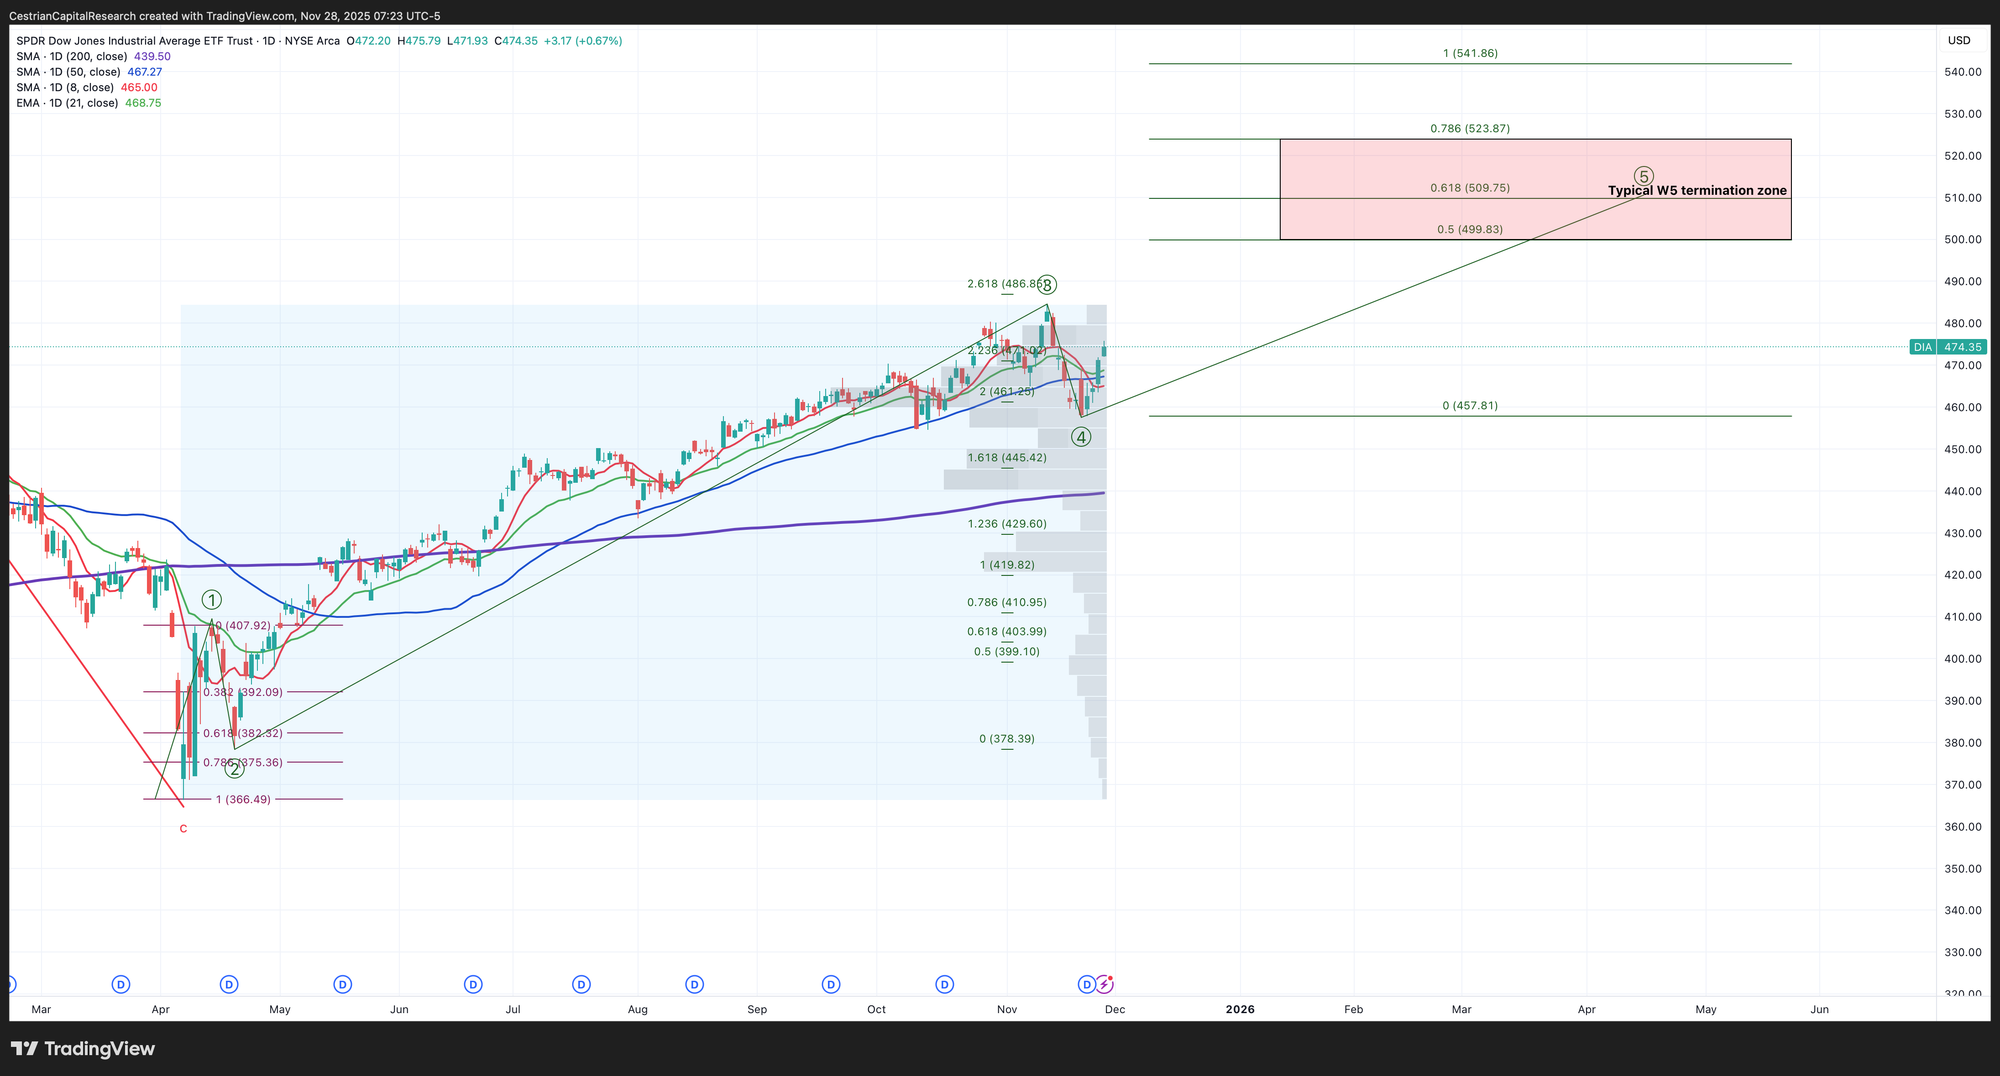
Dow Jones / DIA / UDOW
This chart is another way of measuring whether the current move up in the S&P and the Nasdaq is a “blow-off top” likely to see a big decline afterwards, or something longer term bullish. For now, up.
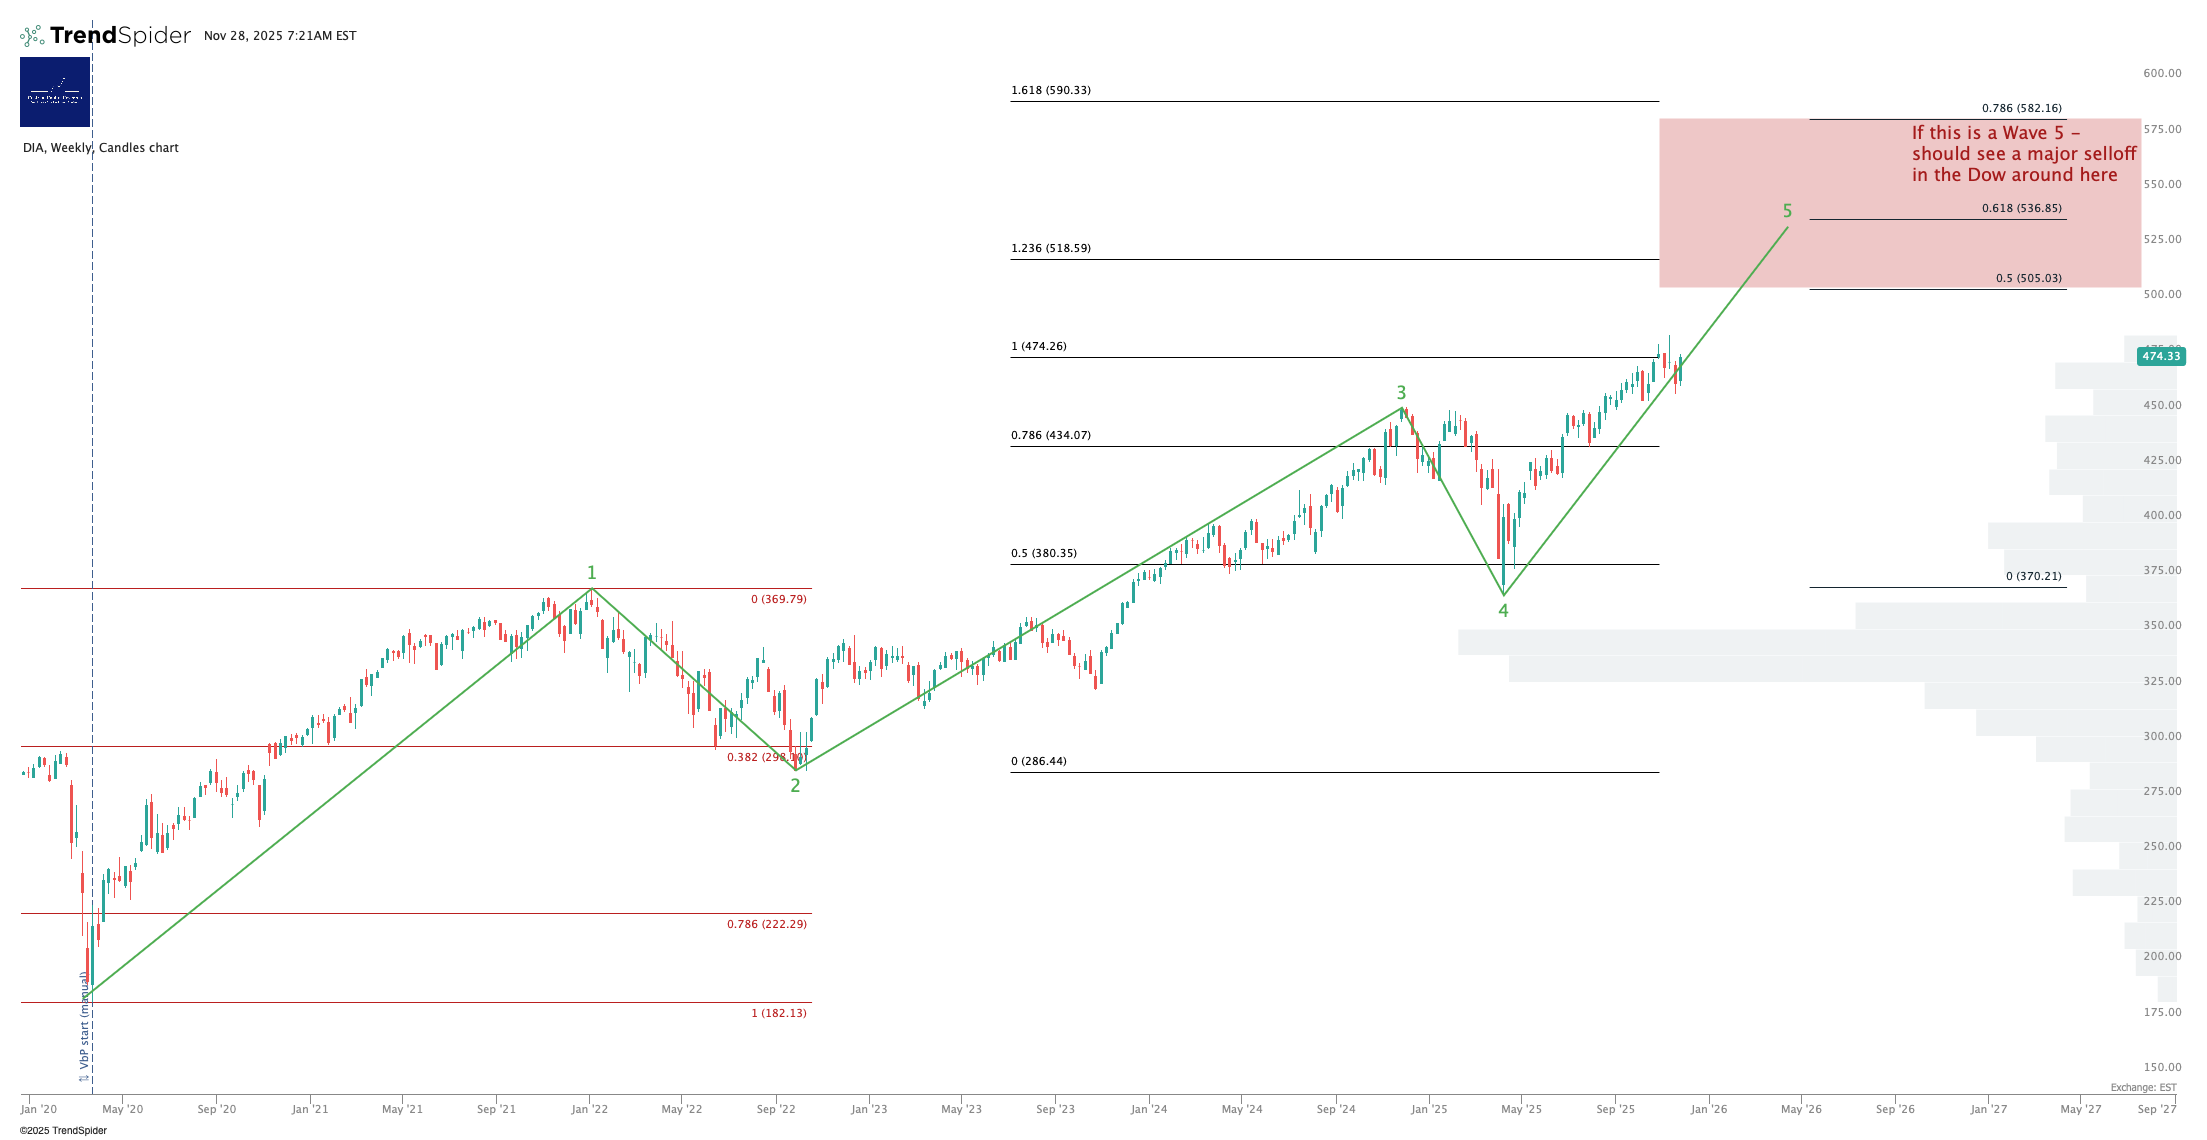
Up and over all short-term moving averages. Bullish.
3x Levered Dow - UDOW Long / SDOW Short
Note - Leveraged ETFs. Read the fund documentation if you are considering using this instrument.
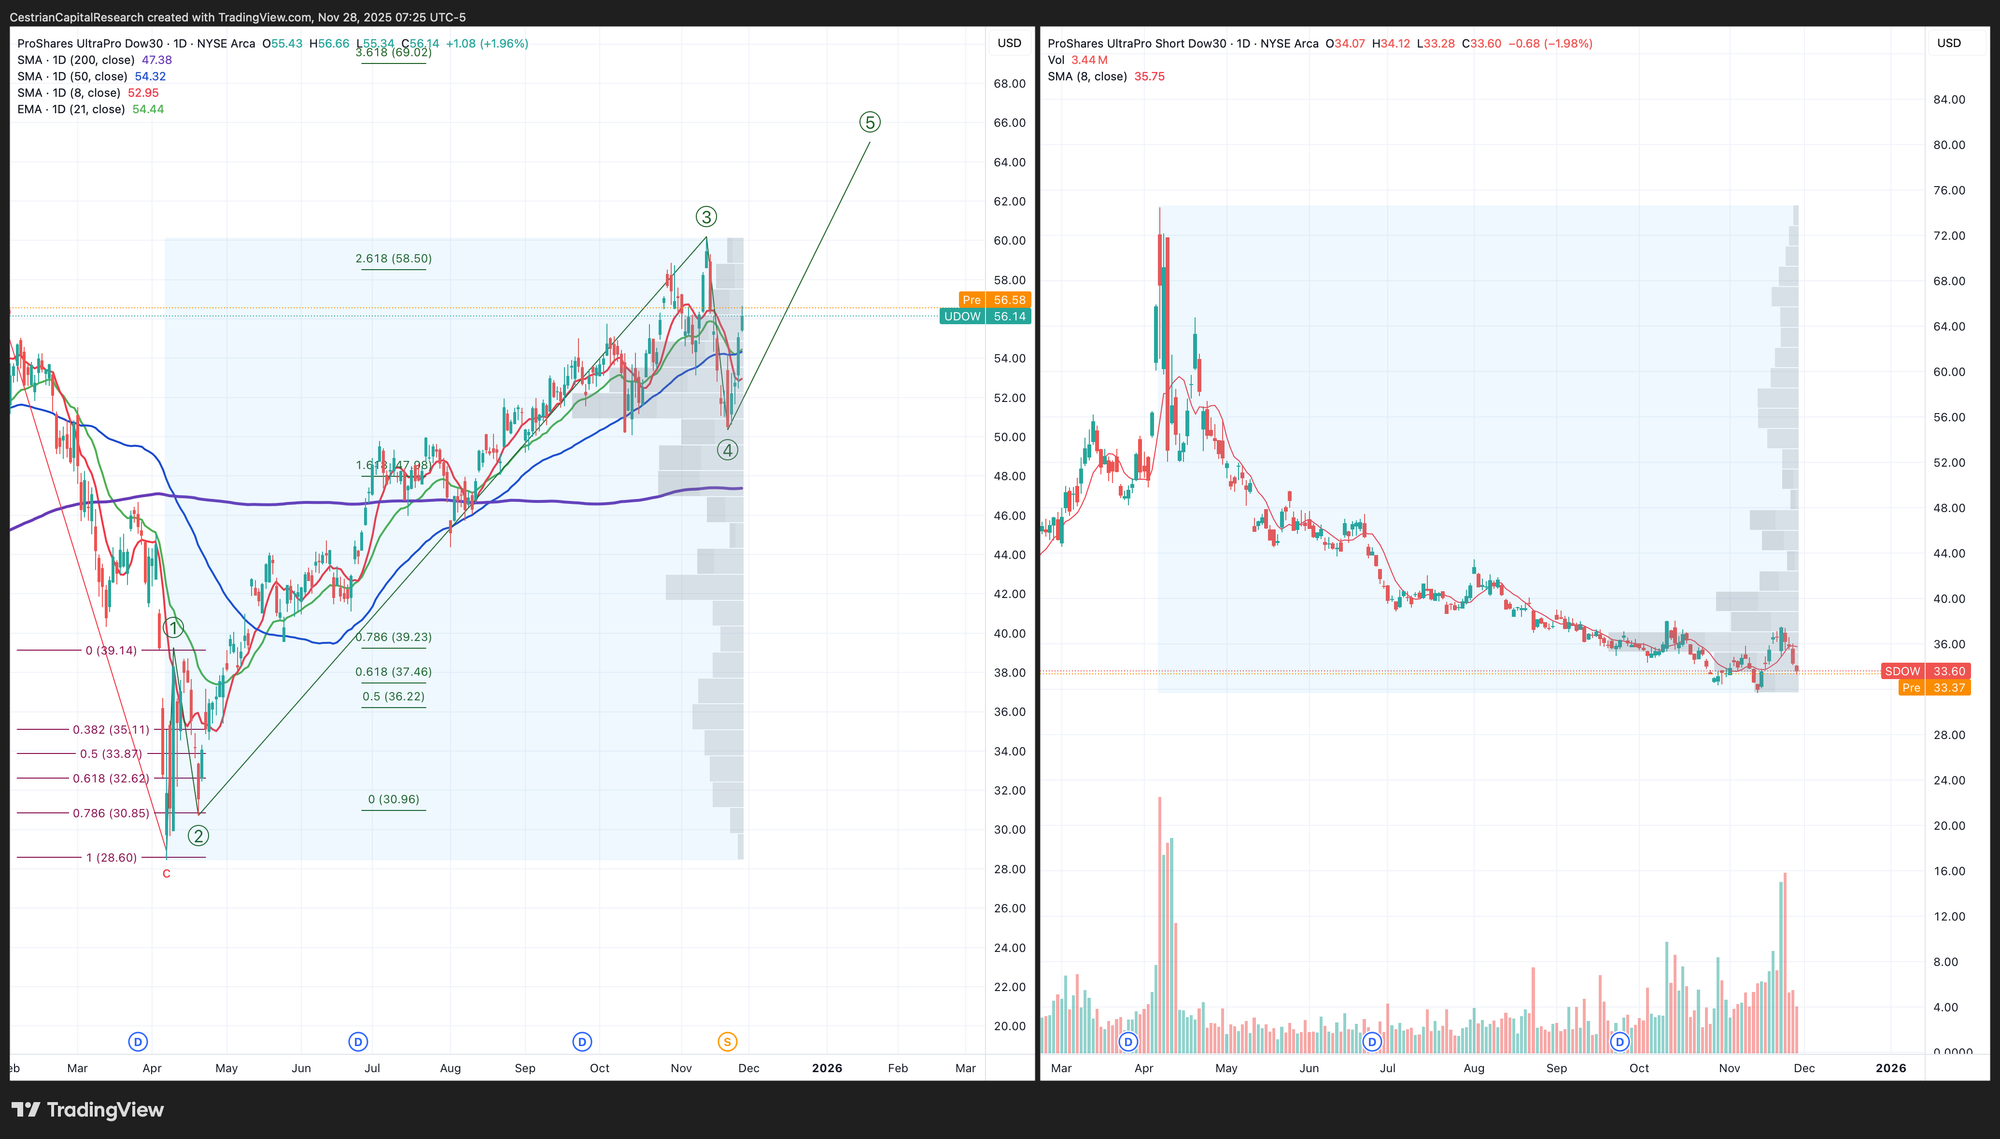
Disclosure: No position in the Dow.
Sector ETFs
No change - bearish below $296, bullish above.
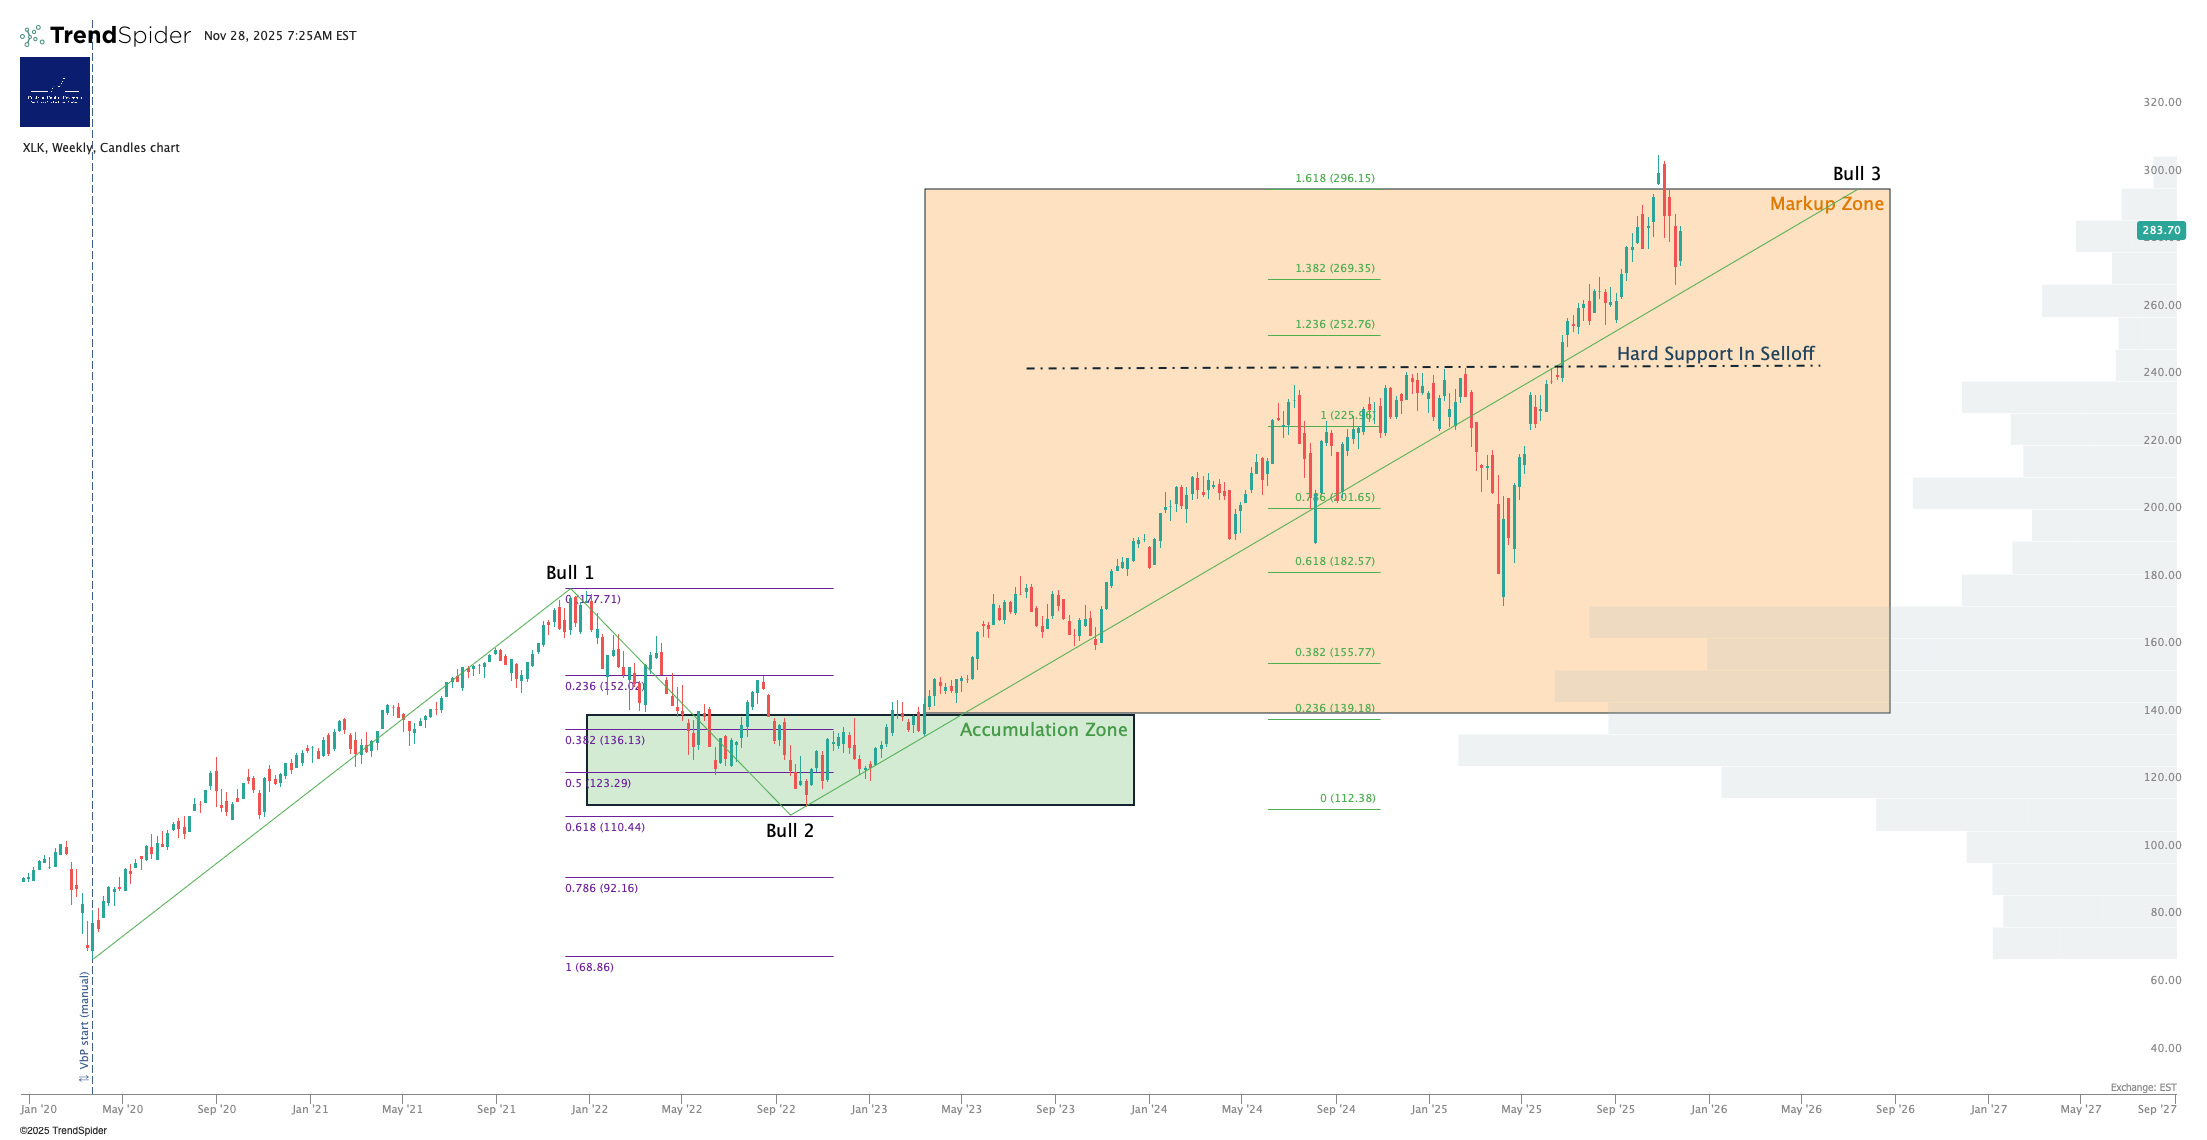
Disclosure: No position in $XLK.
3x Levered Long/Short Tech - TECL/TECS
Note - TECL and its inverse TECS tend to be illiquid outside RTH with relatively wide bid/ask spreads.
Note - Leveraged ETFs. Read the fund documentation if you are considering using this instrument.
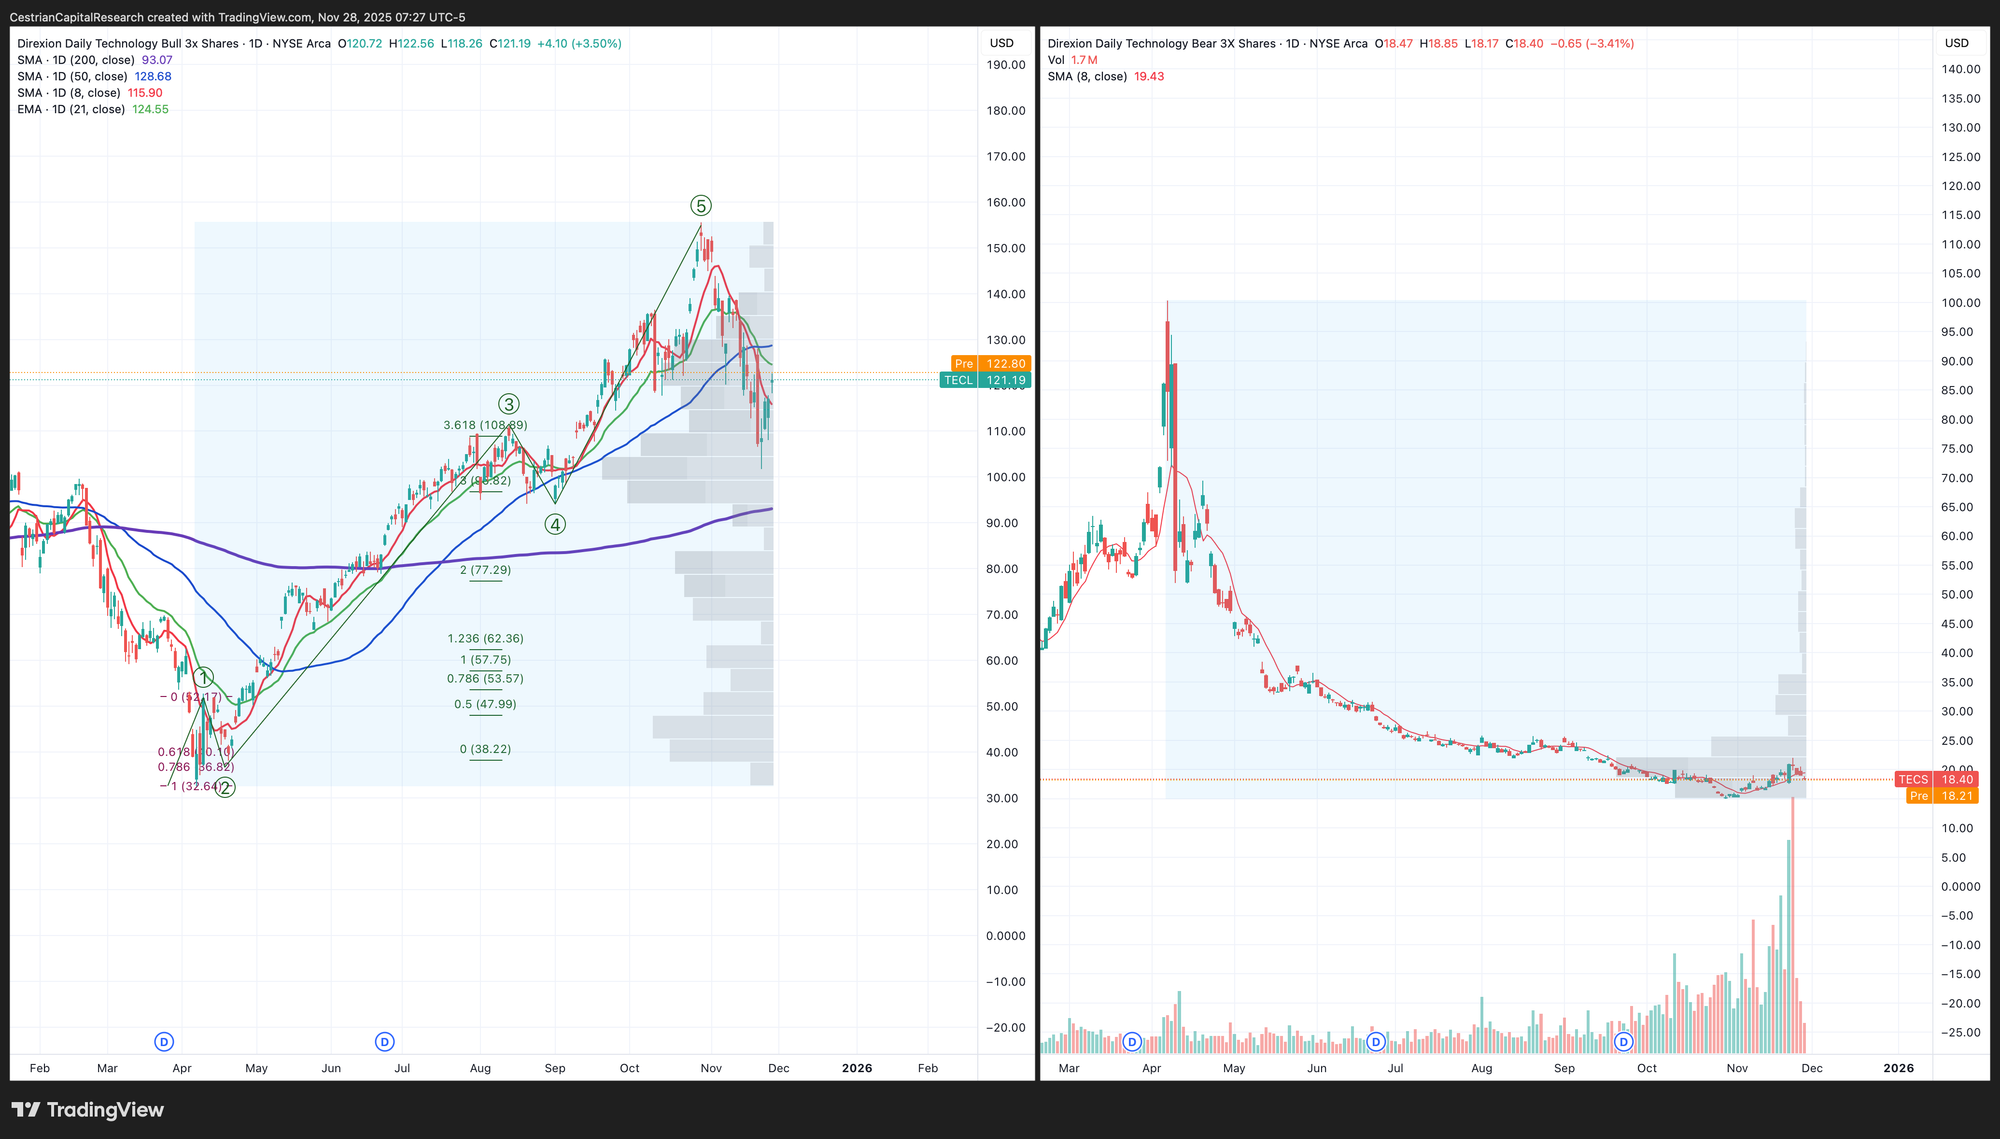
Disclosure: No position in TECL or TECS
SOXX (Semiconductor)
Sat at a key level now, that support / resistance flip highlighted some weeks back.
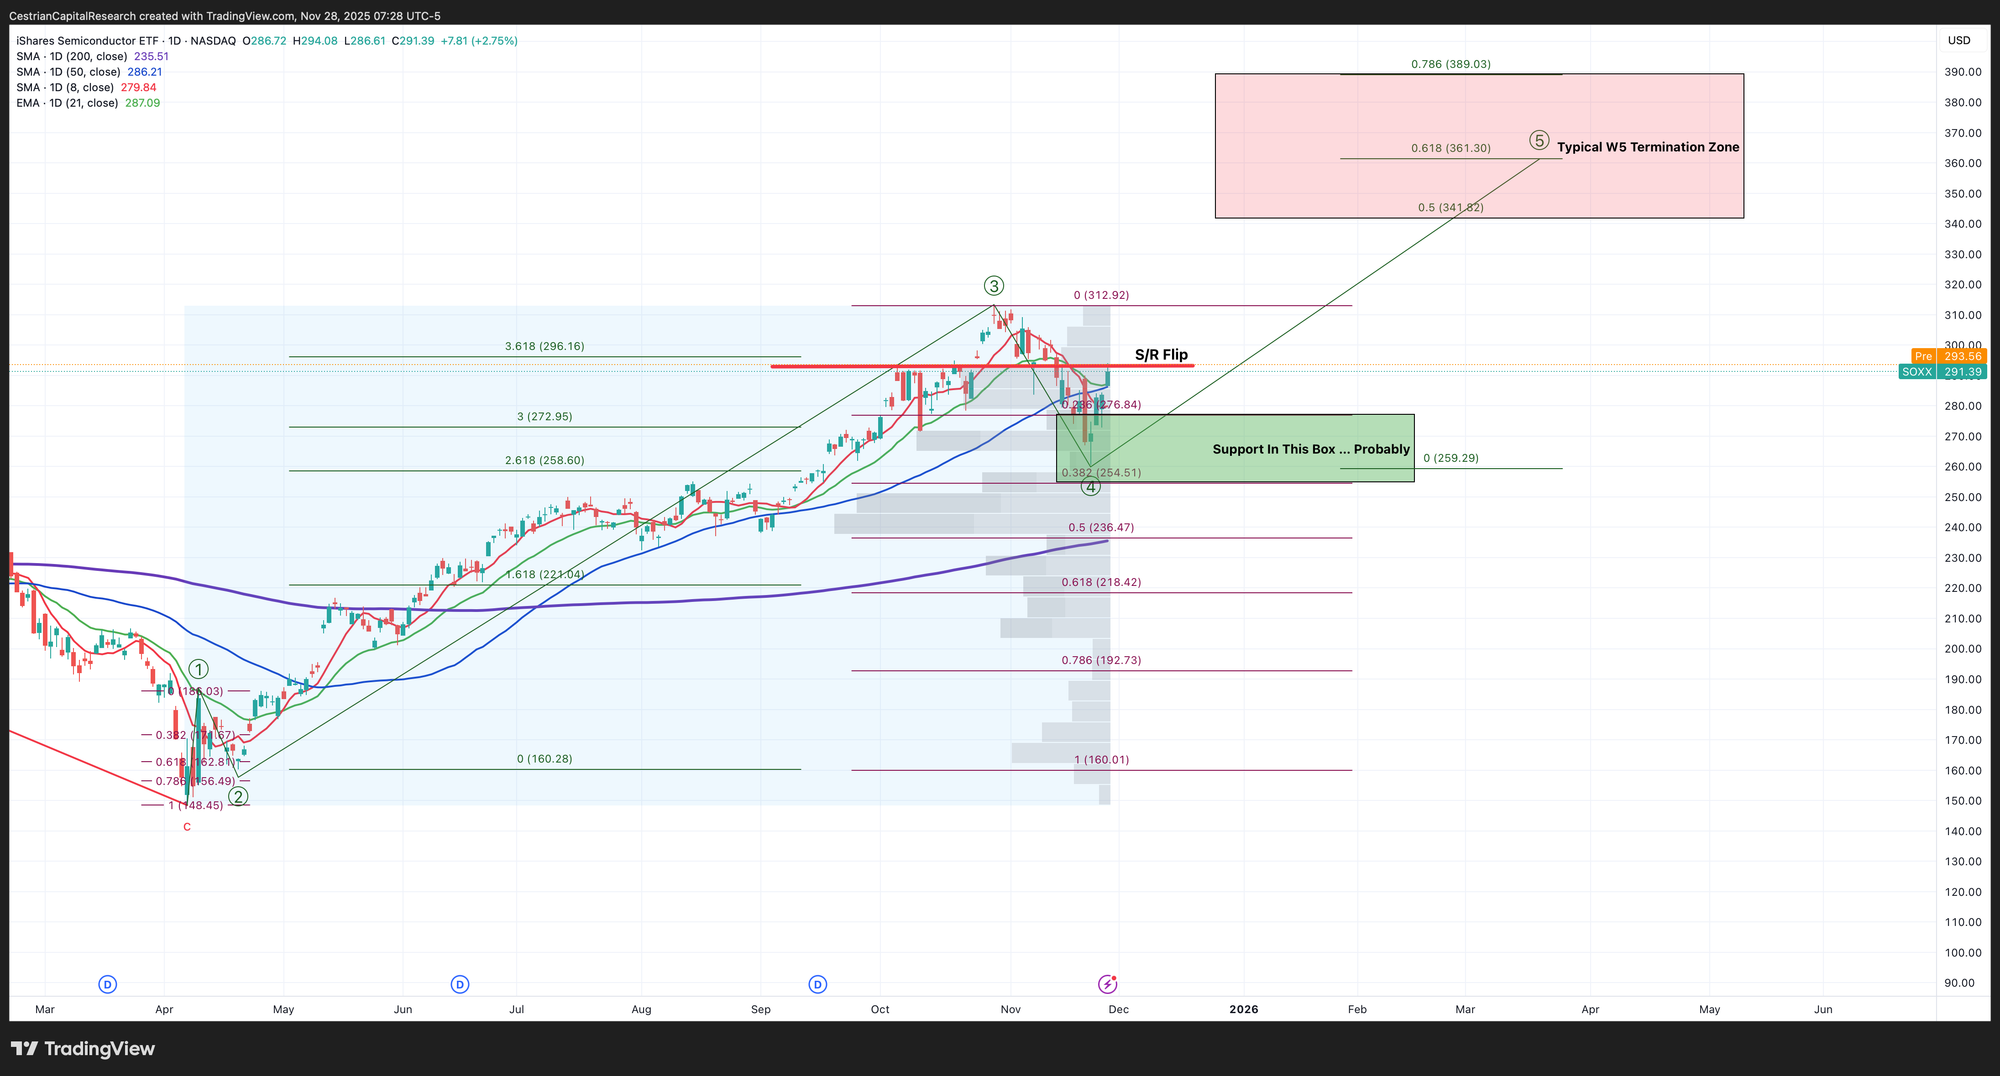
3x Levered Long / Short Semiconductor - SOXL / SOXS
Note - Leveraged ETF. Read the fund documentation if you are considering using this instrument.
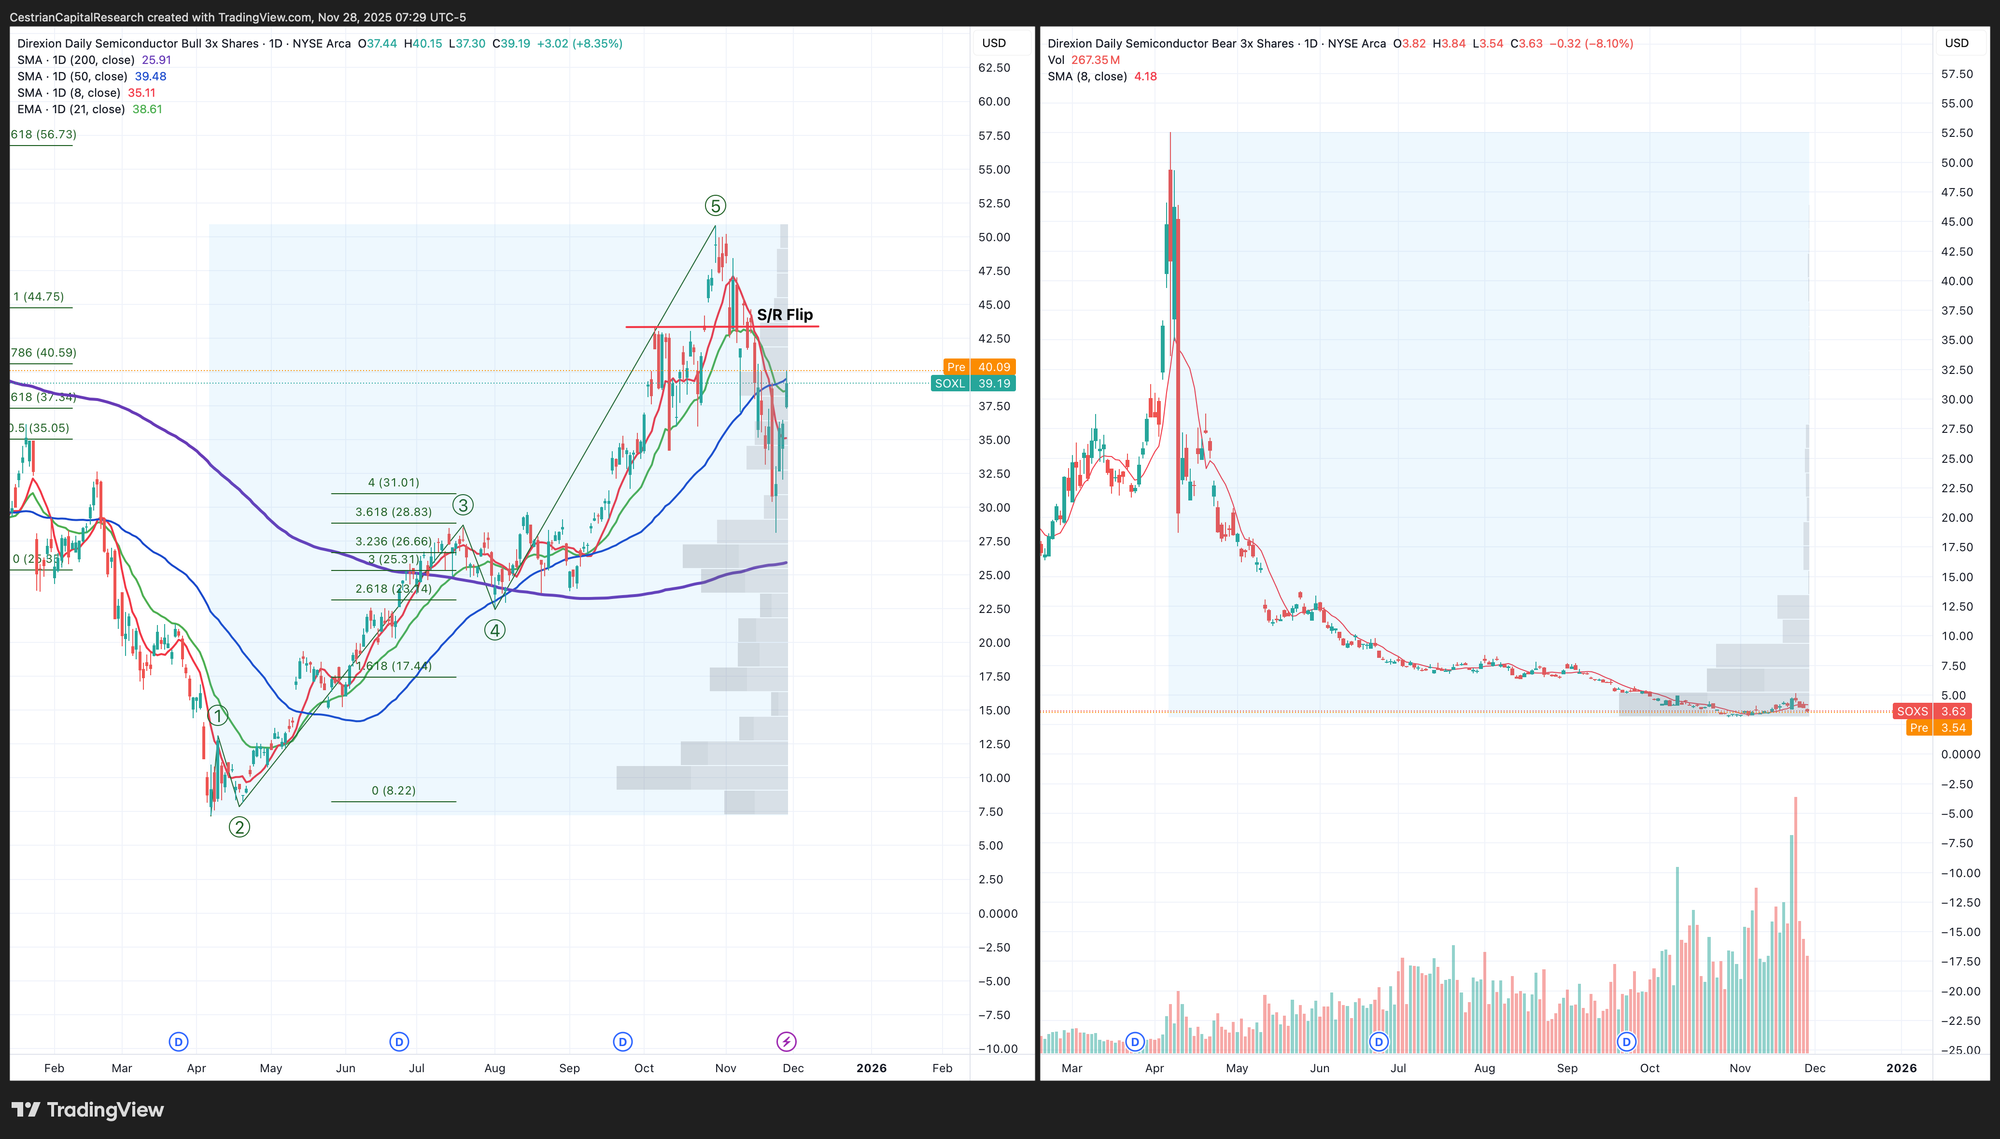
Disclosure: I am hedged 2.9:1 $SOXL:$SOXS
Alex King, Cestrian Capital Research, Inc - 28 November 2025.