
Meta Platforms Q3 FY12/25 Earnings Review

DISCLAIMER: This note is intended for US recipients only and, in particular, is not directed at, nor intended to be relied upon by any UK recipients. Any information or analysis in this note is not an offer to sell or the solicitation of an offer to buy any securities. Nothing in this note is intended to be investment advice and nor should it be relied upon to make investment decisions. Read our full disclaimer, here.
Glory Days.
by Alex King, CEO, Cestrian Capital Research, Inc.
For an otherwise very locked-down individual, Mr. Zuckerberg’s impulse control when it comes to spending money is not, in my view, very good. Now, when you have all the money, and I mean all the money, you don’t have to exercise much control in your personal life, because even when you are buying the parts of Hawaii not already owned by Messrs. Benioff and Ellison, you still have plenty left over for groceries each week. But in corporate life - when the source of your personal money is the stock of the corporation you run - you need to be more programmatic with the dollars deployed.
I suspect that the reason the Zuckerberg-Sandberg Double Act worked so well is that Ms. Sandberg’s primary job was to say “no” or “yes, but less”, and then to put the plan into action. Her ejection from the company is, in my view, still having a lasting impact.
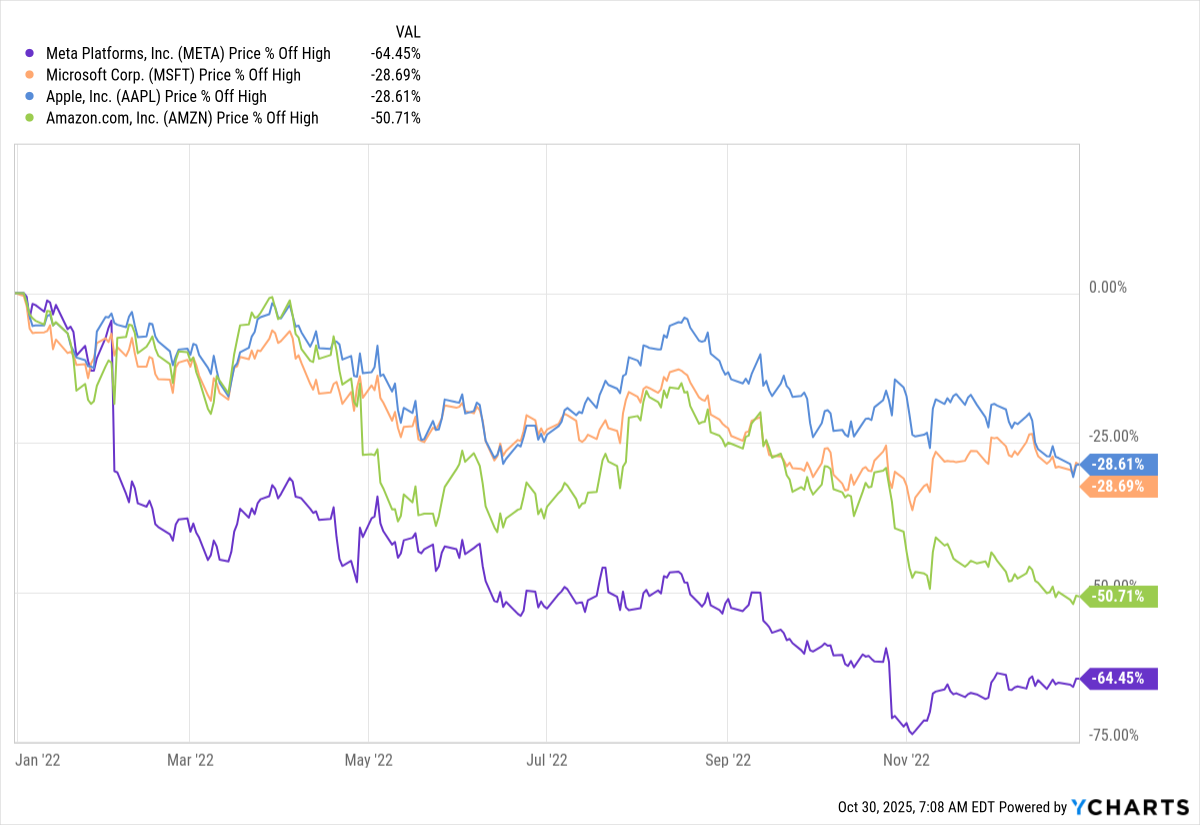
Meta’s splurgefest on ’the metaverse’ was ill-judged. There probably will be a time for widely used virtual worlds, but that time turned out to not be 2021 or 2022. The poorly timed realization of that is what drove Meta’s stock into the ground in ’22. Everything in tech sold off, yes, but not as badly as $META. Here’s Meta, Amazon, Apple and Microsoft from 31 December 2021 to 31 December 2022.
If you owned the grownup companies run by the old-line CEOs Nadella and Cook, you were down less than 30%, not bad for such a gruesome year in tech. Meta? A 75% drop at the lows. Jeez.
Now, once the whole “spend capex forever in pursuit of the new new thing” was junked and the company returned to extracting monopoly rents from advertisers in exchange for access to the plumbing directly to billions of brain stems, this happened.

That was a very nice swing trade for our subscribers, from a 28 July 2022 entry to a 30 January 2025 exit; in at $160 and out at $686, that will do thankyou.
Mr. Zuckerberg is at it again, I feel. The capex bill is climbing, the balance sheet shrinking, and as yet there is no benefit to be seen in the rate of TTM revenue growth or EBITDA margins (which are before capex of course).
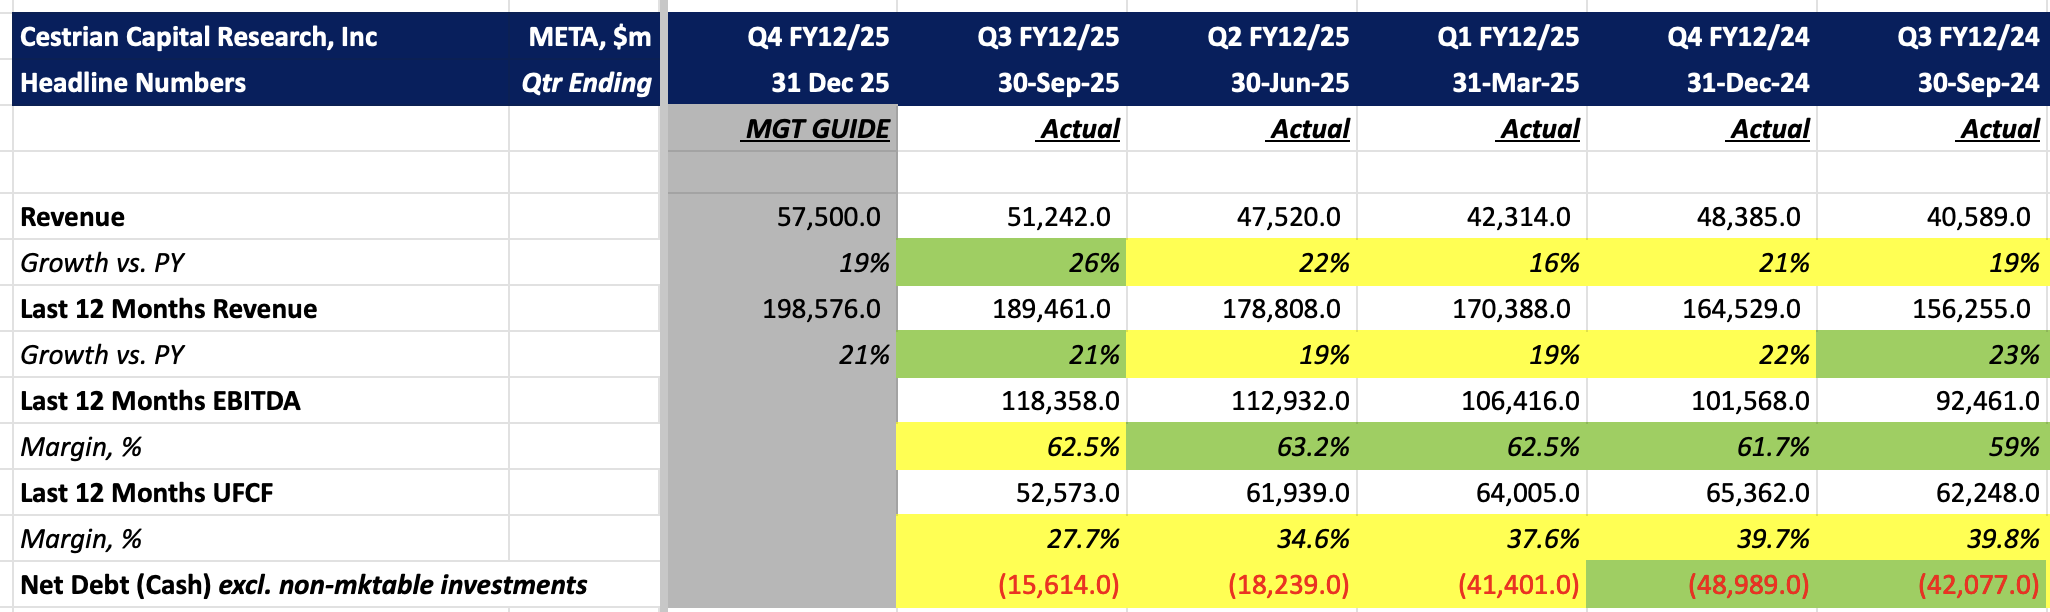
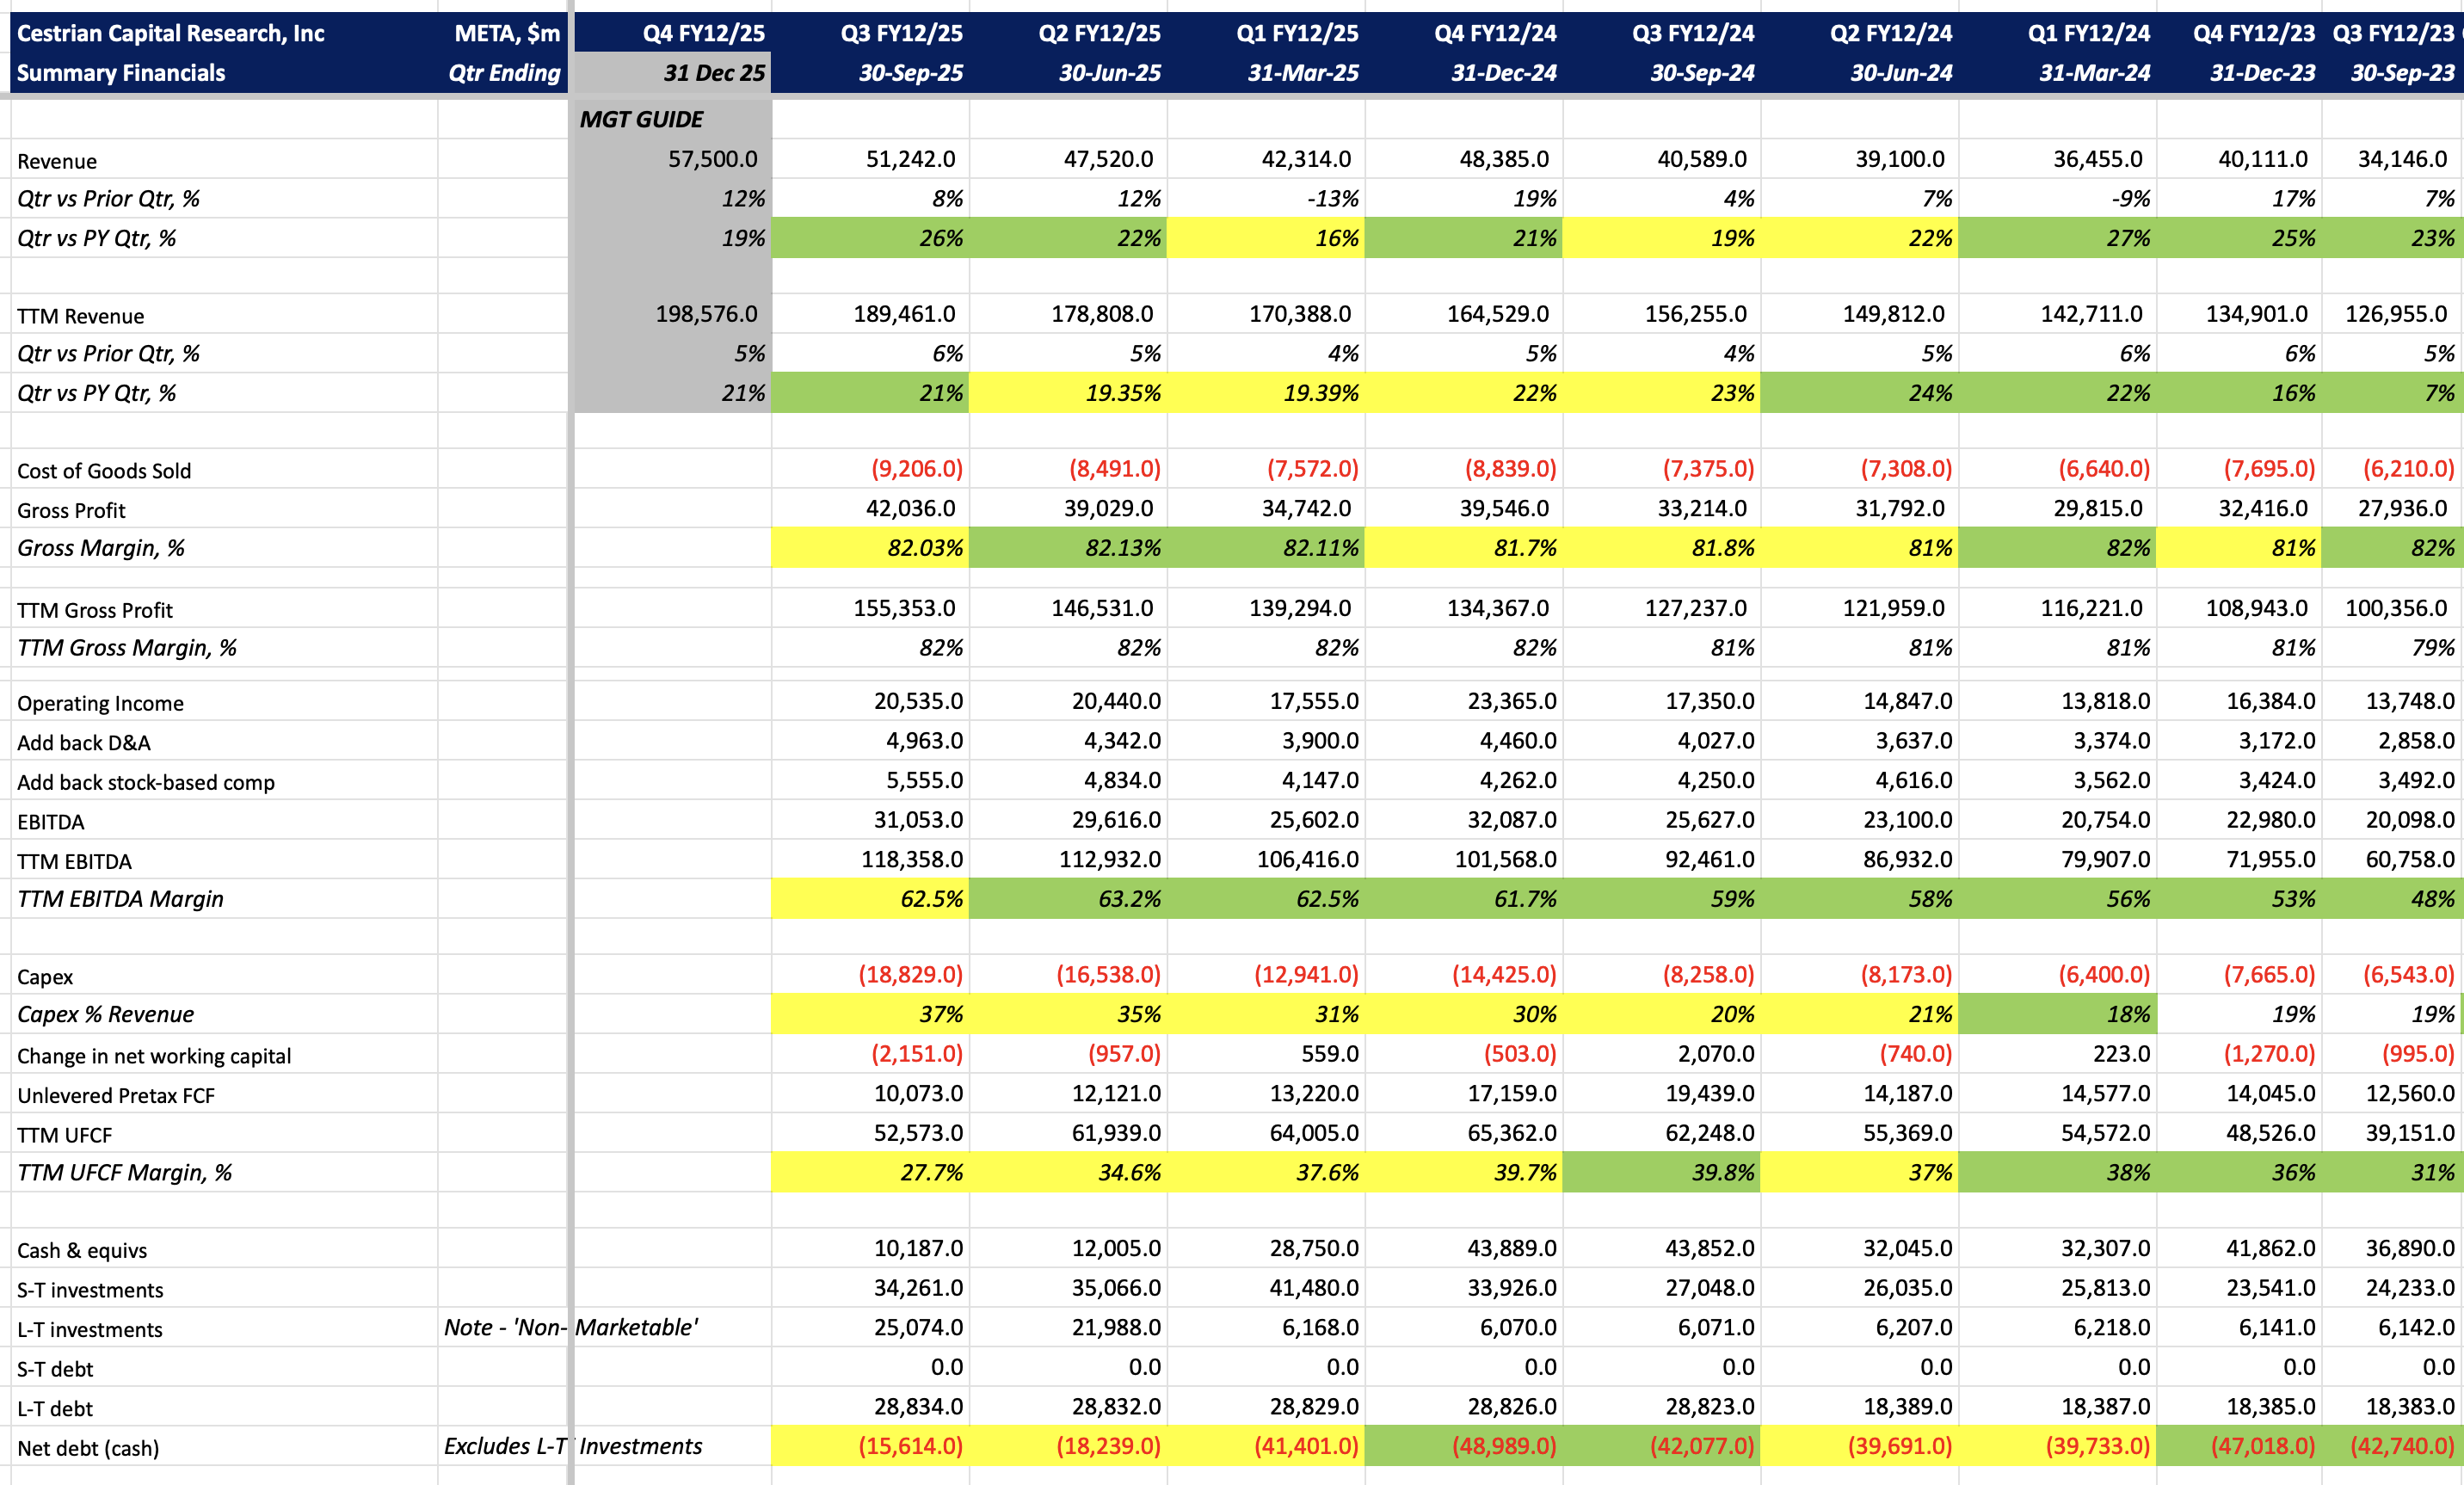
Summary Fundamentals
Yes, I know, AI, but if you look at Microsoft you’ll see that Redmond is managing this just fine.

Let's recap.
- Revenue growth accelerated to +26% YoY for the quarter (good) and TTM to +21% vs prior year (also good).
- TTM EBITDA margins fell to 62.5% on a TTM basis - still very high of course but I suspect these margins have peaked.
- Unlevered pretax FCF margins - that’s after capex - ticked down to 28%, from 40% a year ago (and that’s on a slow-to-change TTM basis, so the impact is remarkable).
- The balance sheet had $42bn of net cash a year ago, now less than $16bn of net cash. Not pretty.
This company is once again on a course of betting-it-all-on-black. It will succeed or it won’t, I don’t know, but prudent this is not.
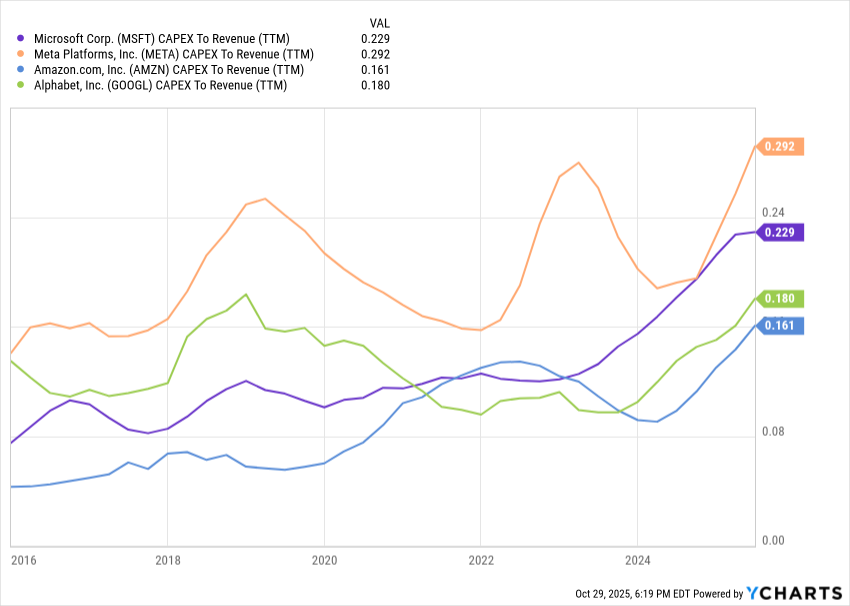
MSFT vs. Peers - TTM Capex % TTM Revenue
I included this same chart in the Microsoft note linked above, but it’s worth looking at again. My conclusion is that META looks out of control vs the other big names. One looks like a dodgem and the others look like MBA projects. And don’t forget the company just told everyone that the capex bill is going up next year.
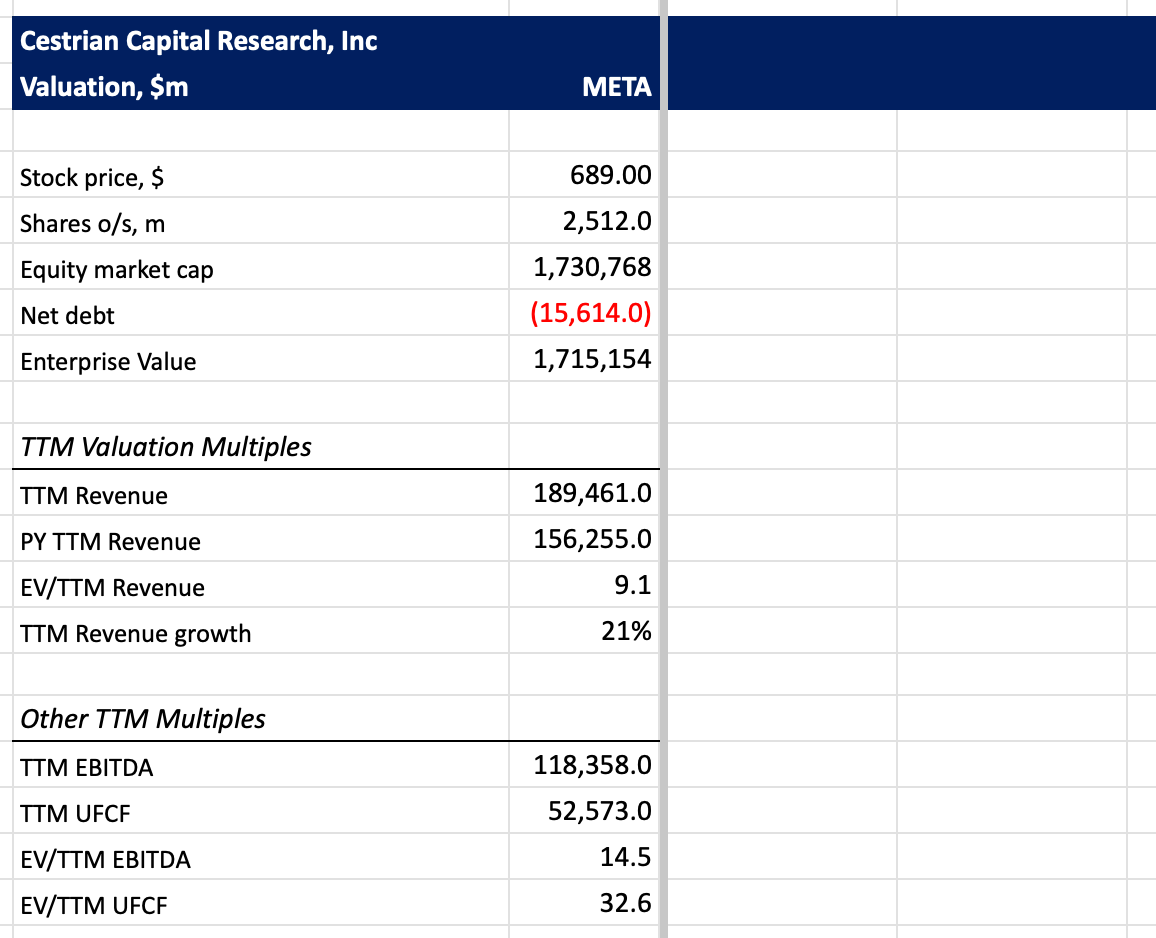
Valuation
META has never been particularly expensive on fundamental multiples, and that remains the case today. In 2022 you could buy it for a measly 7.5x TTM UFCF; today it’s trading at 32.6x TTM UFCF. In 2022, cashflow was turning up; now, it’s turning down.
Stock Chart And Price Outlook
Here’s how the charts look to my eyes. Firstly, the longer term view.
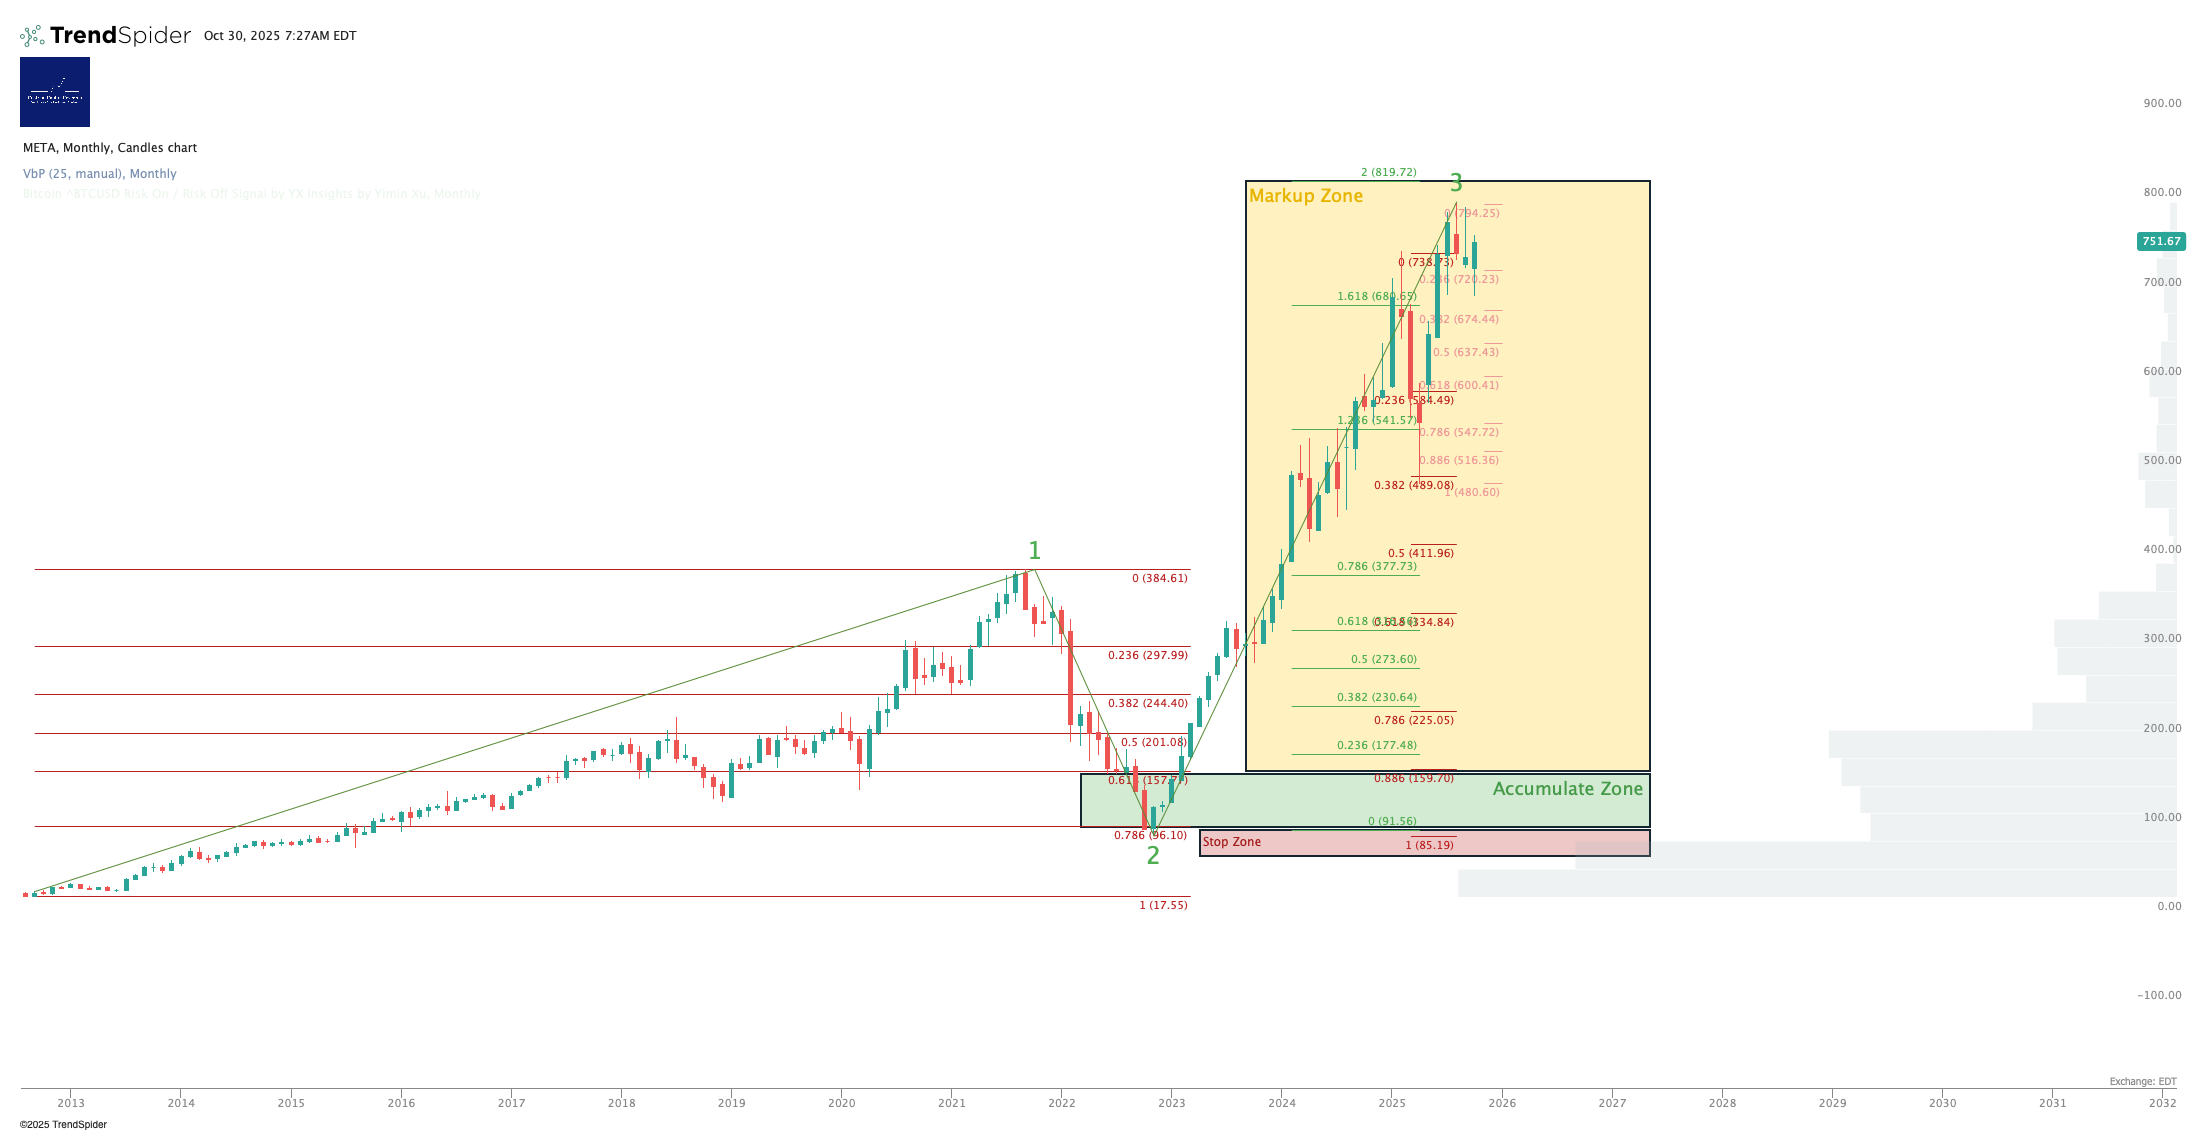
The stock so far peaked a little shy of the 2.0 Fibonacci extension of the prior Wave 1 placed at the Wave 2 low. Right now the stock is hovering over the 1.618 extension. That’s not a crazy move up from the 2022 lows, but you can see that the stock is having trouble pushing higher.
And the short term:
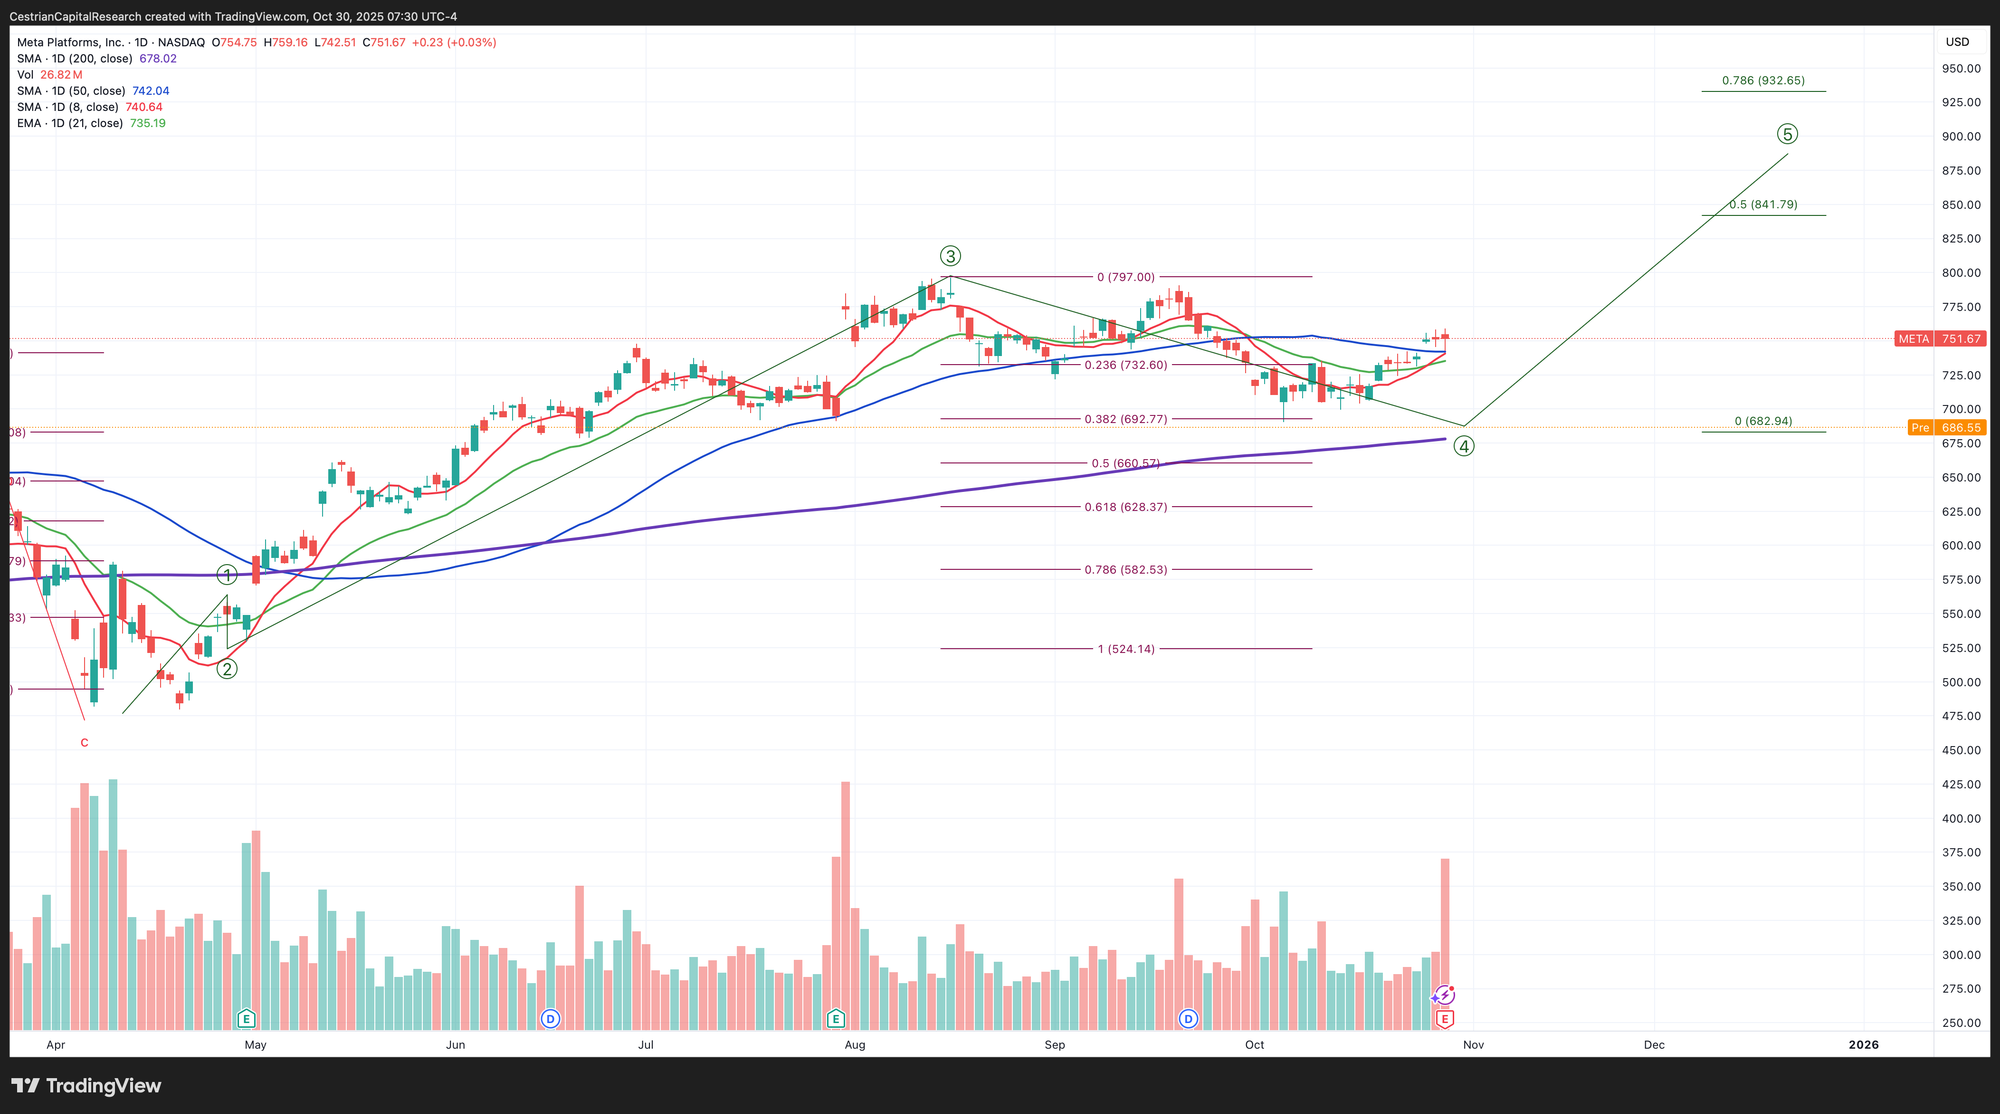
Speaking technically, assuming the stock holds over its 200-day moving average today (thick purple line above) there’s every chance it can move up to $840, even as high as $930. If it closes below the 200-day then all bets are off until such time as it reclaims that 200-day.
You have to decide what you want to do about this. Personally if I owned META stock (I don’t), I would be out, because I don’t have faith that the company is navigating the new asset-intensive play in Big Tech very well. But then I don’t own Hawaii, and Mr. Zuckerberg does, so you have to decide who is most likely to be right here.
Rating
We rate the stock at DISTRIBUTE and will soon move to DO NOTHING. Our Accumulation zone topped out at $157 and started at $92, so if you held from the middle of our Accumulation Zone until now, you would be up by some 5.5x in about three years in an unlevered highly liquid common stock. Not too shabby.
Appendix: Detailed Fundamentals
Cestrian Capital Research, Inc - 30 October 2025.
DISCLOSURE: Cestrian Capital Research, Inc staff personal accounts hold no position(s) in $META save via index ETFs.