
Microsoft Q1 FY6/26 Earnings Review.

DISCLAIMER: This note is intended for US recipients only and, in particular, is not directed at, nor intended to be relied upon by any UK recipients. Any information or analysis in this note is not an offer to sell or the solicitation of an offer to buy any securities. Nothing in this note is intended to be investment advice and nor should it be relied upon to make investment decisions. Read our full disclaimer, here.
Sheesh.
by Alex King, CEO, Cestrian Capital Research, Inc.
Microsoft ($MSFT) reported its fiscal Q1 (their financial year ends 30 June 2026) today after the close. In an environment where I think everyone is looking for the show-me answer to all this capex spending, Microsoft delivered.
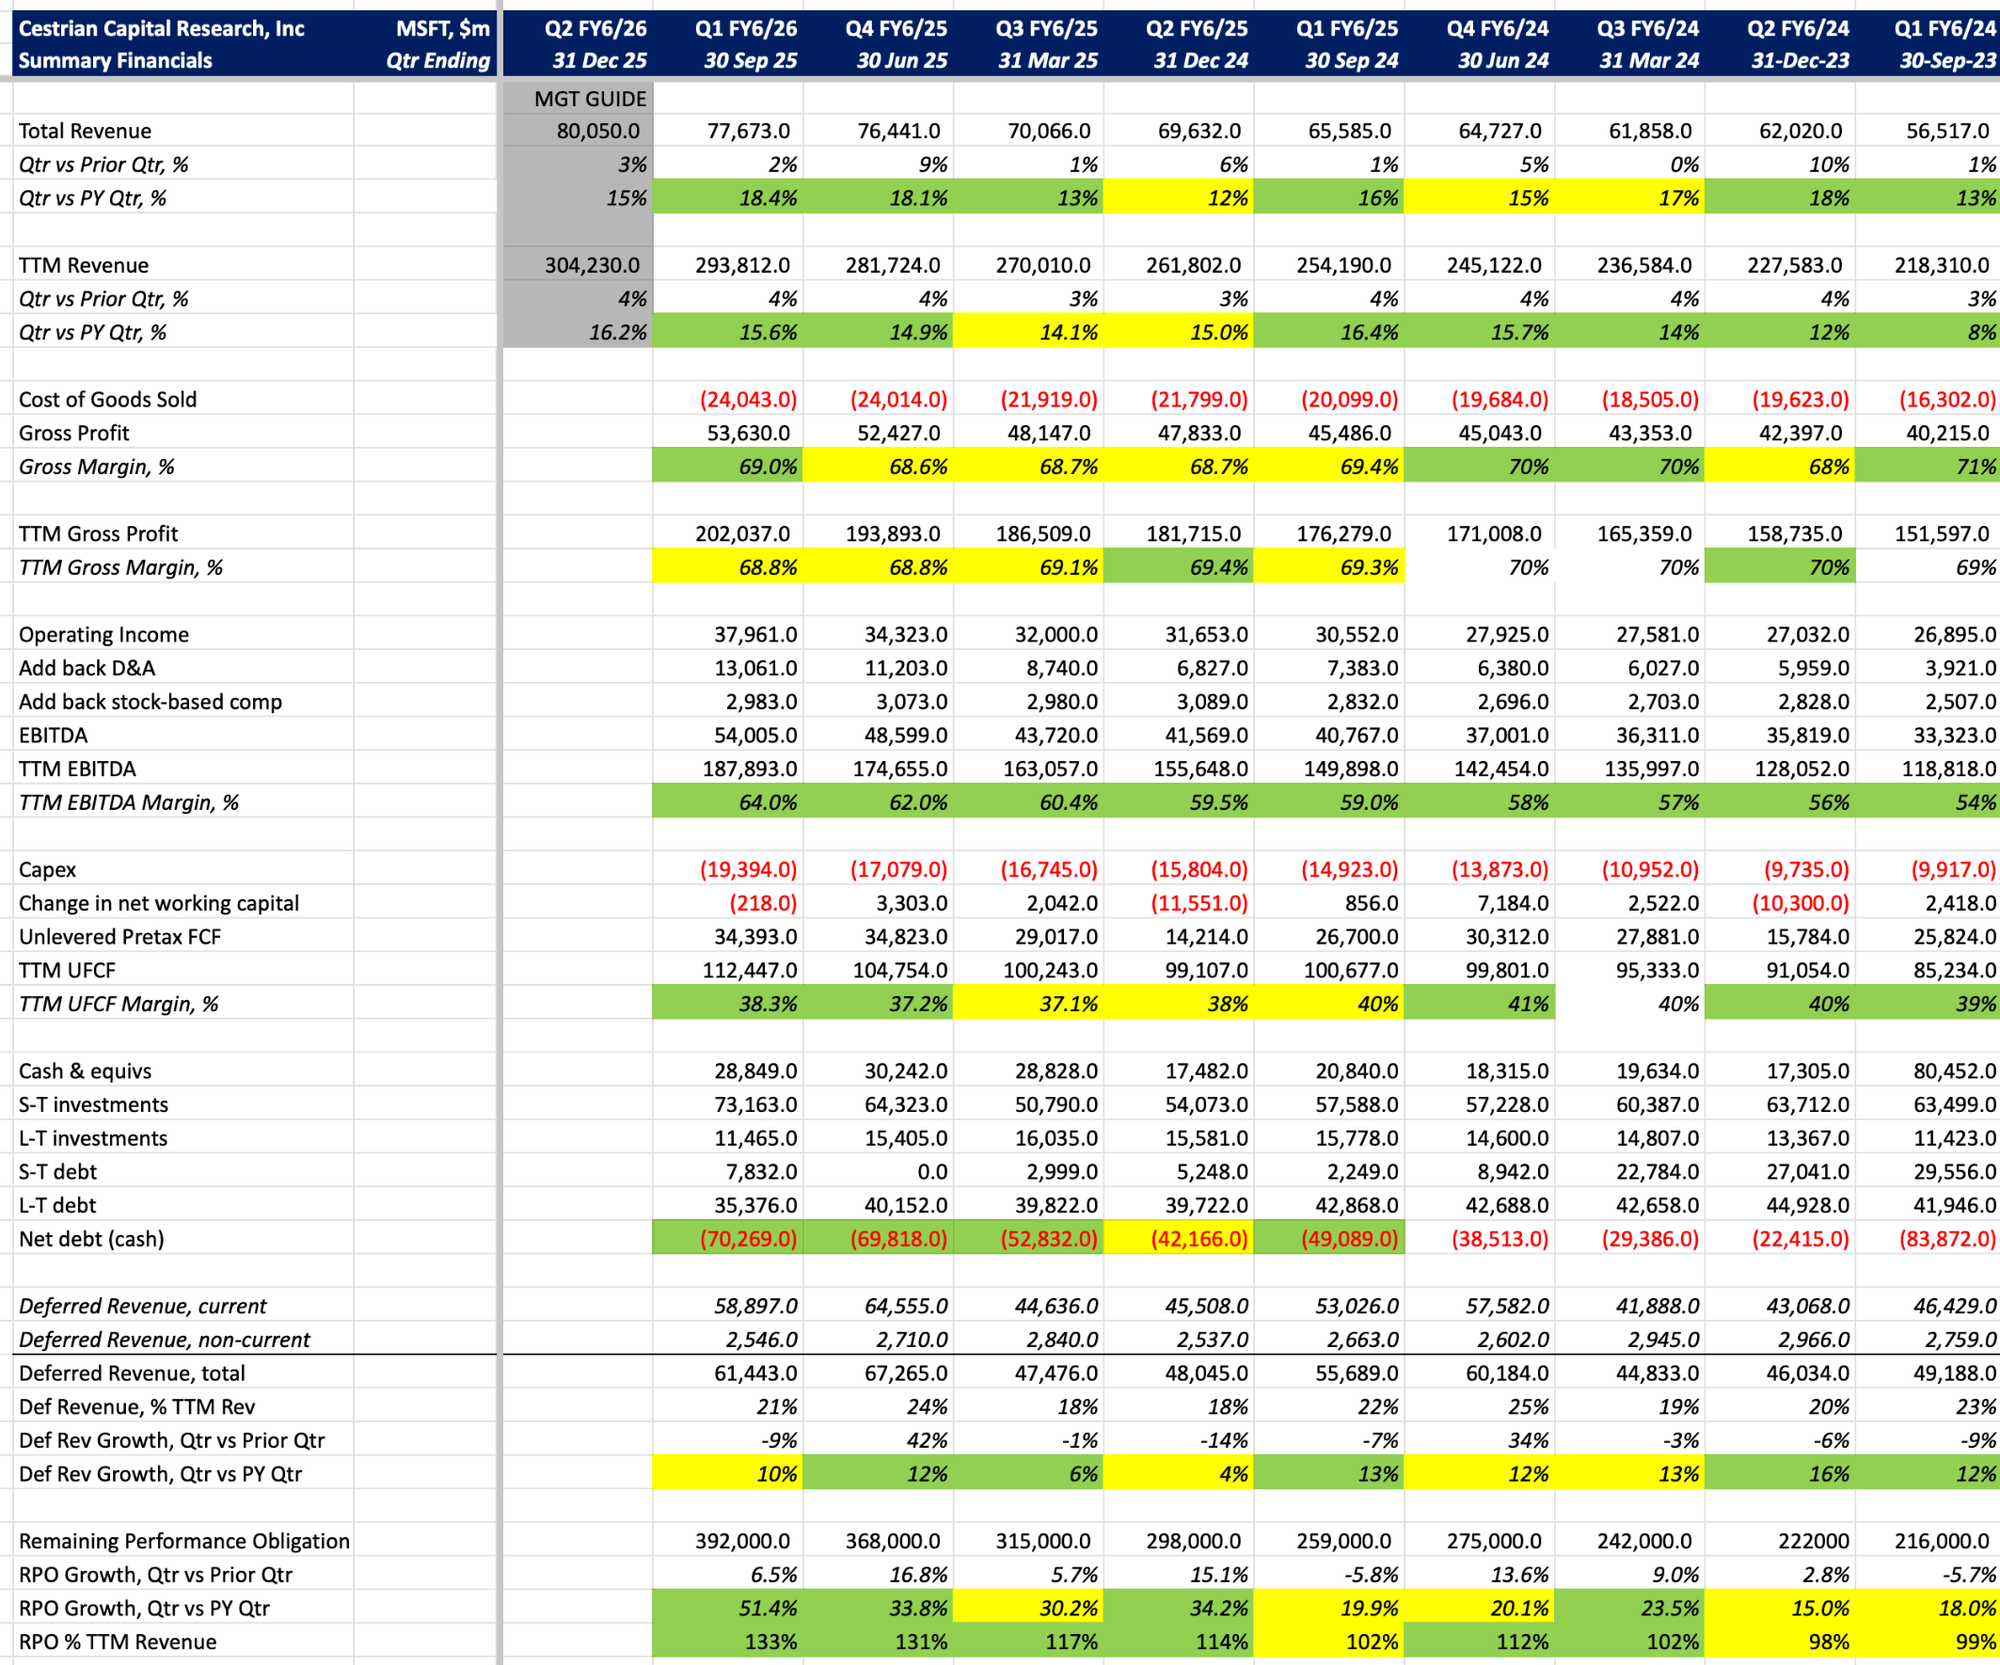
Here’s the headline numbers.
Summary Fundamentals
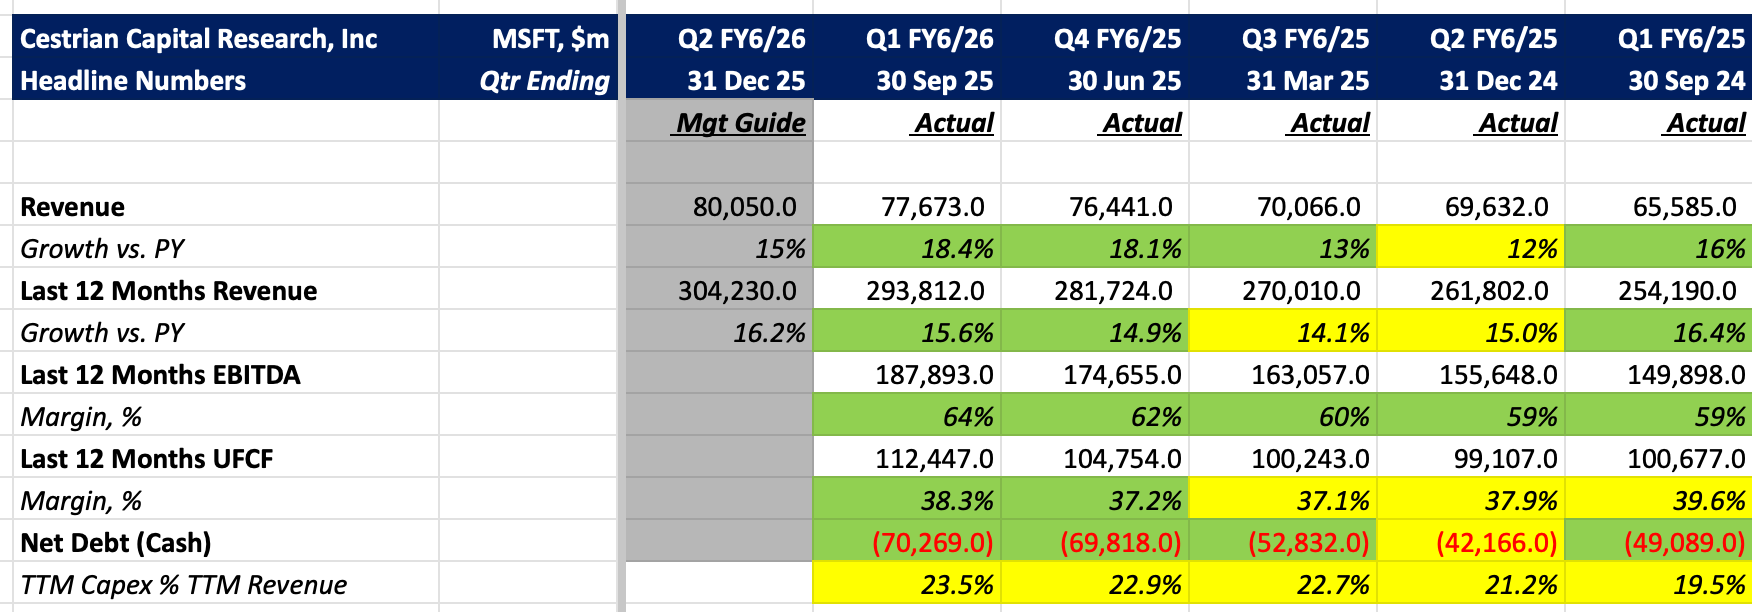
Let's recap.
- Revenue growth accelerated to +18.4% YoY for the quarter and +15.6% on a TTM vs. prior year TTM basis. Bear in mind this is a company with almost $300bn of TTM revenue so these growth numbers are truly remarkable.
- TTM EBITDA margins ticked up further to +64%.
- Unlevered pretax FCF margins - that’s after capex - ticked up to 38%. That’s a comparable level of cashflow margin to 2018-2019 when the company’s capex was half the % of revenue it is today. Remarkable.
- The balance sheet strengthened further to $70bn net cash.
- You can see this below in the full numbers but also remarkable is that remaining performance obligation - the order book - grew >50% year on year to a total of $392bn, representing some 1.3x TTM revenue.
This company is in great shape. The stock will do what the stock does - when the market rolls over so too will $MSFT - but the actual business? Incredibly strong and, I believe, well managed vs. its hyperscaler peers.
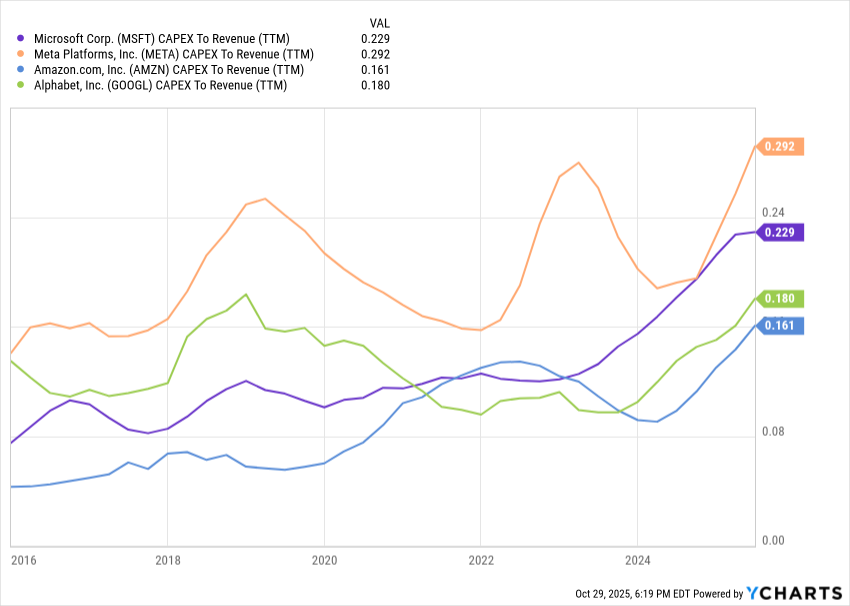
MSFT vs. Peers - TTM Capex % TTM Revenue
META looks out of control, it should be said, with the drunken-sailor spending.
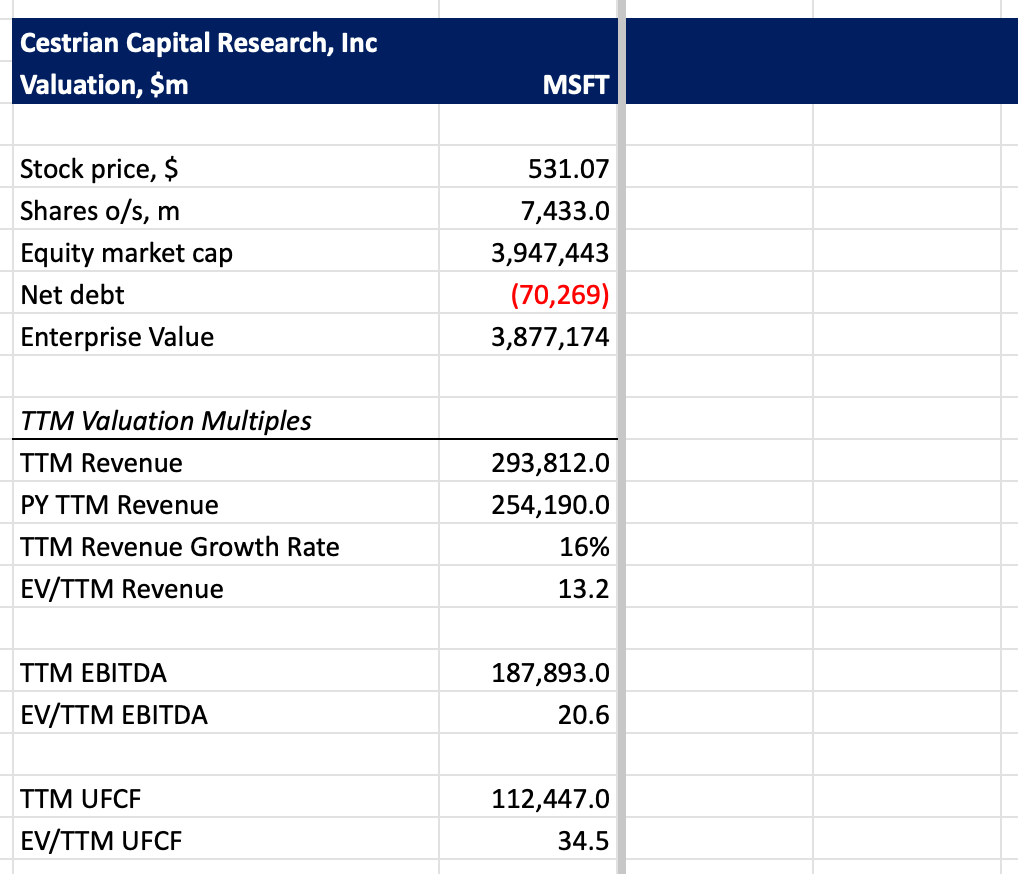
Valuation
I do not believe this is a big price for this company in this market.
Stock Chart And Price Outlook
Here’s how the chart looks to my eyes. You can open a full page version, here.
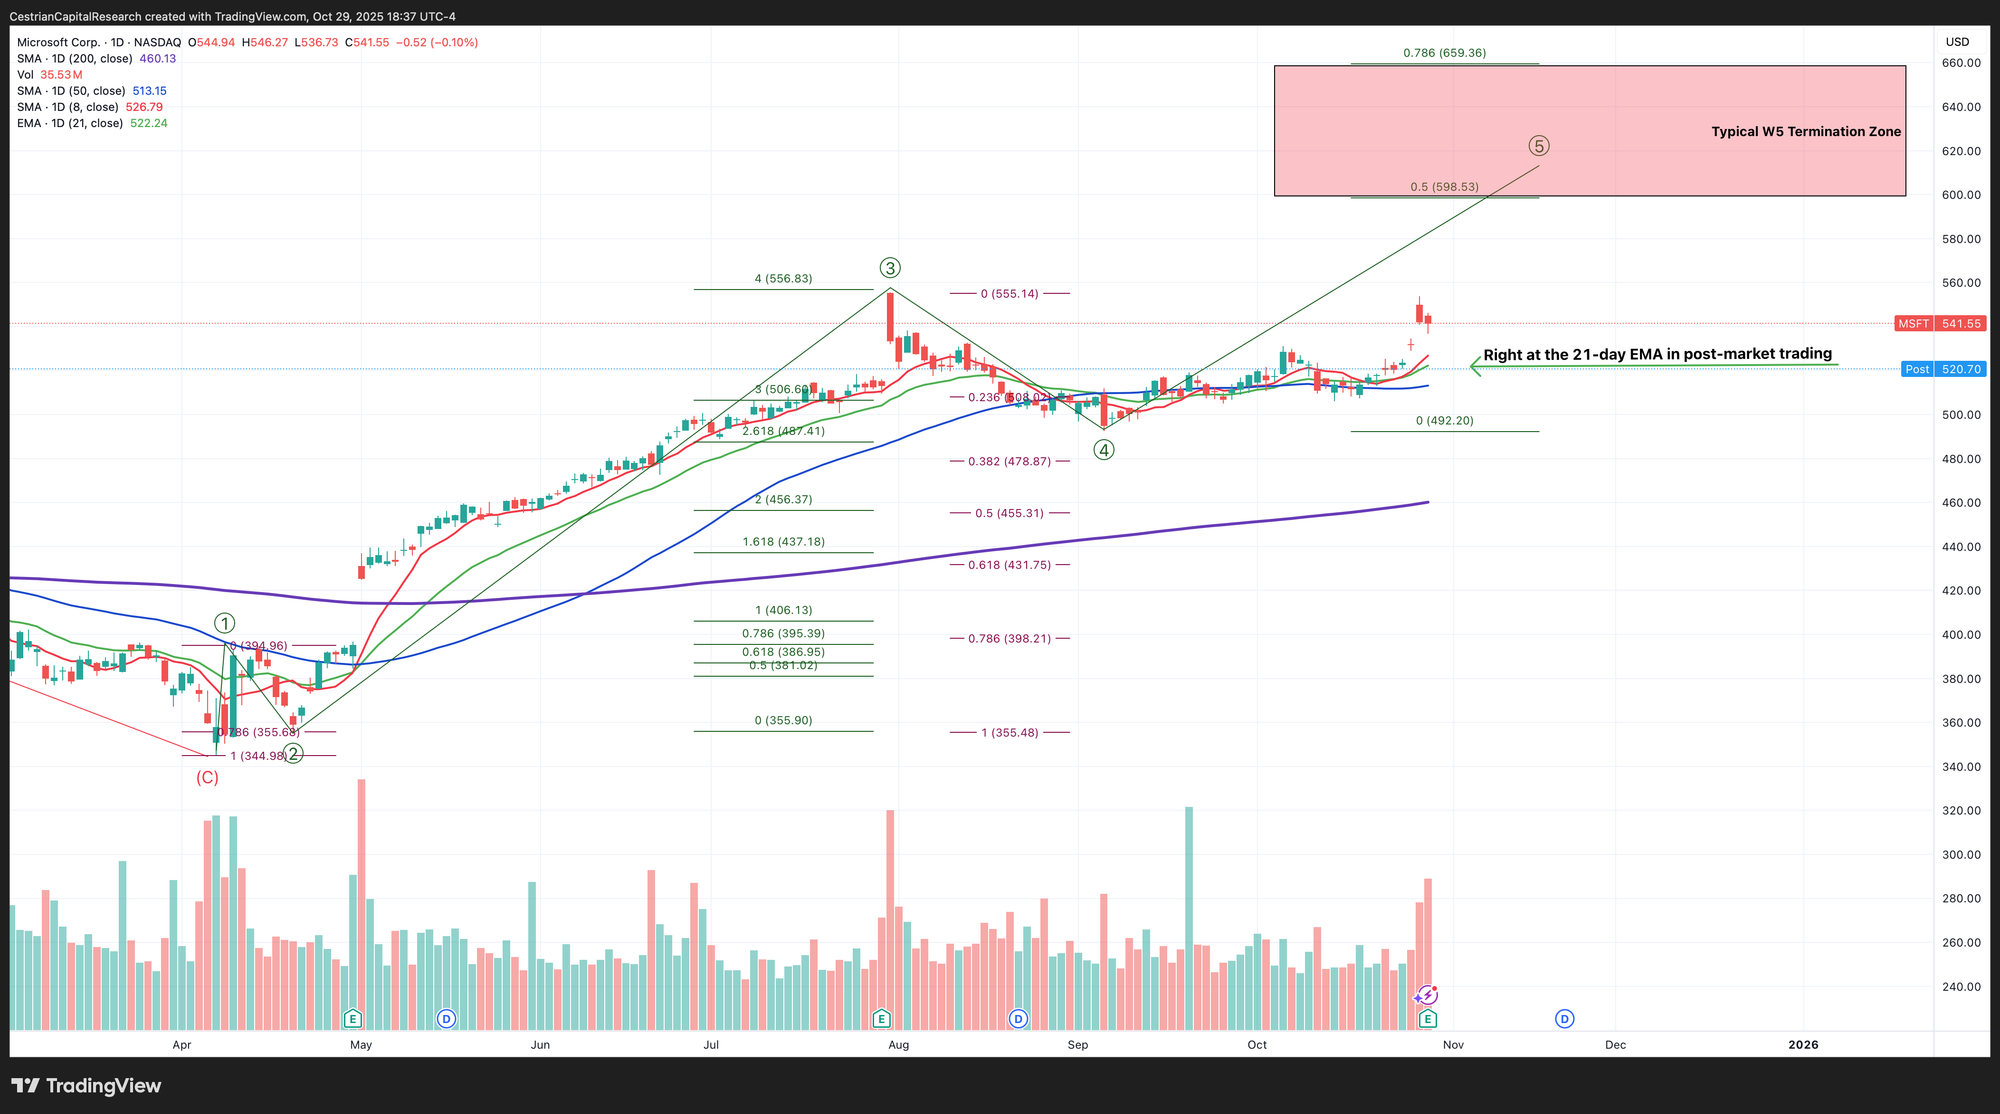
The key level the stock has to hold tomorrow is $521, which is the 21-day EMA (green line). Below that and it can fall significantly further. Above that, bullish with a target between $598-659.
Here's the medium term chart. You can reach the full page version here.
Appendix: Detailed Fundamentals
We've had the stock at Distribute since August 1st when it entered our bull target termination zone. With solid numbers and a direction yet to be determined following earnings, we now rate the stock as Do Nothing.
Cestrian Capital Research, Inc - 29 October 2025.
DISCLOSURE: Cestrian Capital Research, Inc staff personal accounts hold long position(s) in $MSFT.