
NO PAYWALL VERSION: Market On Open, Monday 22 September

DISCLAIMER: This note is intended for US recipients only and, in particular, is not directed at, nor intended to be relied upon by any UK recipients. Any information or analysis in this note is not an offer to sell or the solicitation of an offer to buy any securities. Nothing in this note is intended to be investment advice and nor should it be relied upon to make investment decisions. Read our full disclaimer, here.
Eyes On Year End
by Alex King, CEO, Cestrian Capital Research, Inc
We have a few days left of Q3, during which time the market has to digest a huge run up of late and in particular it has to decide what it thinks of the Fed rate cut last week. So far the S&P is up around 12-13% for the year which is unremarkable for a bull market. The sentiment that says “sure this rally has to take a breather soon” arises from the brain anchoring the April lows as time=0. If the brain focused on January 1 as time=0 then it wouldn’t fall prey to rising fear; instead it would say, well, not much of a bull so far in 2025, probably there is more to come.
And that in short is our house view. Yes, there will be pullbacks and yes, one is overdue, but under this most pro-market of Administrations I would expect yet more upside still.
Now let’s get to work with our daily market analysis. This is a cut-down version of the note available every day to our Inner Circle members. In the full note, we cover the S&P500, the Nasdaq-100, the Dow, tech, semiconductor, Ether, bonds, oil and volatility.

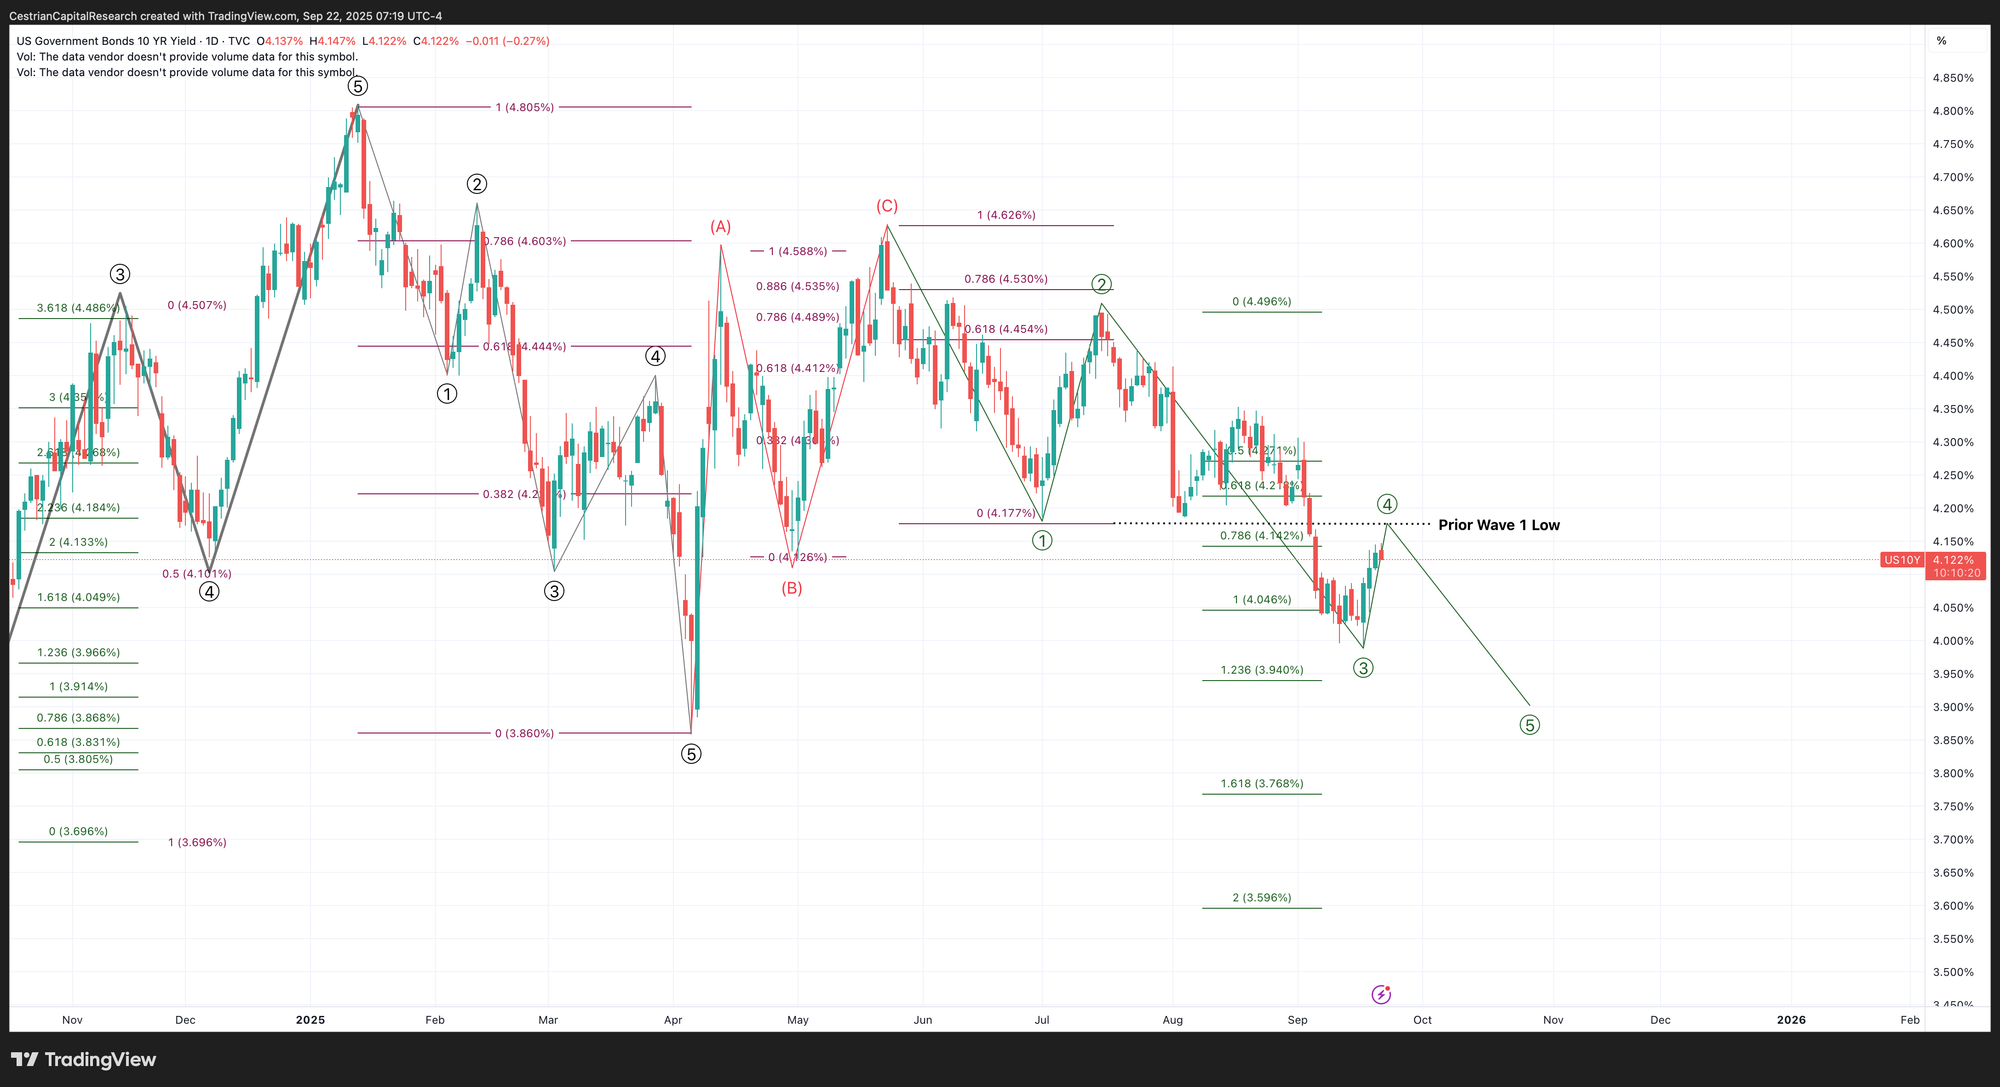
US 10-Year Yield
Equity Volatility
Still just tumbleweed in the Vix.
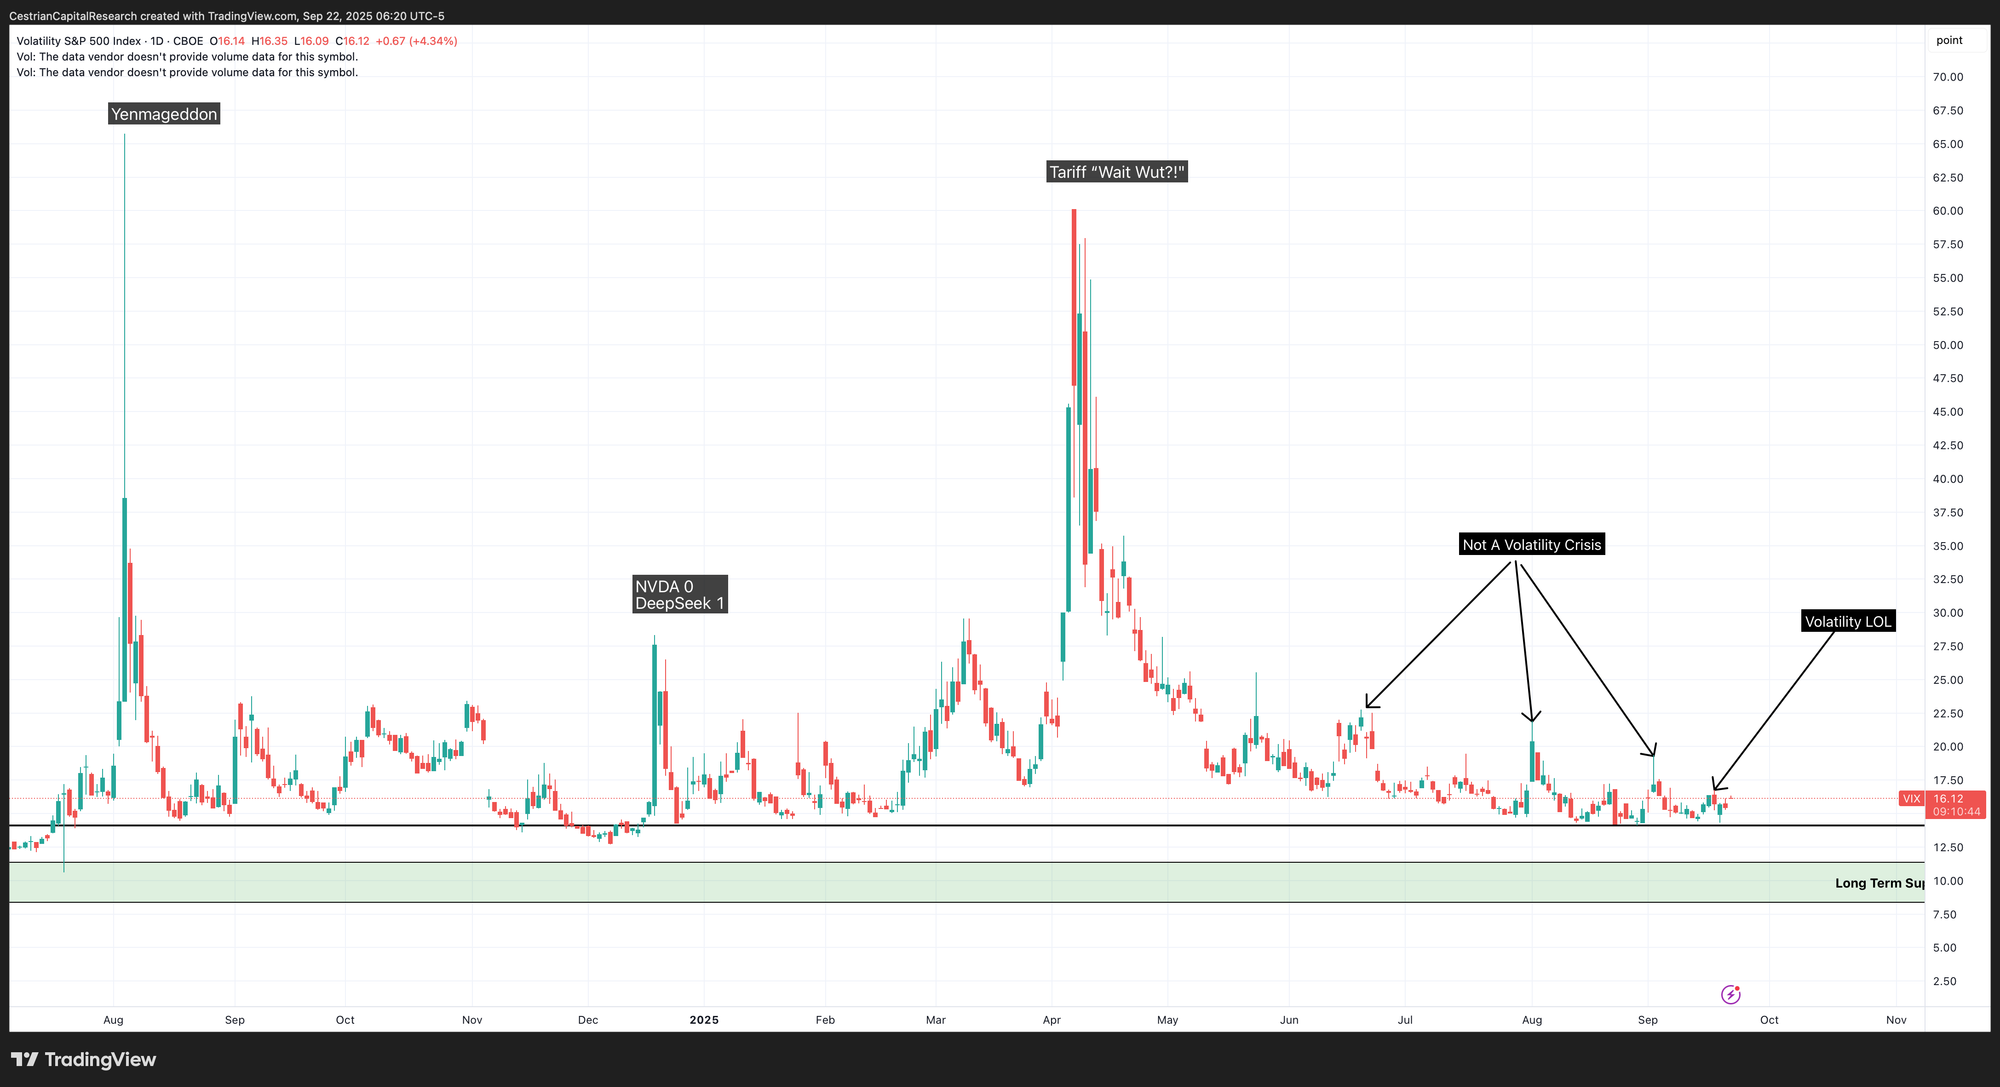
Disclosure: No position in any Vix-based securities.
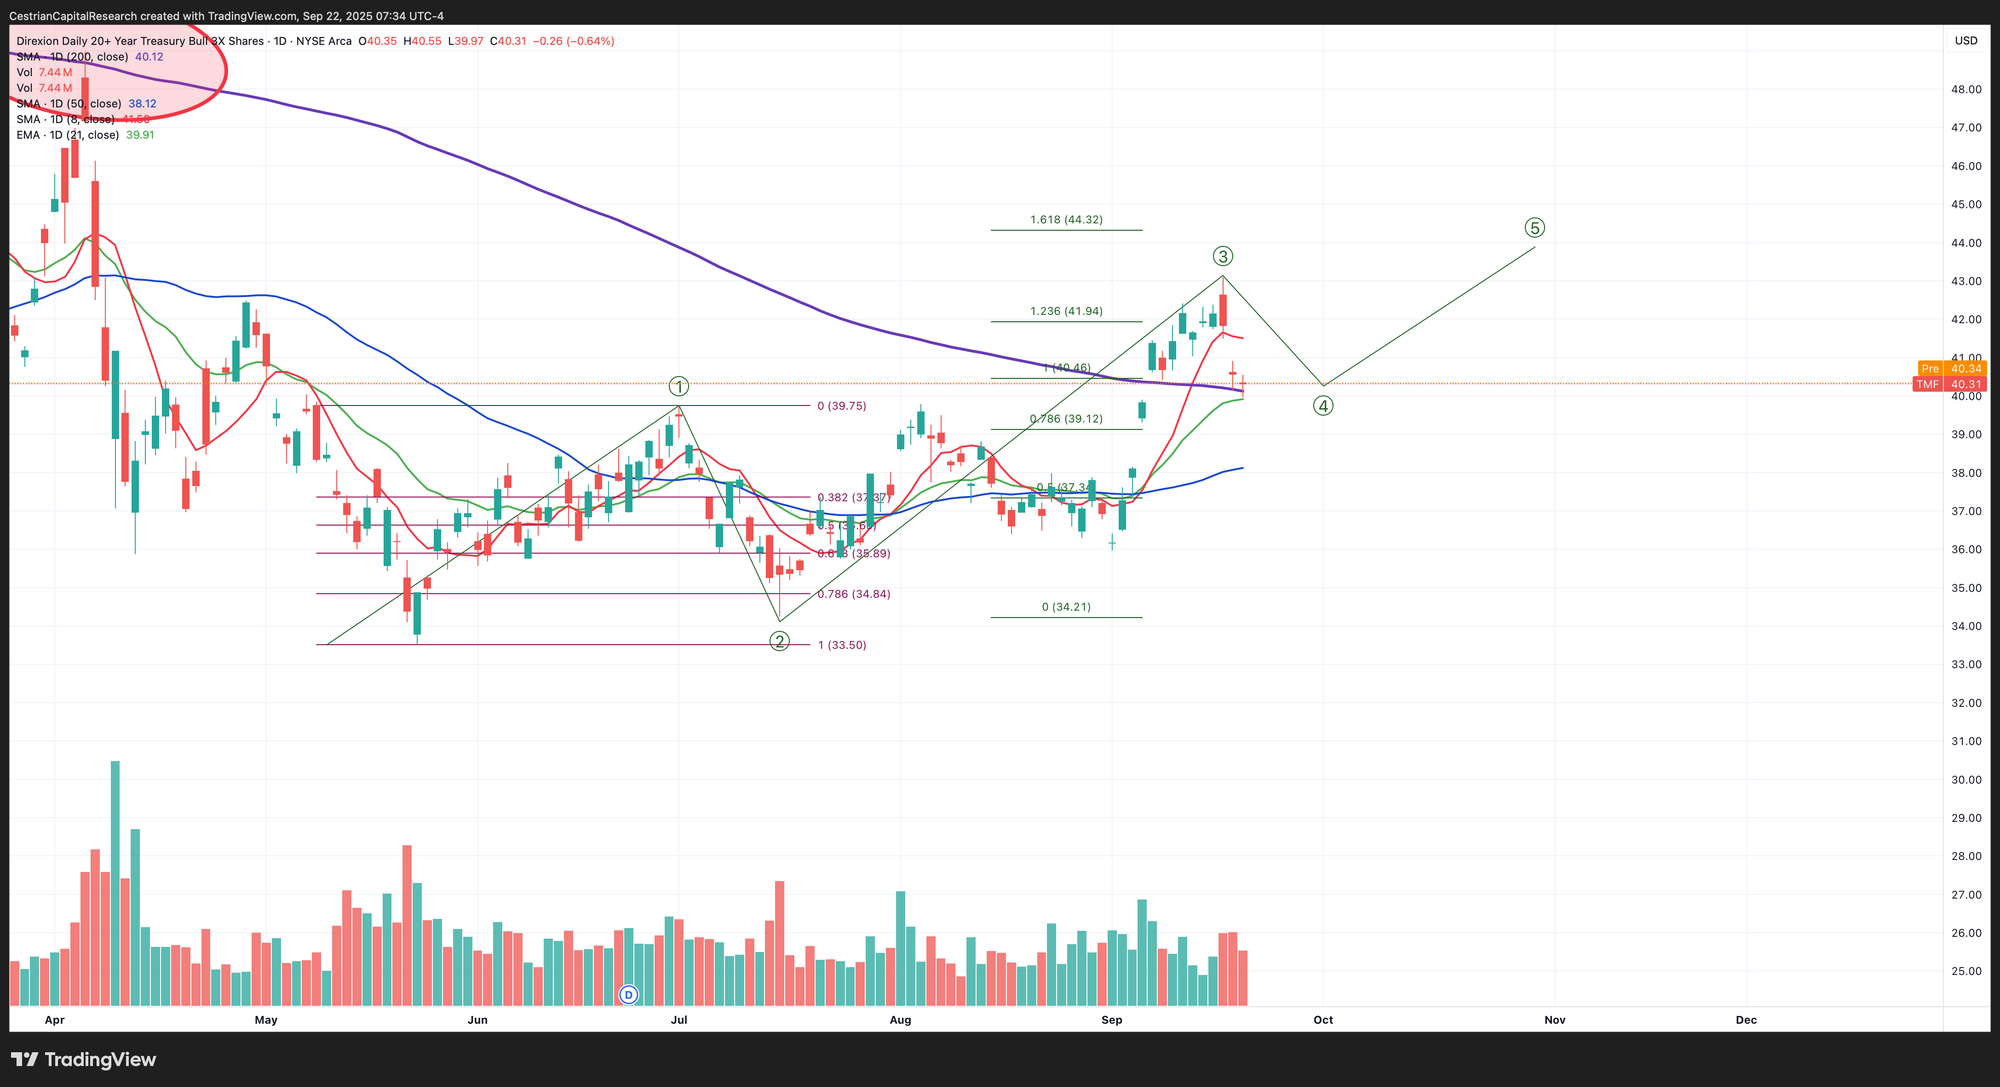
Longer-Term Treasury Bonds (TLT / TMF)
No change.
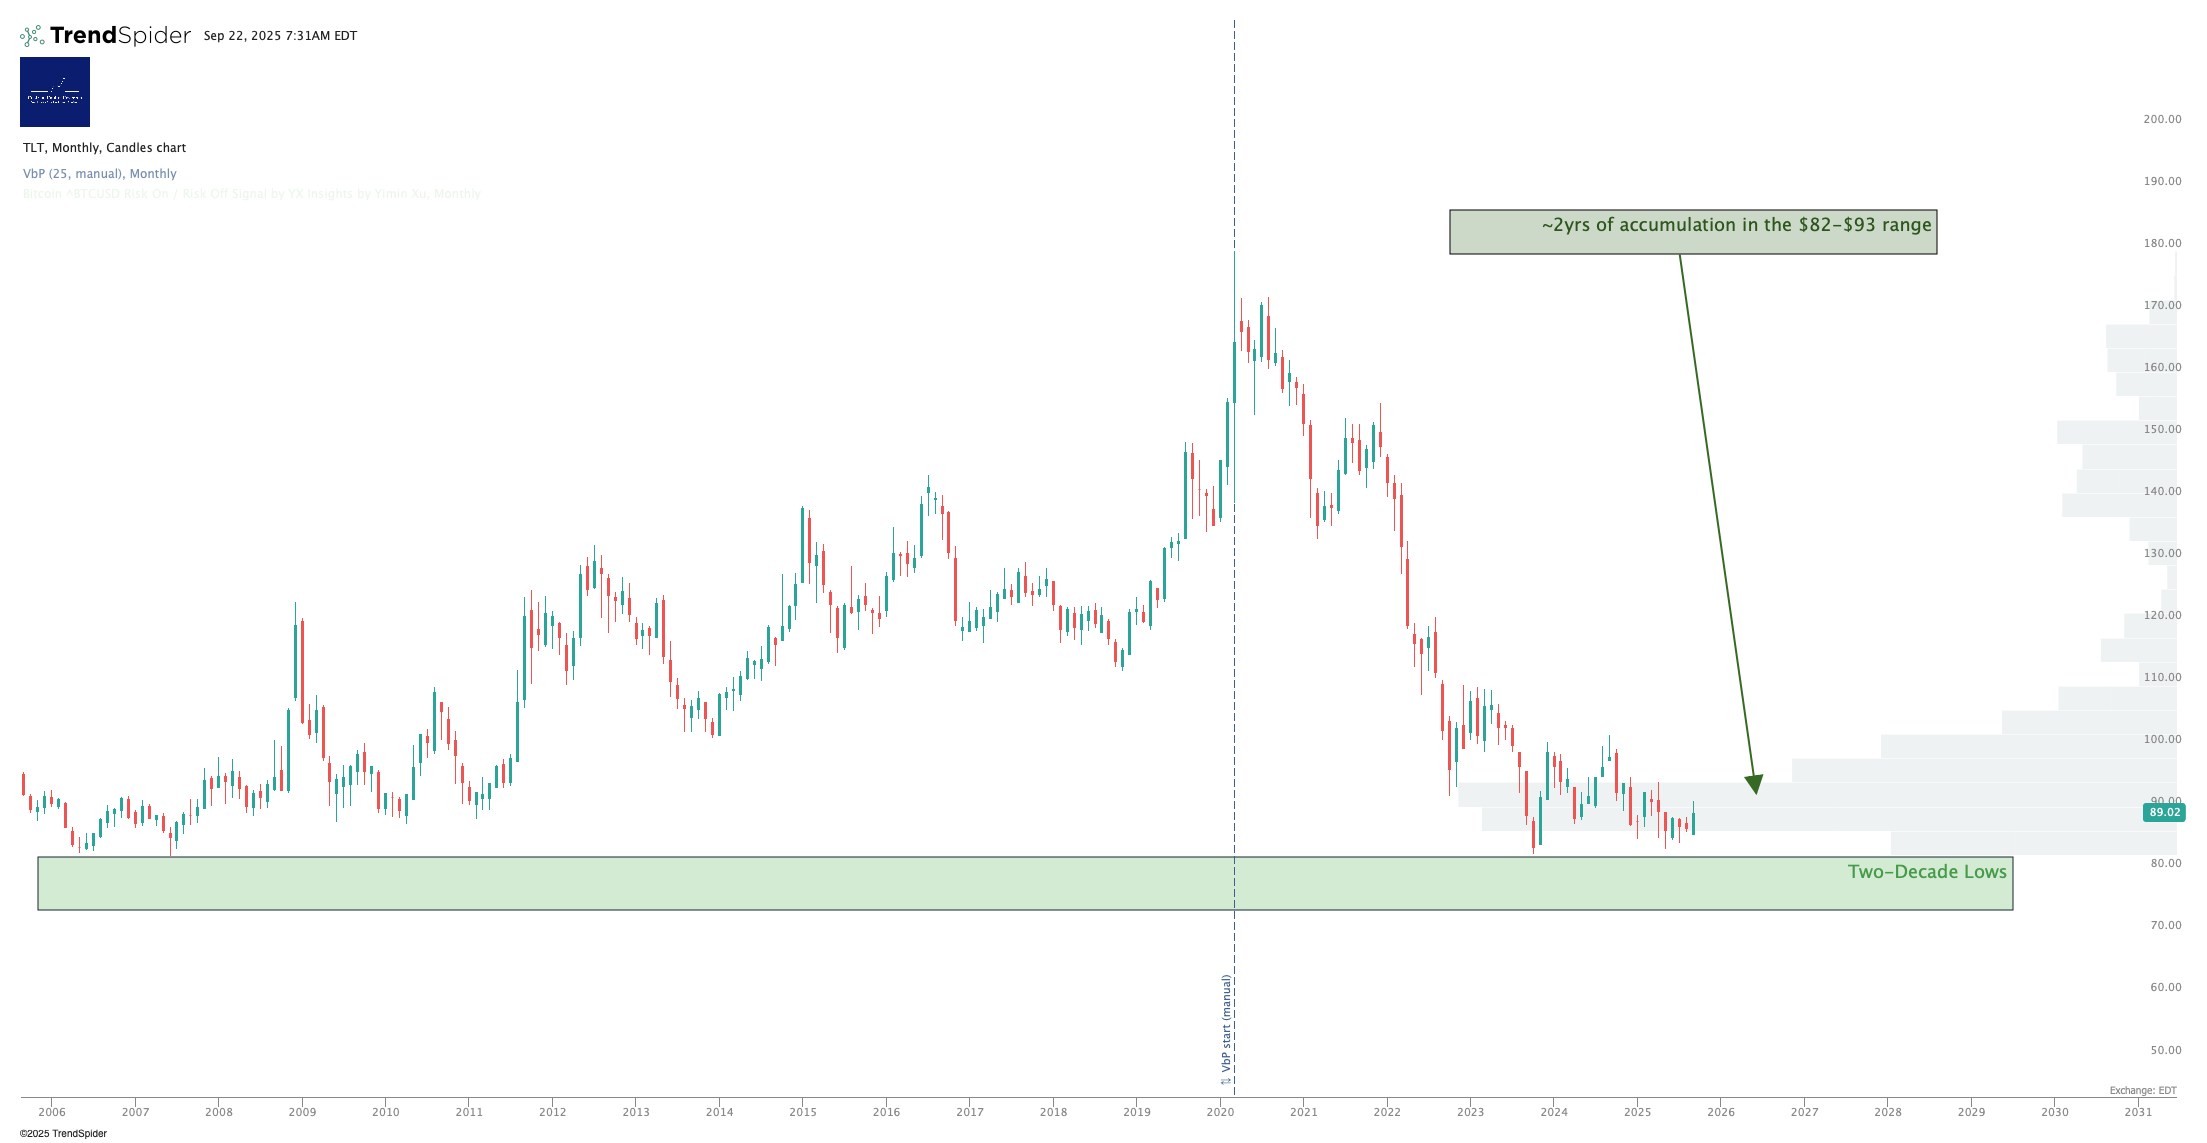
Bullish if over the 200-day moving average (the thick purple line).
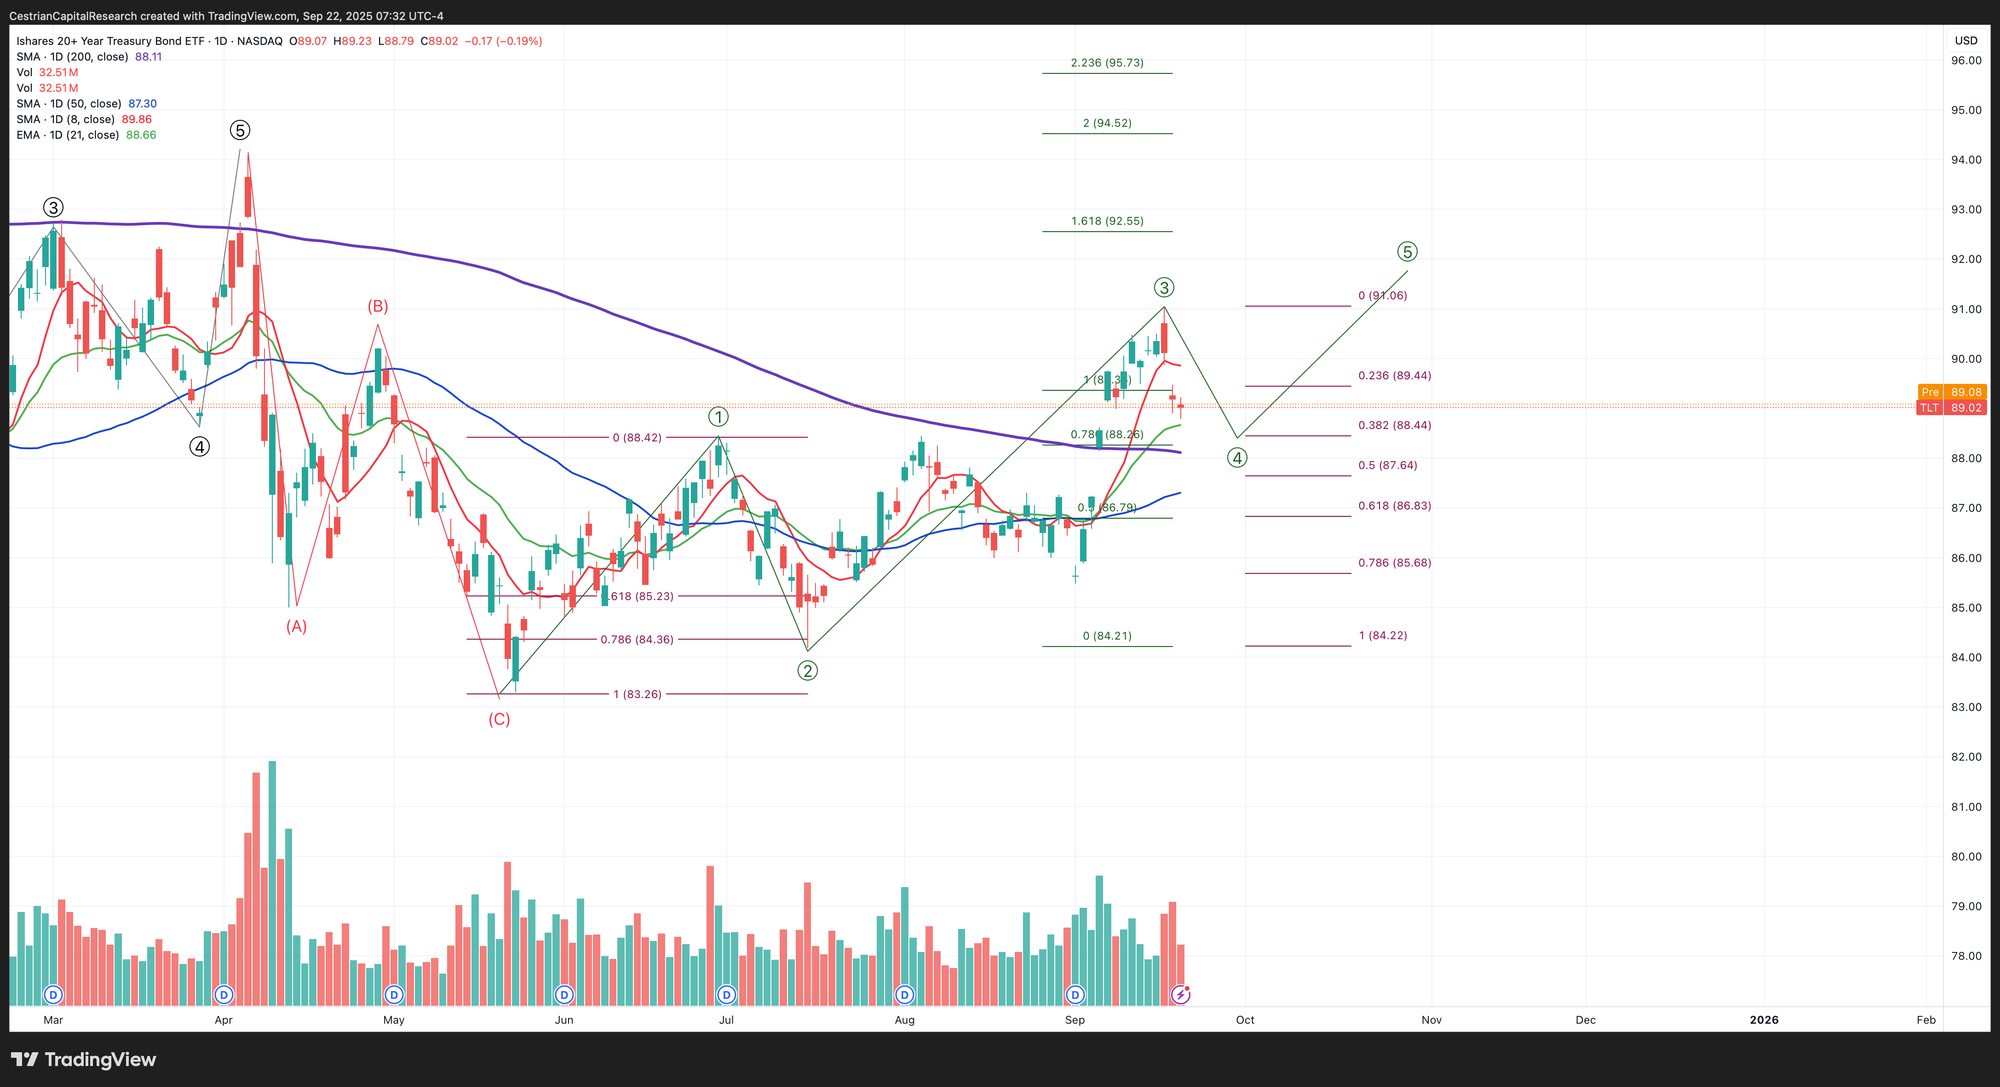
Note - Leveraged ETF. Read the fund documentation if you are considering using this instrument.
Disclosure: I am unhedged long $TLT and similar EU UCITS ETFs.
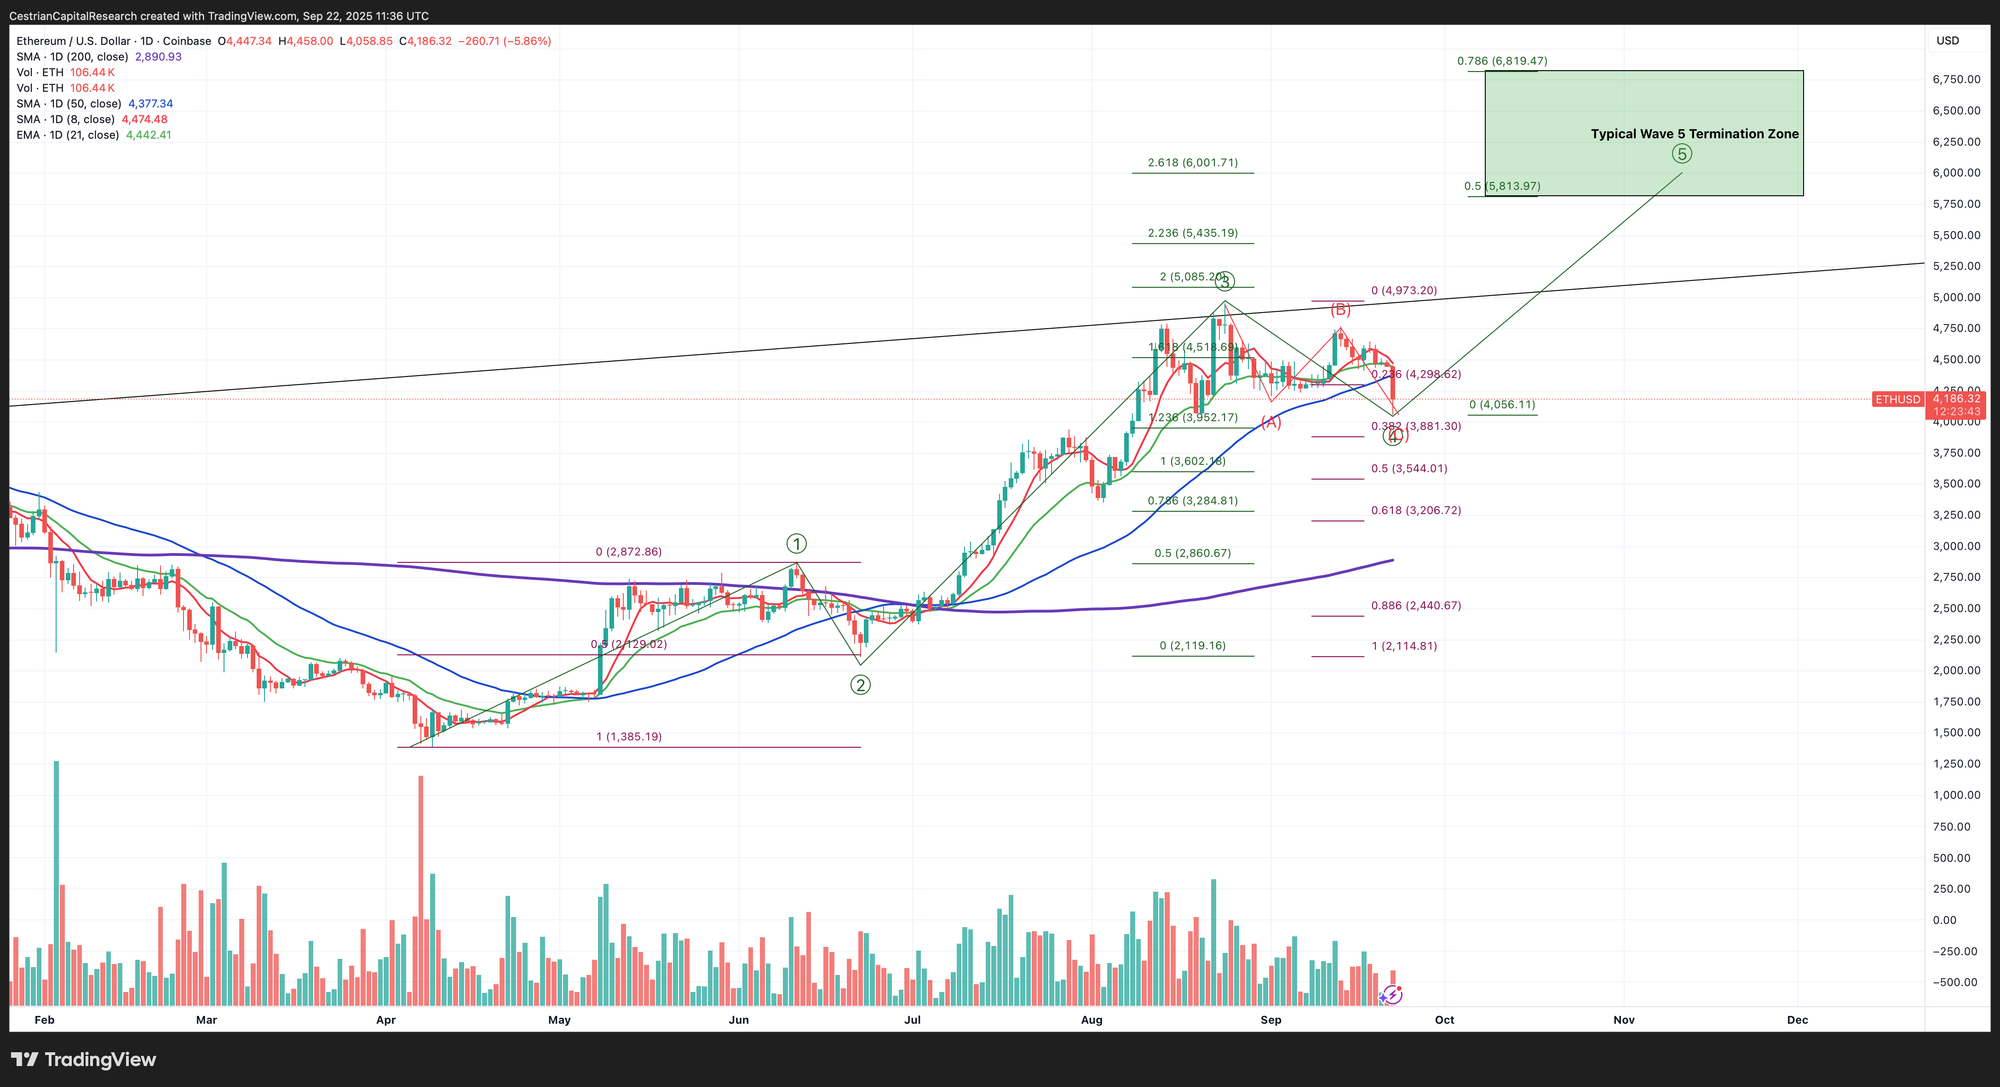
Ether
New chart to account for the drop this morning. Looks like a C-wave into a Wave 4 low. For now this remains a bullish chart - reduced target price a little to reflect today’s move.
If you’d like to have AI help you to trade Ether, Bitcoin, Solana and key crypto-centric stocks, take a look at our Big Money Crypto algorithmic signals, here (independent investors) and here (investment professionals).
Disclosure - Long $ETHA and others in the Ether complex.
Oil (USO / WTI / UCO)
Still rangebound.
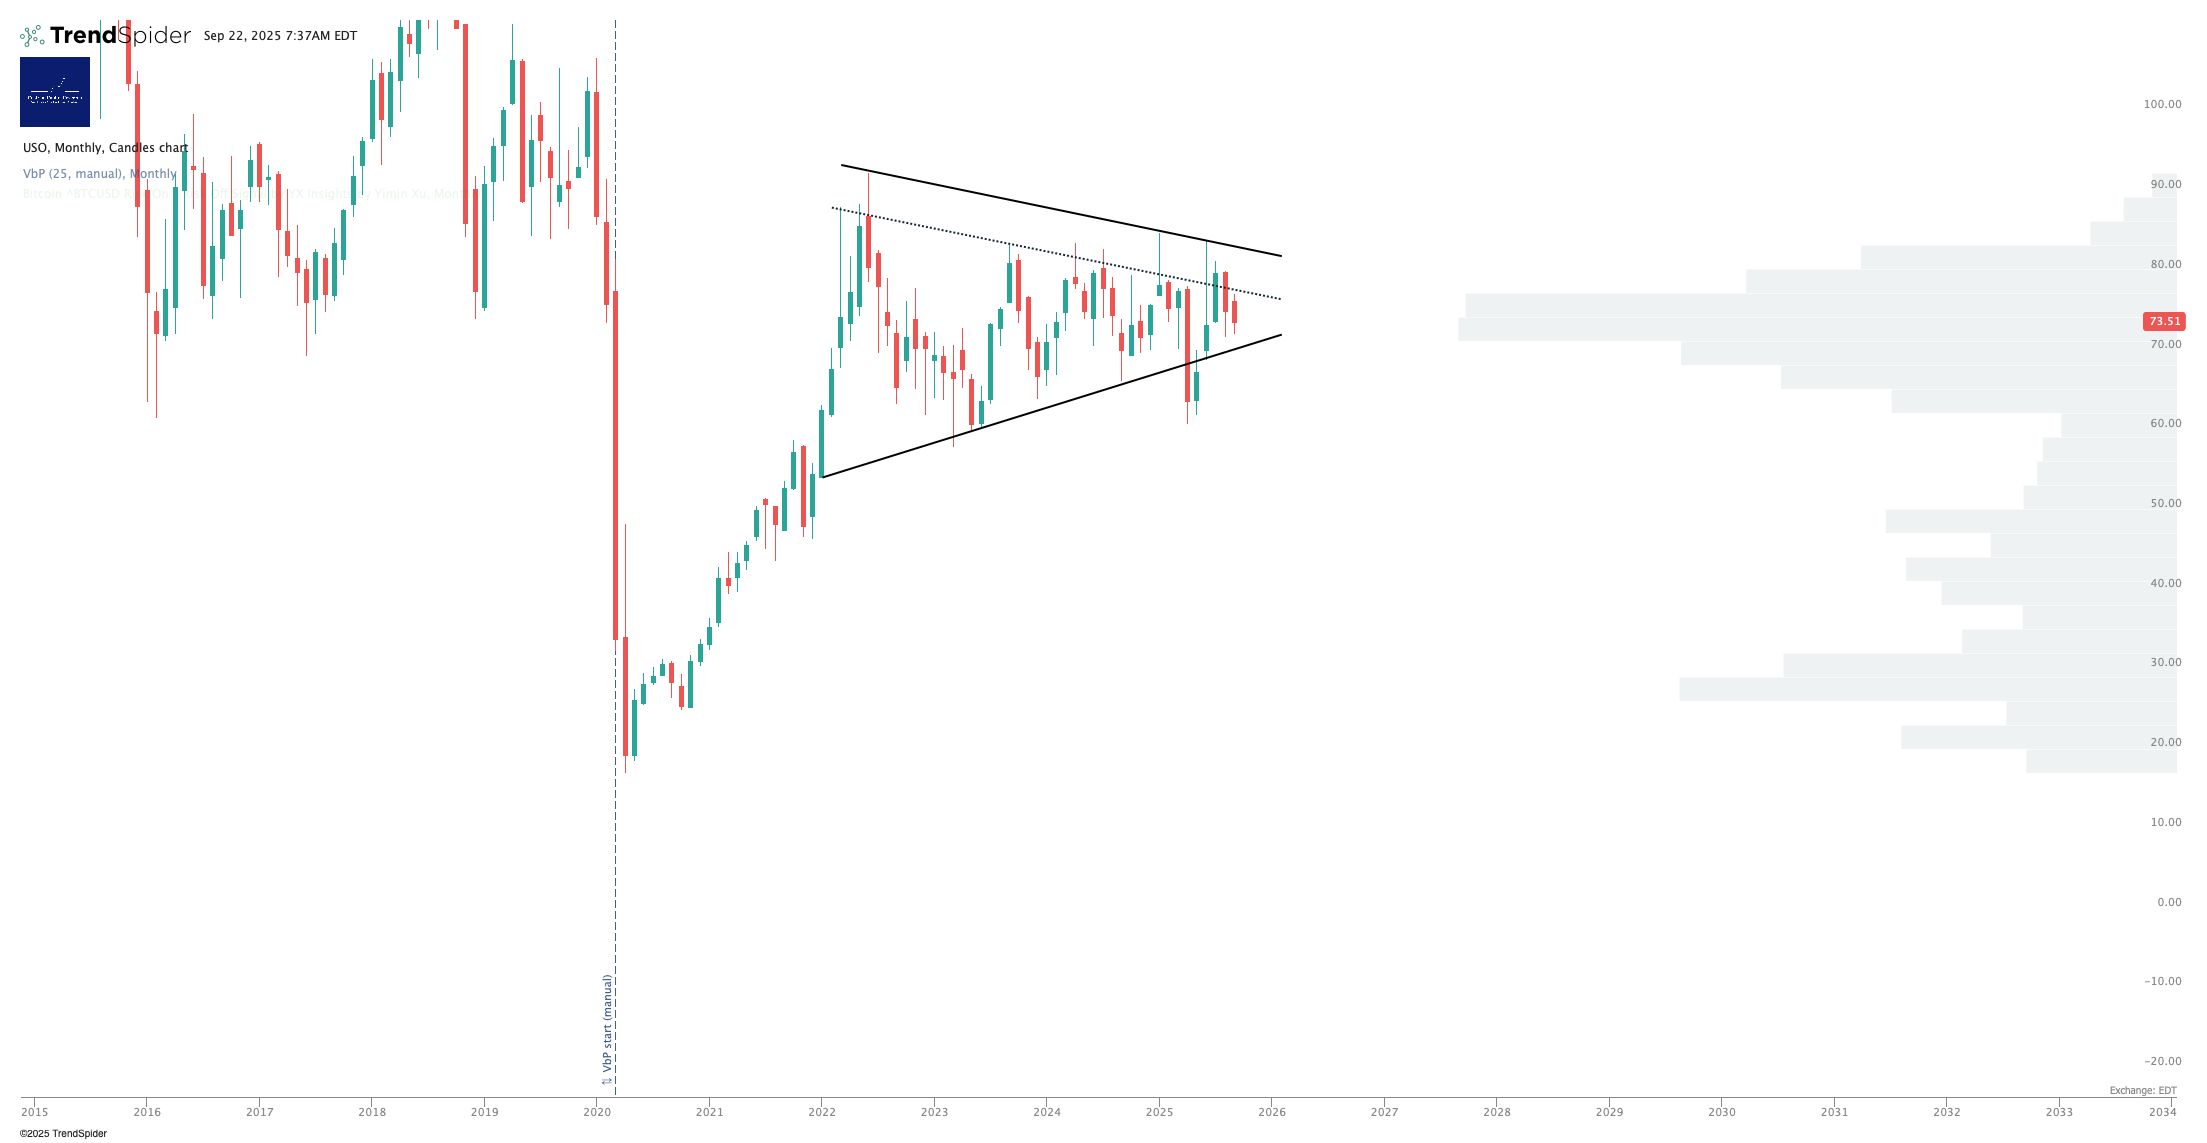
TO REPEAT: I think this chart suggests going long oil with a stop a little below that green support line is a good idea (if you trade ETFs, you can use USO or UCO but watch CL levels to stop out).
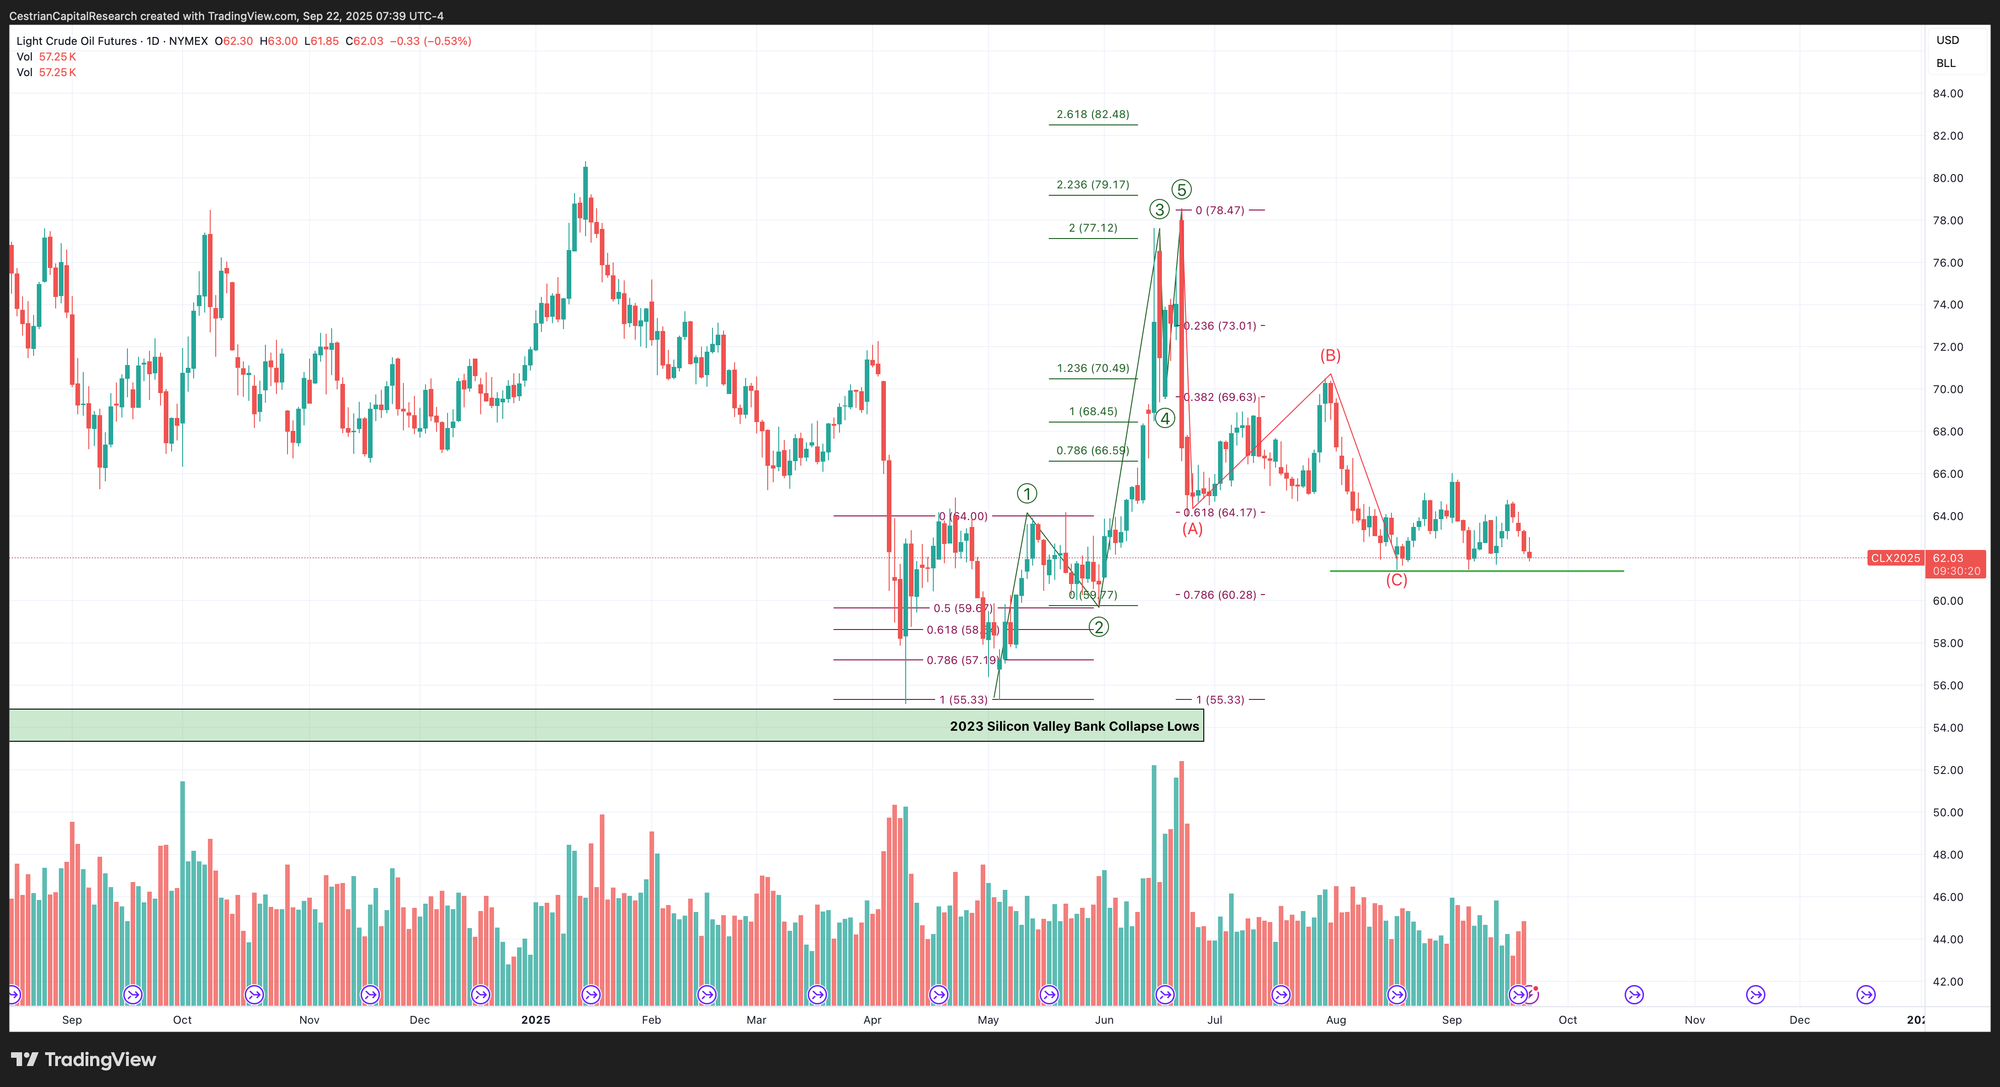
2x Levered Long (UCO) / Short (SCO)
Note - Leveraged ETF. Read the fund documentation if you are considering using this instrument.
UCO is testing the lower support trendline.
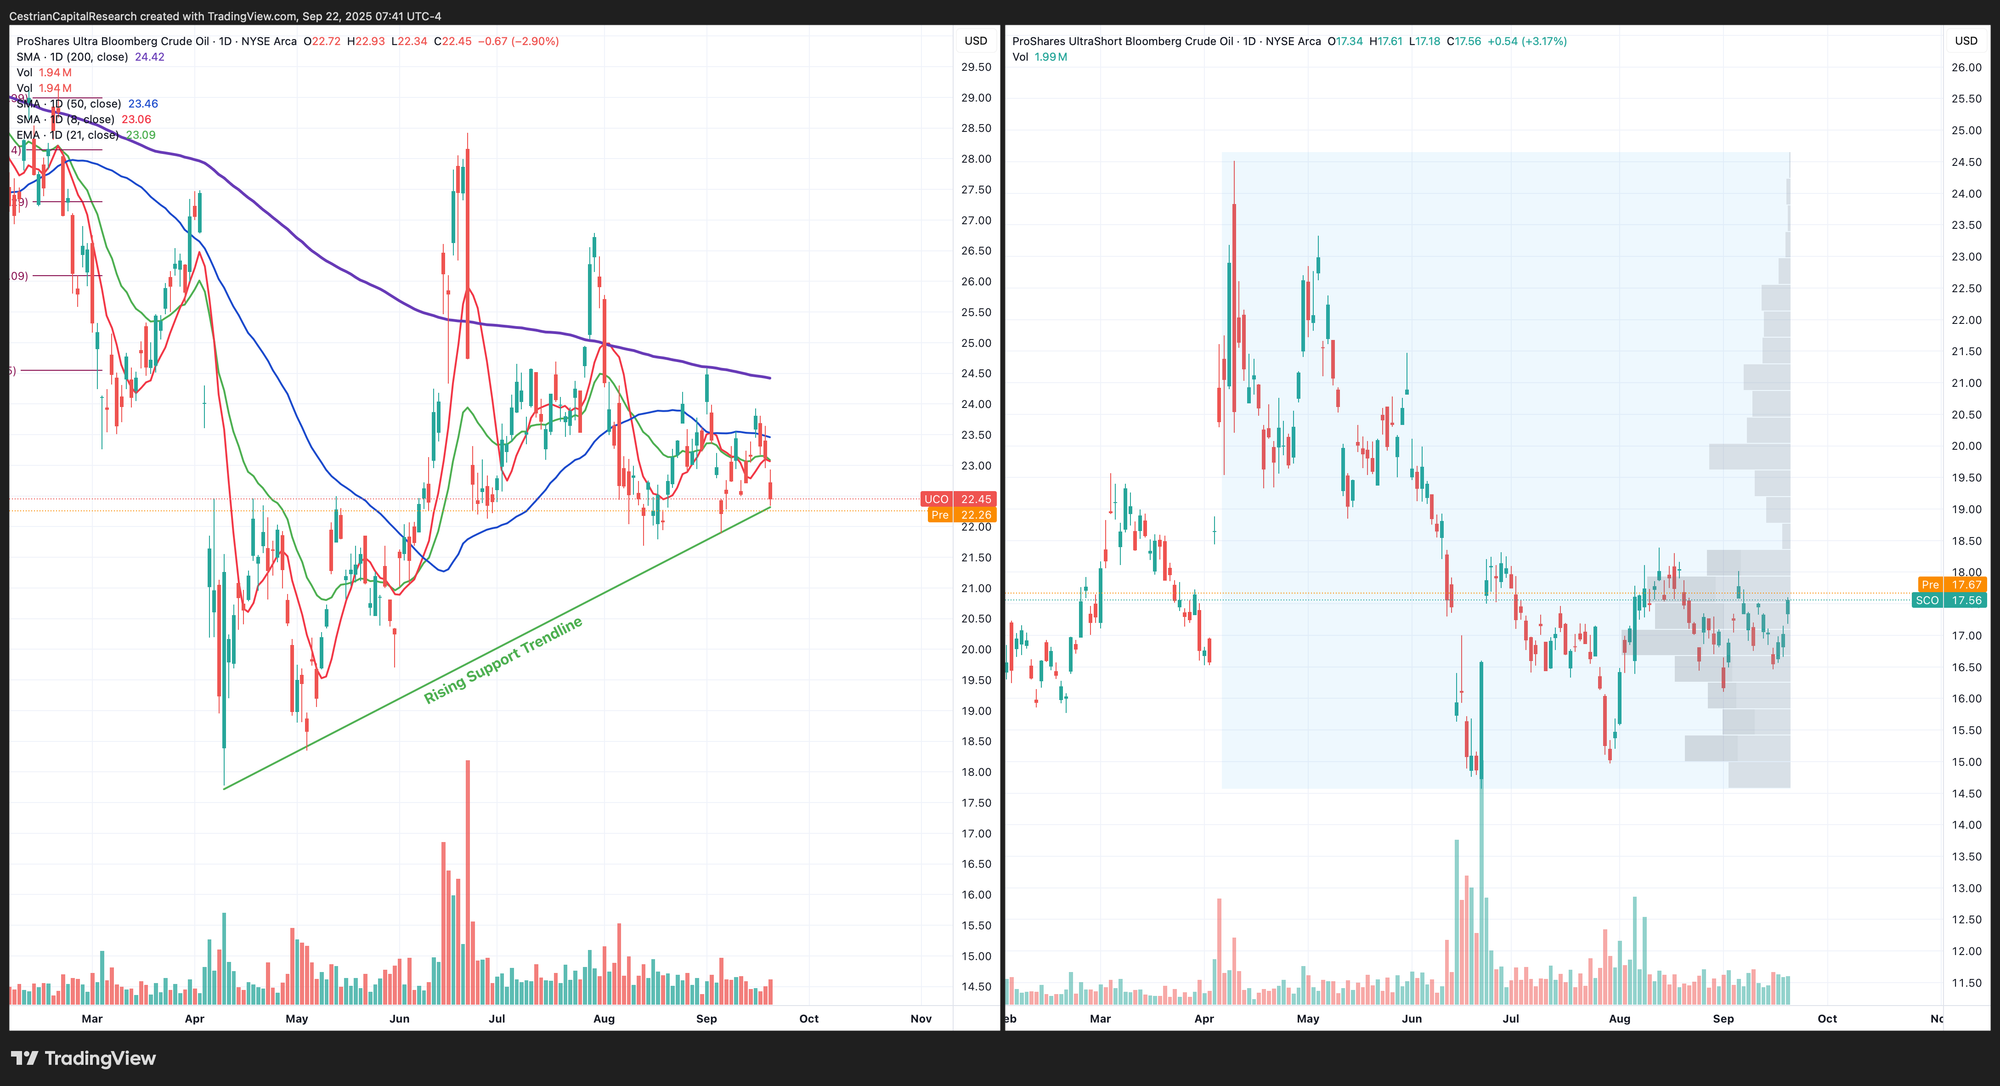
Disclosure: No position in oil.
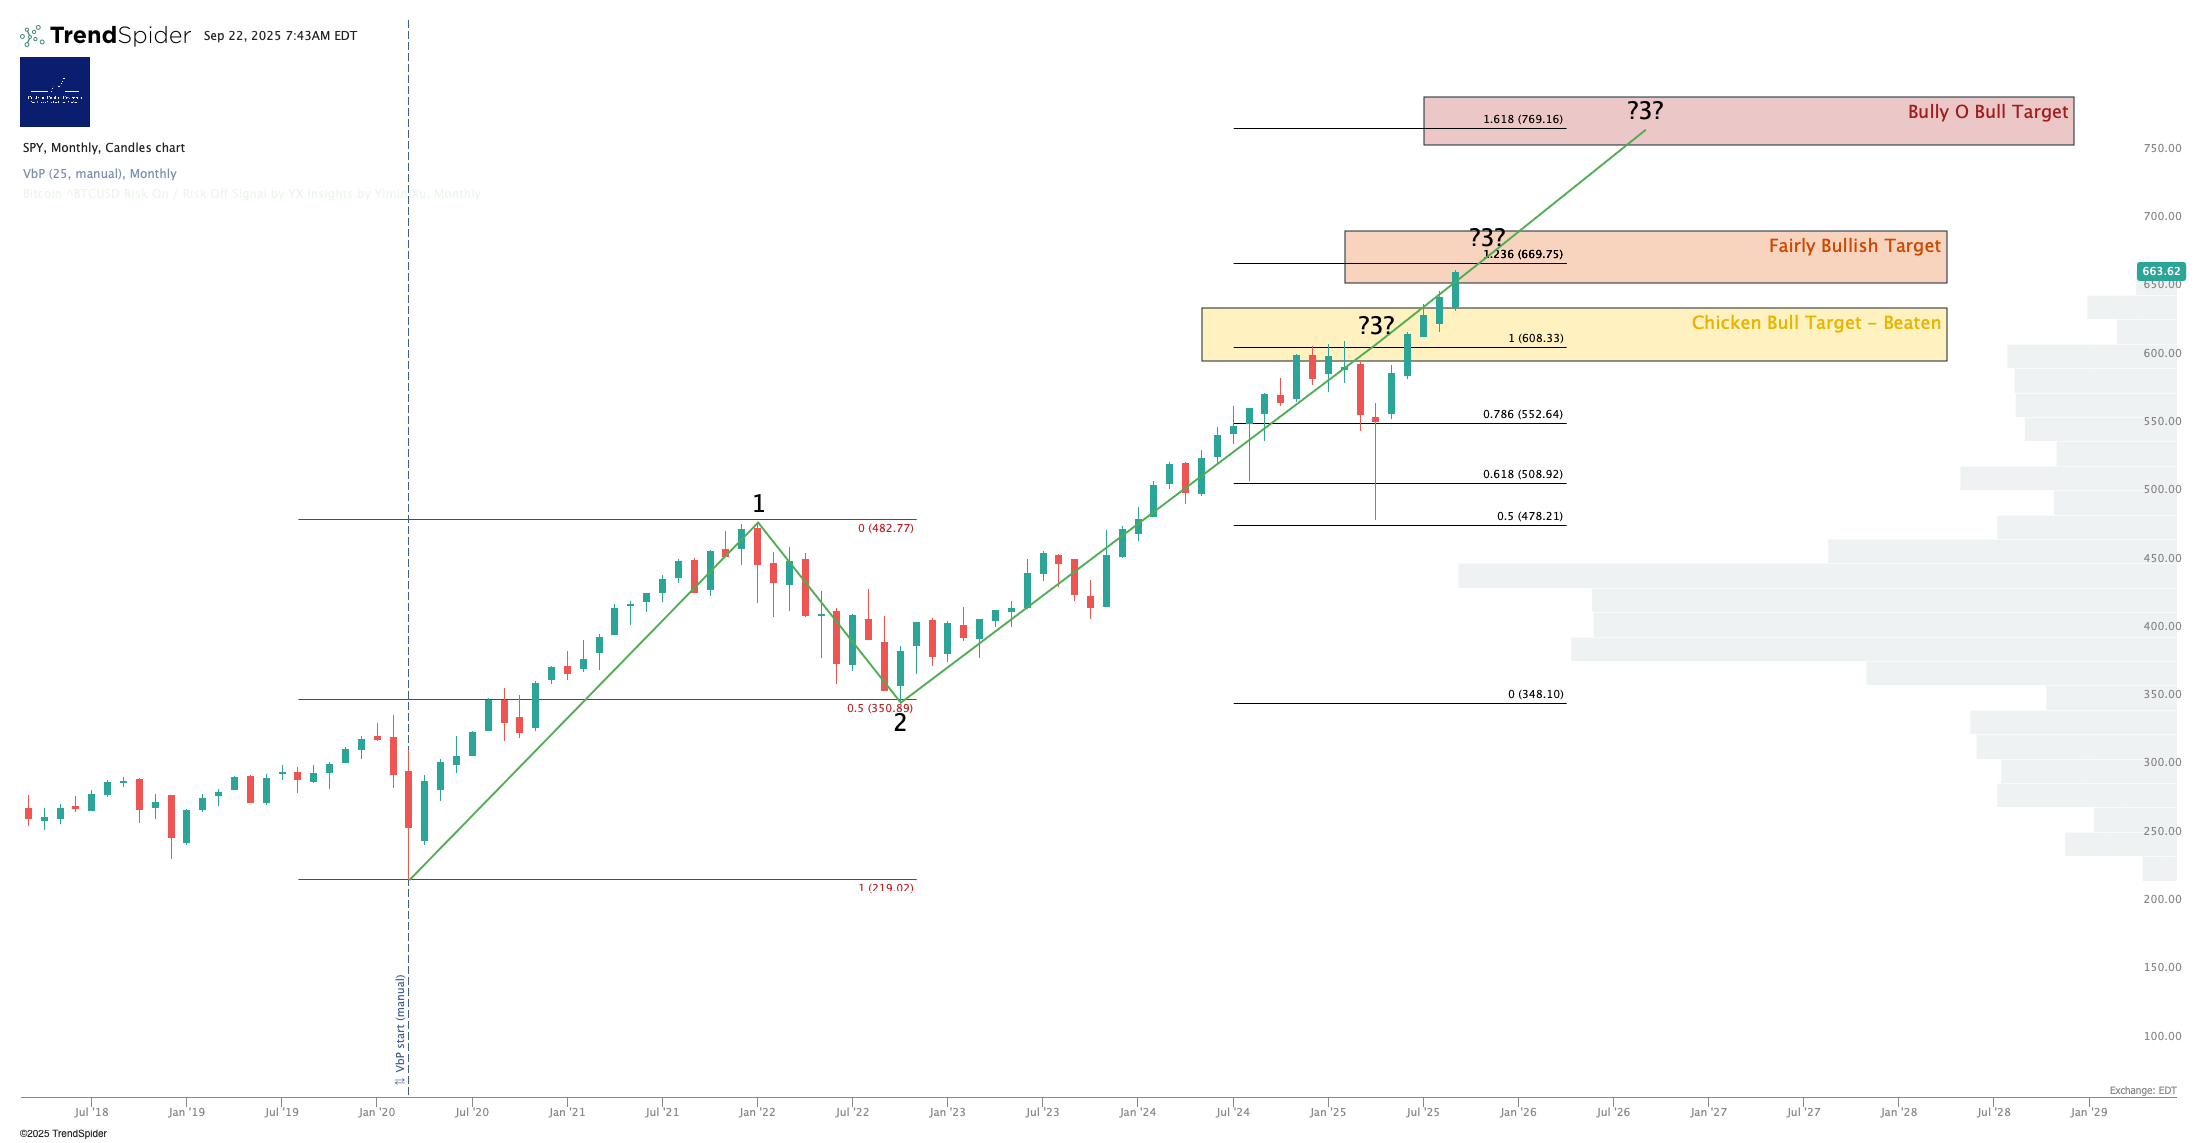
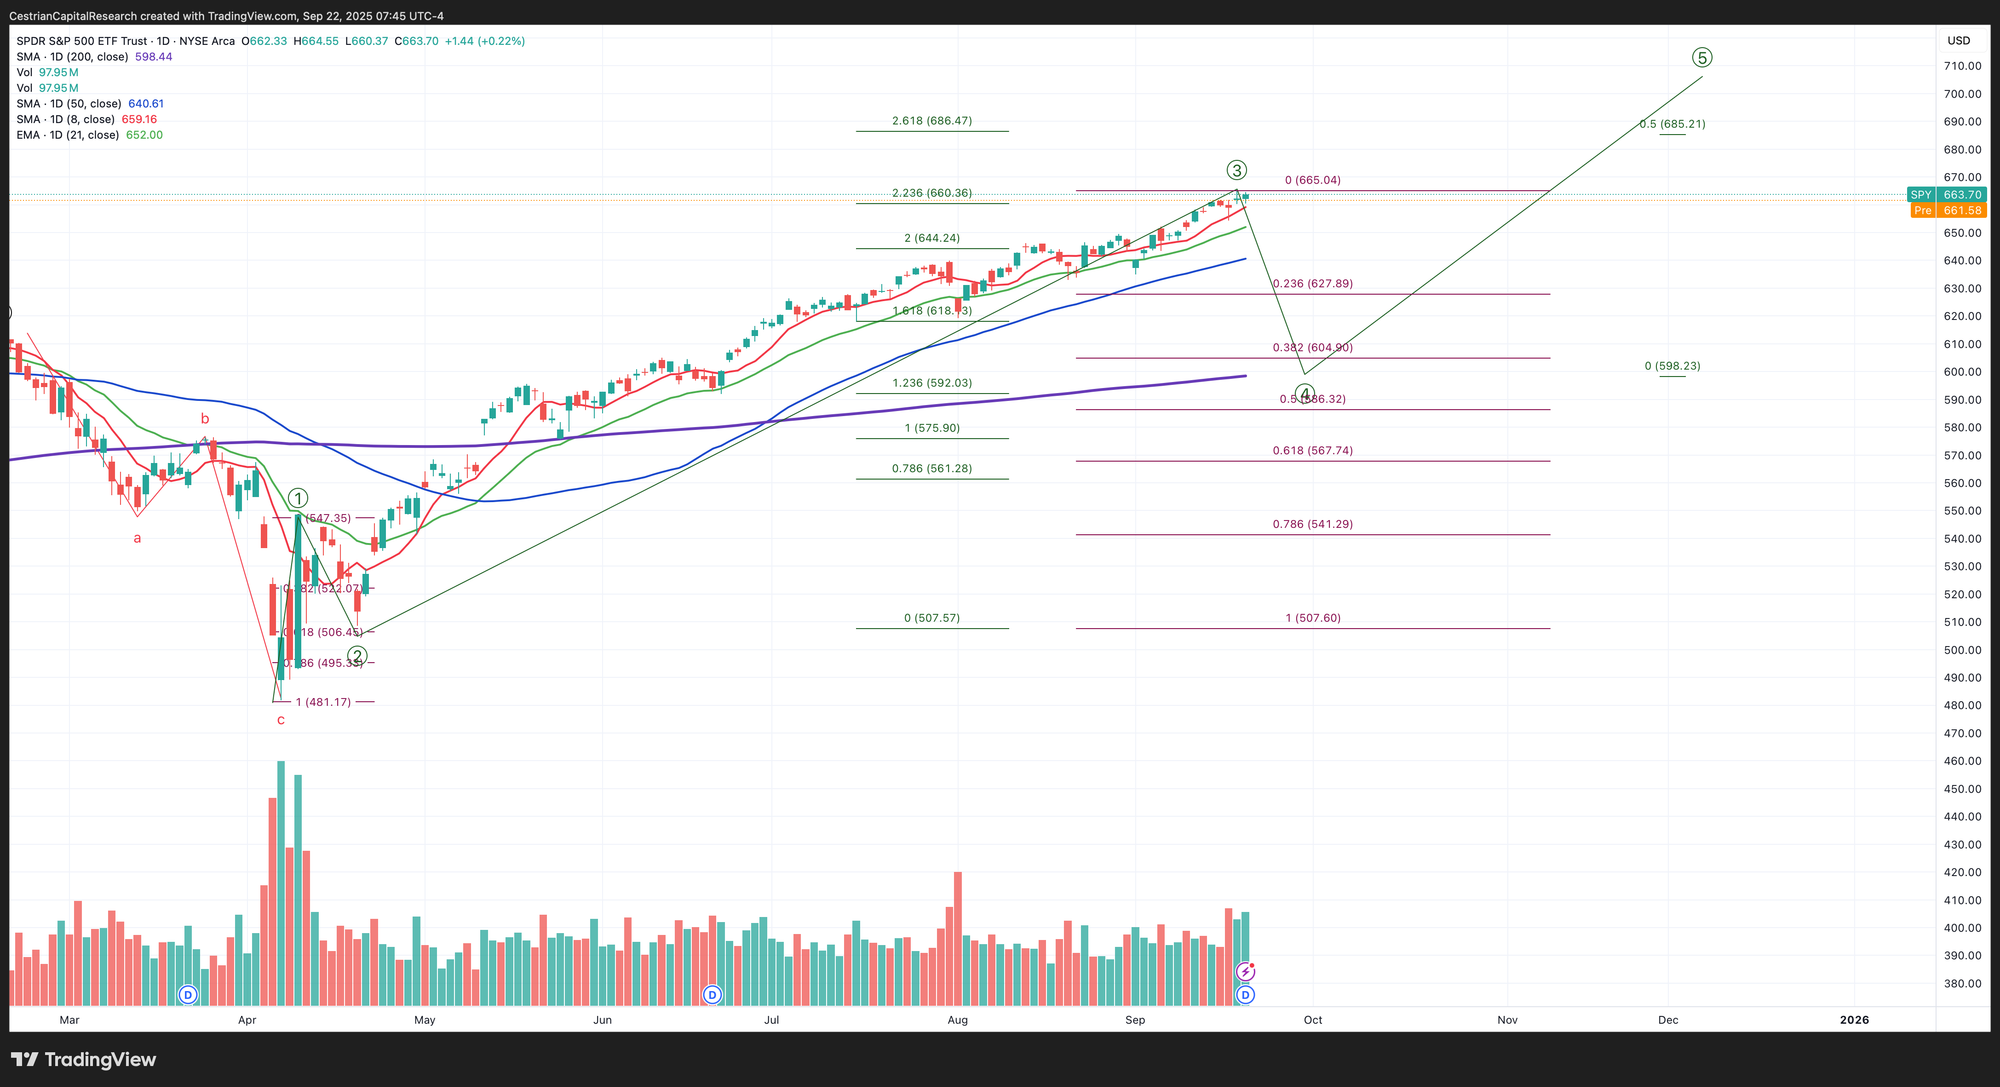
S&P500 / SPY / UPRO
Remains very bullish on the monthly.
I want to repeat over and over as how to use this chart, because this one chart can help you hold your nerve in a bull move, and cut bait when it starts to crumble (but before it burns).
Until the red line gives way, bullish. If the red line gives way but the green line is holding, still bullish. Below the green line but above the blue line, worry. Below the blue line, worry more. Below the purple line, all bets are off because crazy stuff happens below the 200-day. Sometimes it doesn’t have to be complicated.
(Oh and by the way, I would suggest using the daily close as the most important price, not anything intraday).
3x Levered Long / Short ETF - UPRO, SPXU
Note - Leveraged ETF. Read the fund documentation if you are considering using this instrument.
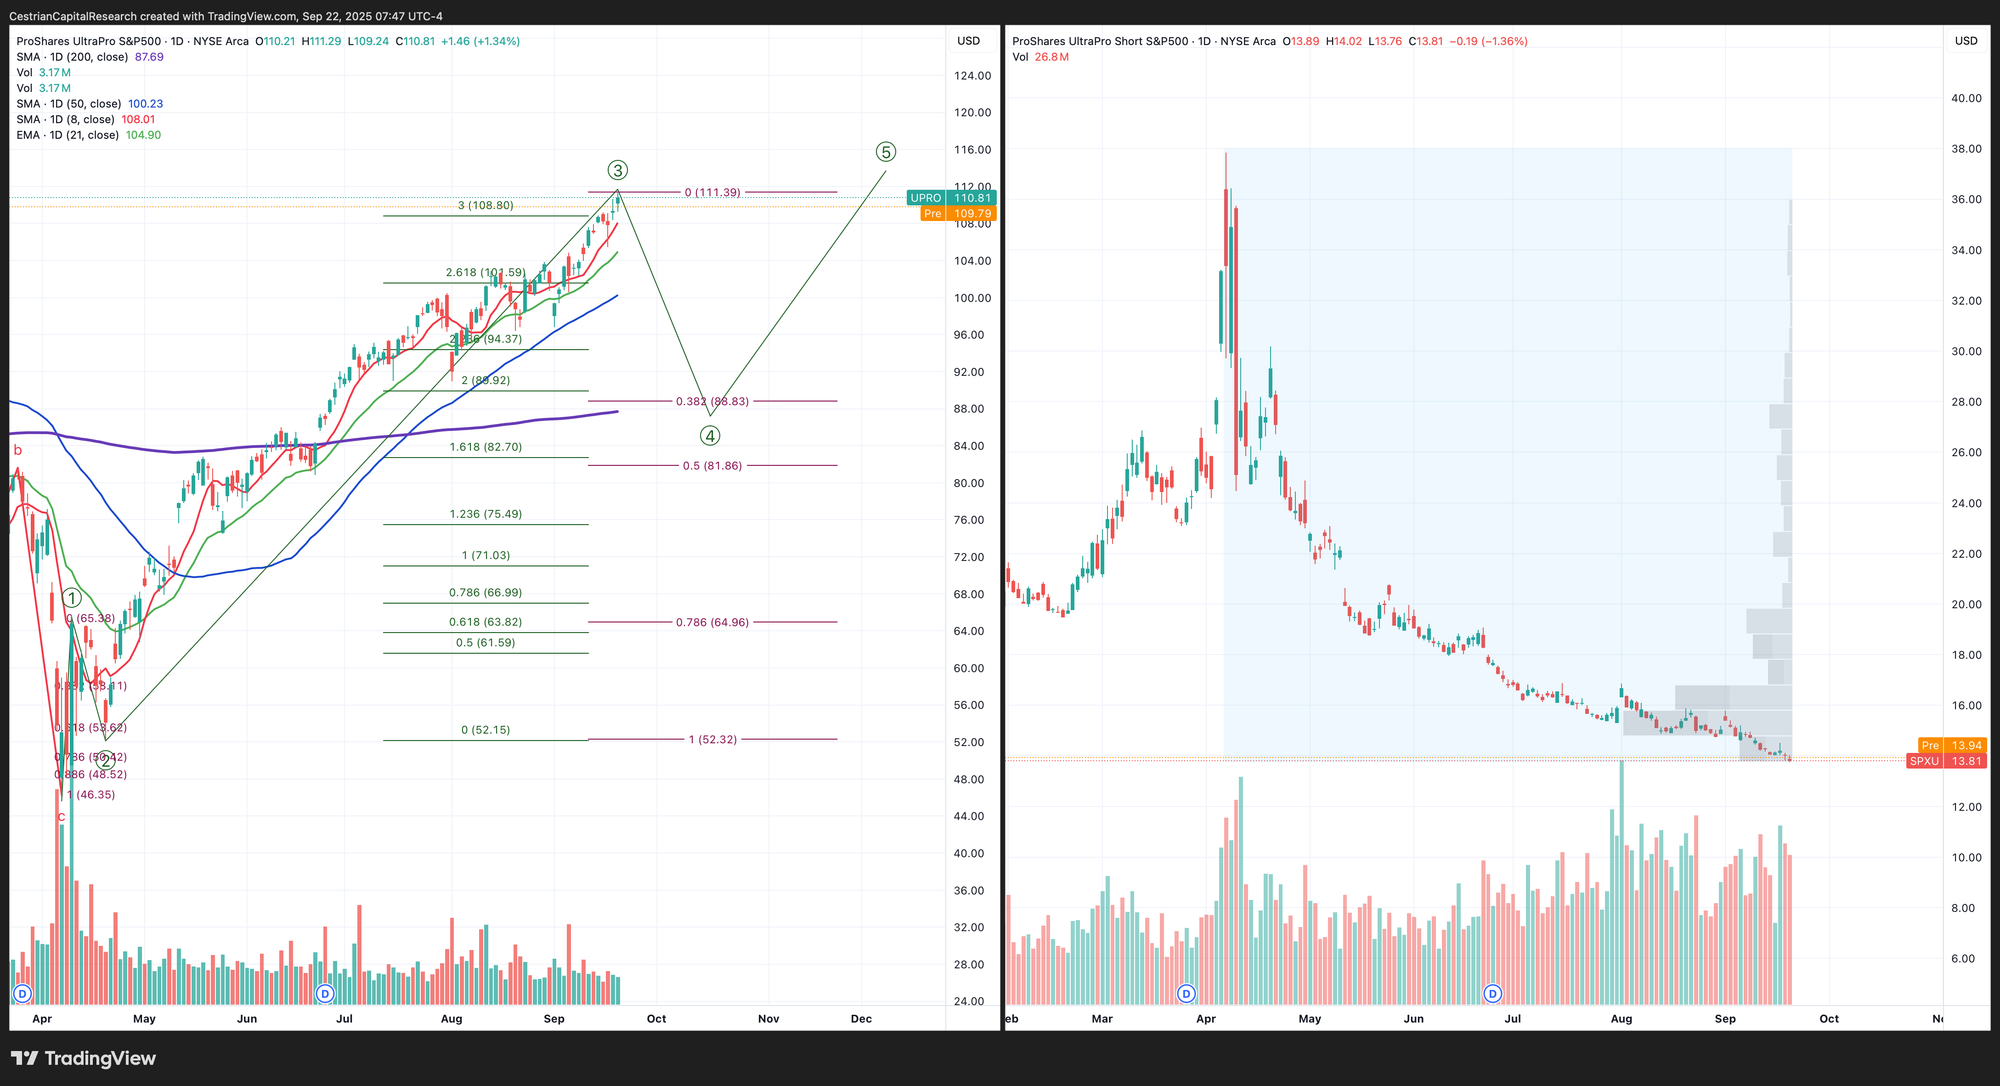
Disclosure: I am long $IUSA, and long SPY puts for December expiry. In aggregate net long the S&P.
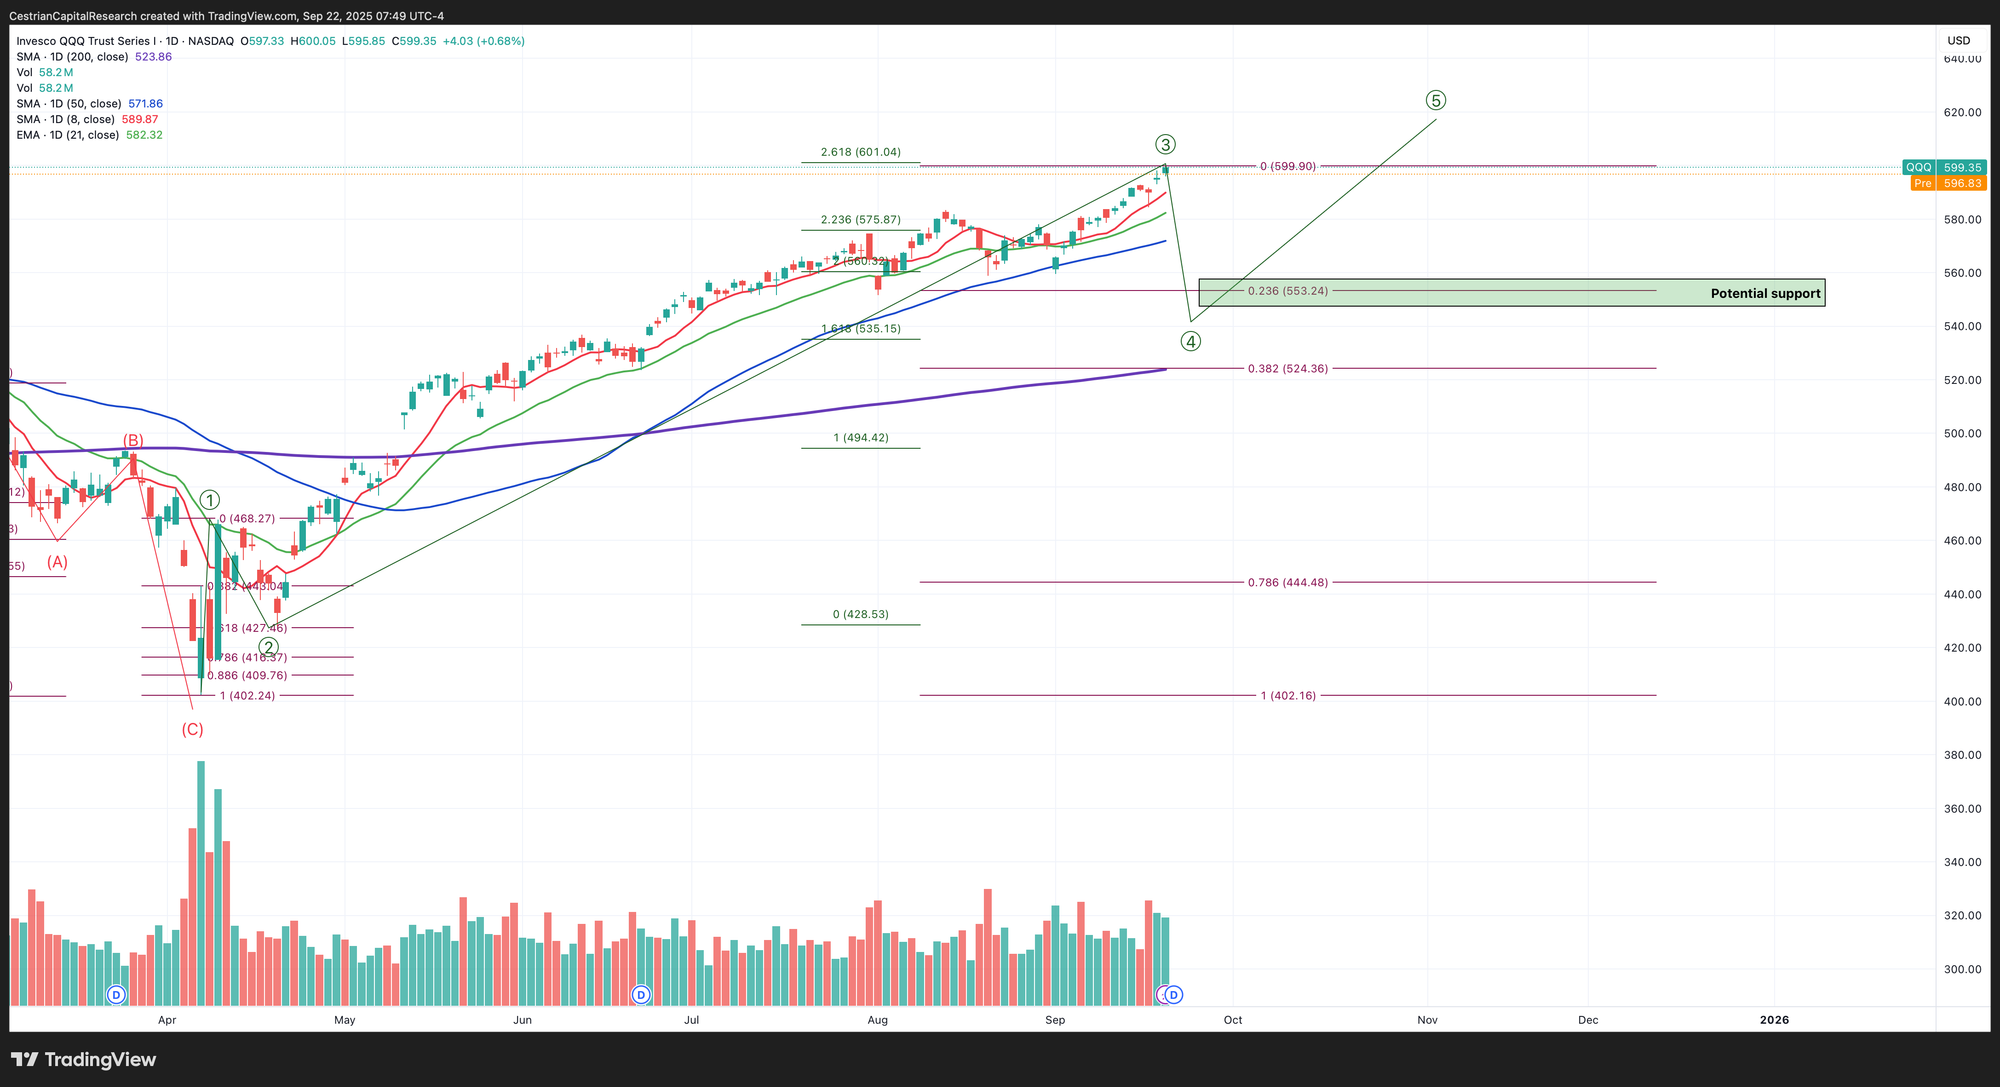
Nasdaq-100 / QQQ / TQQQ
No change on this timeframe.
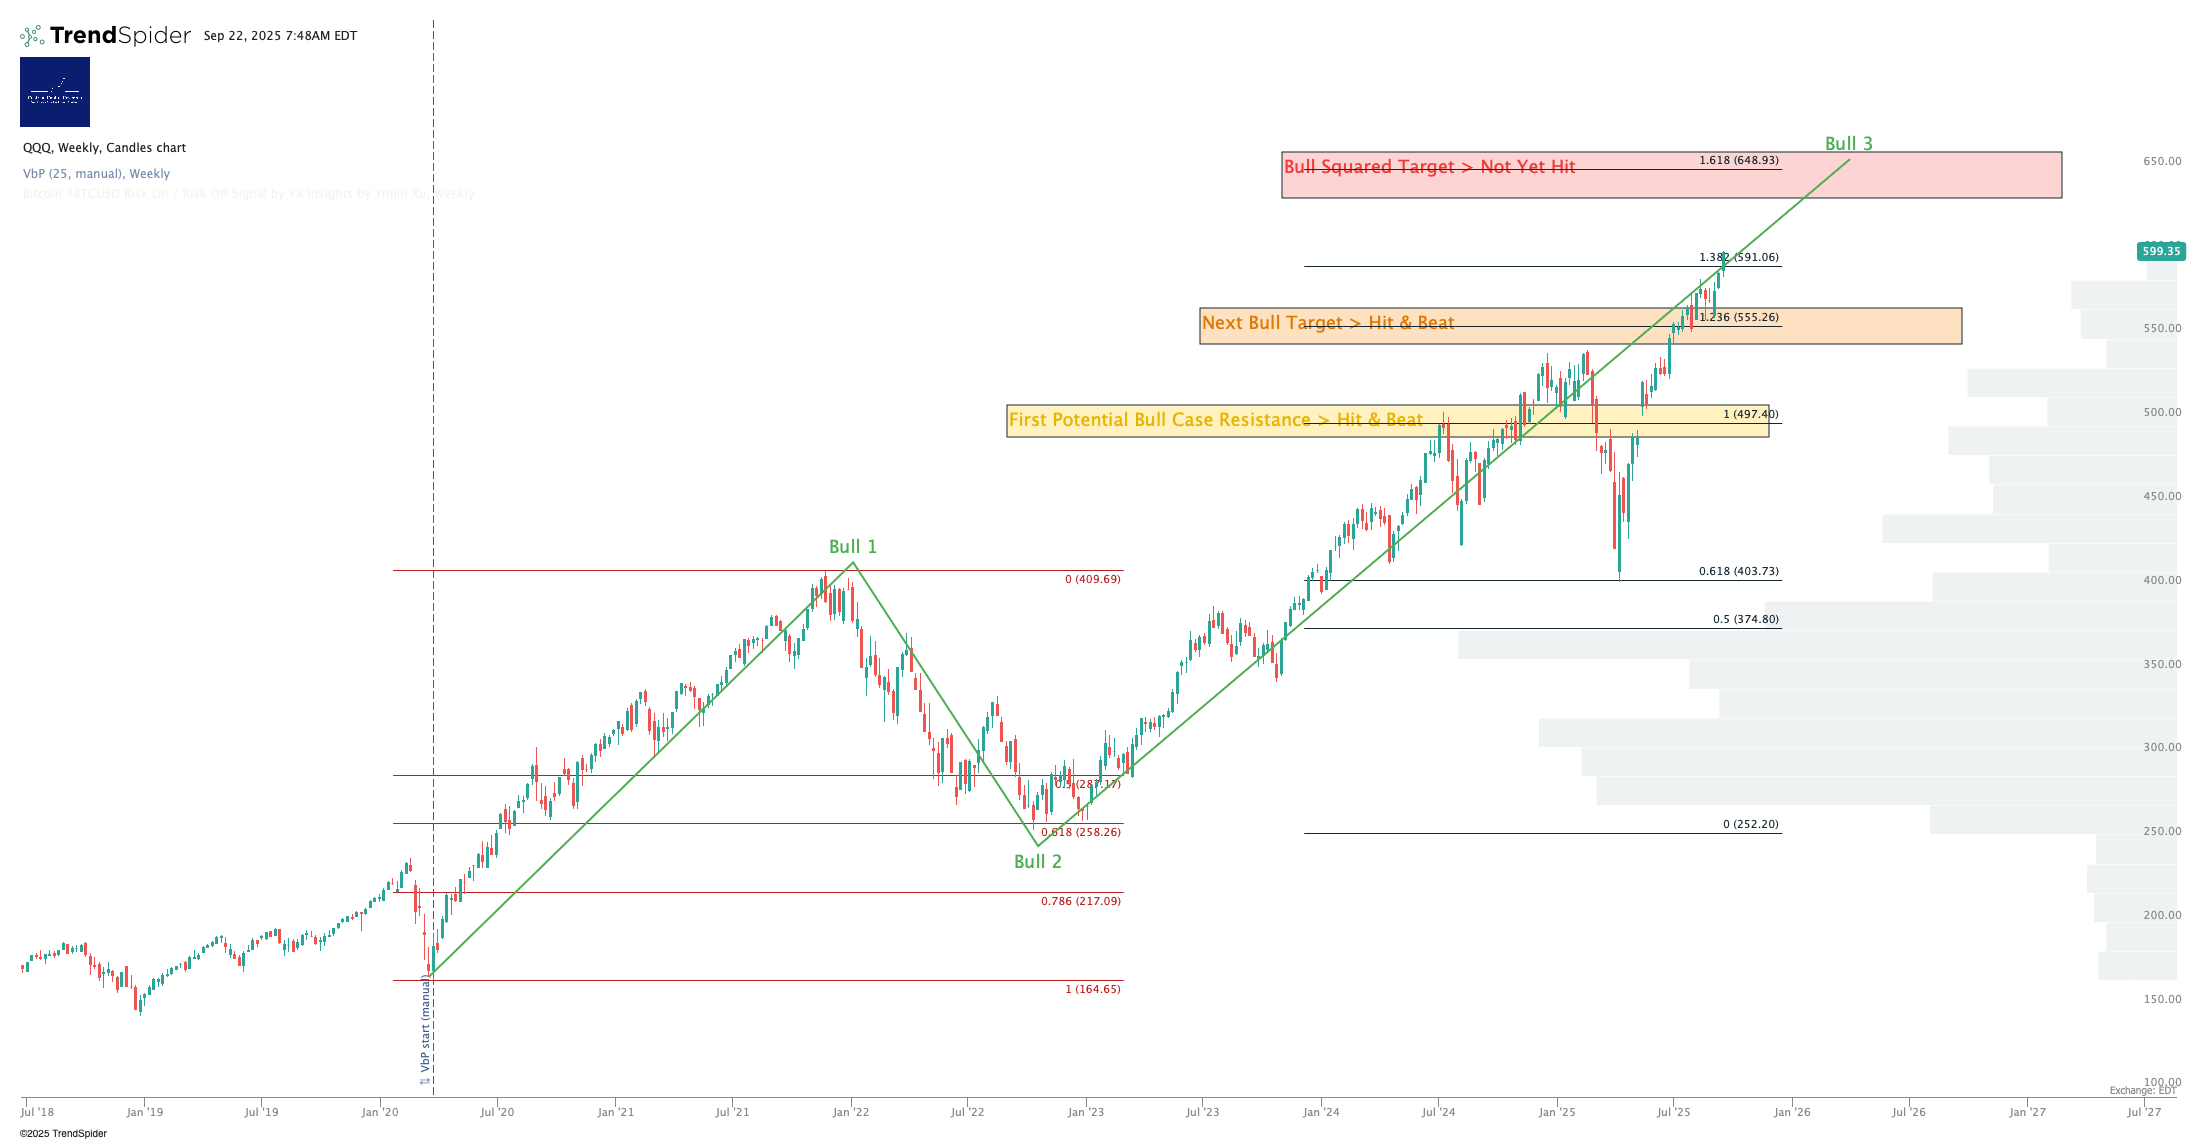
Same rules as for SPY on this timeframe, to repeat:
Until the red line gives way, bullish. If the red line gives way but the green line is holding, still bullish. Below the green line but above the blue line, worry. Below the blue line, worry more. Below the purple line, all bets are off because crazy stuff happens below the 200-day. I would suggest a focus on daily closing prices.
Levered Nasdaq - TQQQ Long / SQQQ Short
Note - Leveraged ETF. Read the fund documentation if you are considering using this instrument.
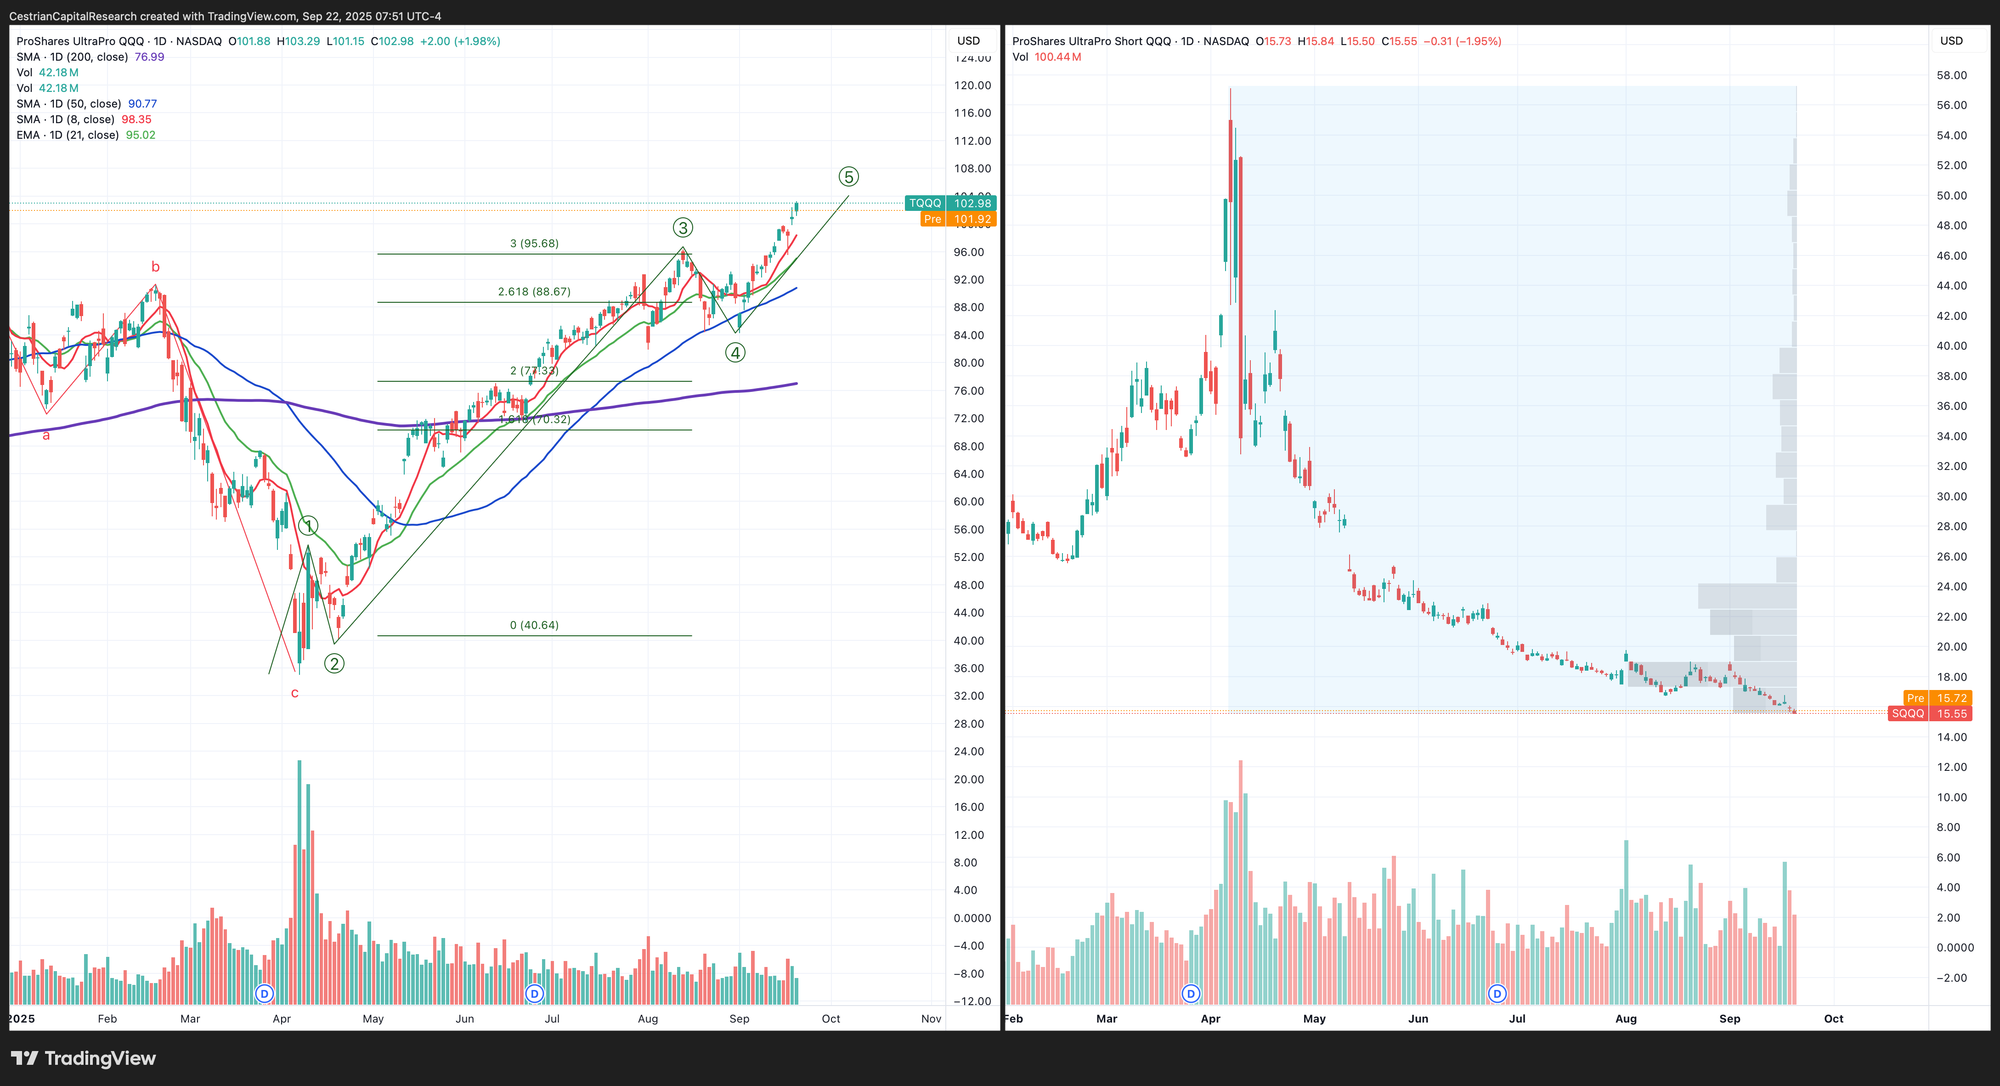
Disclosure: I am hedged 1.5:1 $TQQQ:$SQQQ, and have $TQQQ and $QQQ puts for December expiry. Overall net long the Nasdaq.
Alex King, Cestrian Capital Research, Inc - 22 September 2025.
DISCLOSURE - Cestrian Capital Research, Inc staff personal accounts hold long positions in, inter alia, TQQQ, SQQQ, IUSA, TLT, DTLA, ETHE, ETHA; long December TQQQ, QQQ and SPY puts.