
NO PAYWALL VERSION: Market On Open, Tuesday 2 September

DISCLAIMER: This note is intended for US recipients only and, in particular, is not directed at, nor intended to be relied upon by any UK recipients. Any information or analysis in this note is not an offer to sell or the solicitation of an offer to buy any securities. Nothing in this note is intended to be investment advice and nor should it be relied upon to make investment decisions. Cestrian Capital Research, Inc., its employees, agents or affiliates, including the author of this note, or related persons, may have a position in any stocks, security, or financial instrument referenced in this note. Any opinions, analyses, or probabilities expressed in this note are those of the author as of the note's date of publication and are subject to change without notice. Companies referenced in this note or their employees or affiliates may be customers of Cestrian Capital Research, Inc. Cestrian Capital Research, Inc. values both its independence and transparency and does not believe that this presents a material potential conflict of interest or impacts the content of its research or publications.
Back To Work Folks, Grumpy Or Not.
by Alex King, CEO, Cestrian Capital Research, Inc
Welcome back folks. Labor Day in the rearview and the dregs of Q3 ahead of us. Markets have been quiet in recent days on low volume and the Administration has also been fairly quiet. Probably both will get more active this week. In equities the tension between “seasonality says weakness ahead” and “price says otherwise” continues. Let’s ease into this short week by just getting directly to the charts.
This edition of today’s Market On Open note is the no-paywall version. To get the full note each day, including the Dow, semiconductor, tech and other ETFs, join our Inner Circle service.
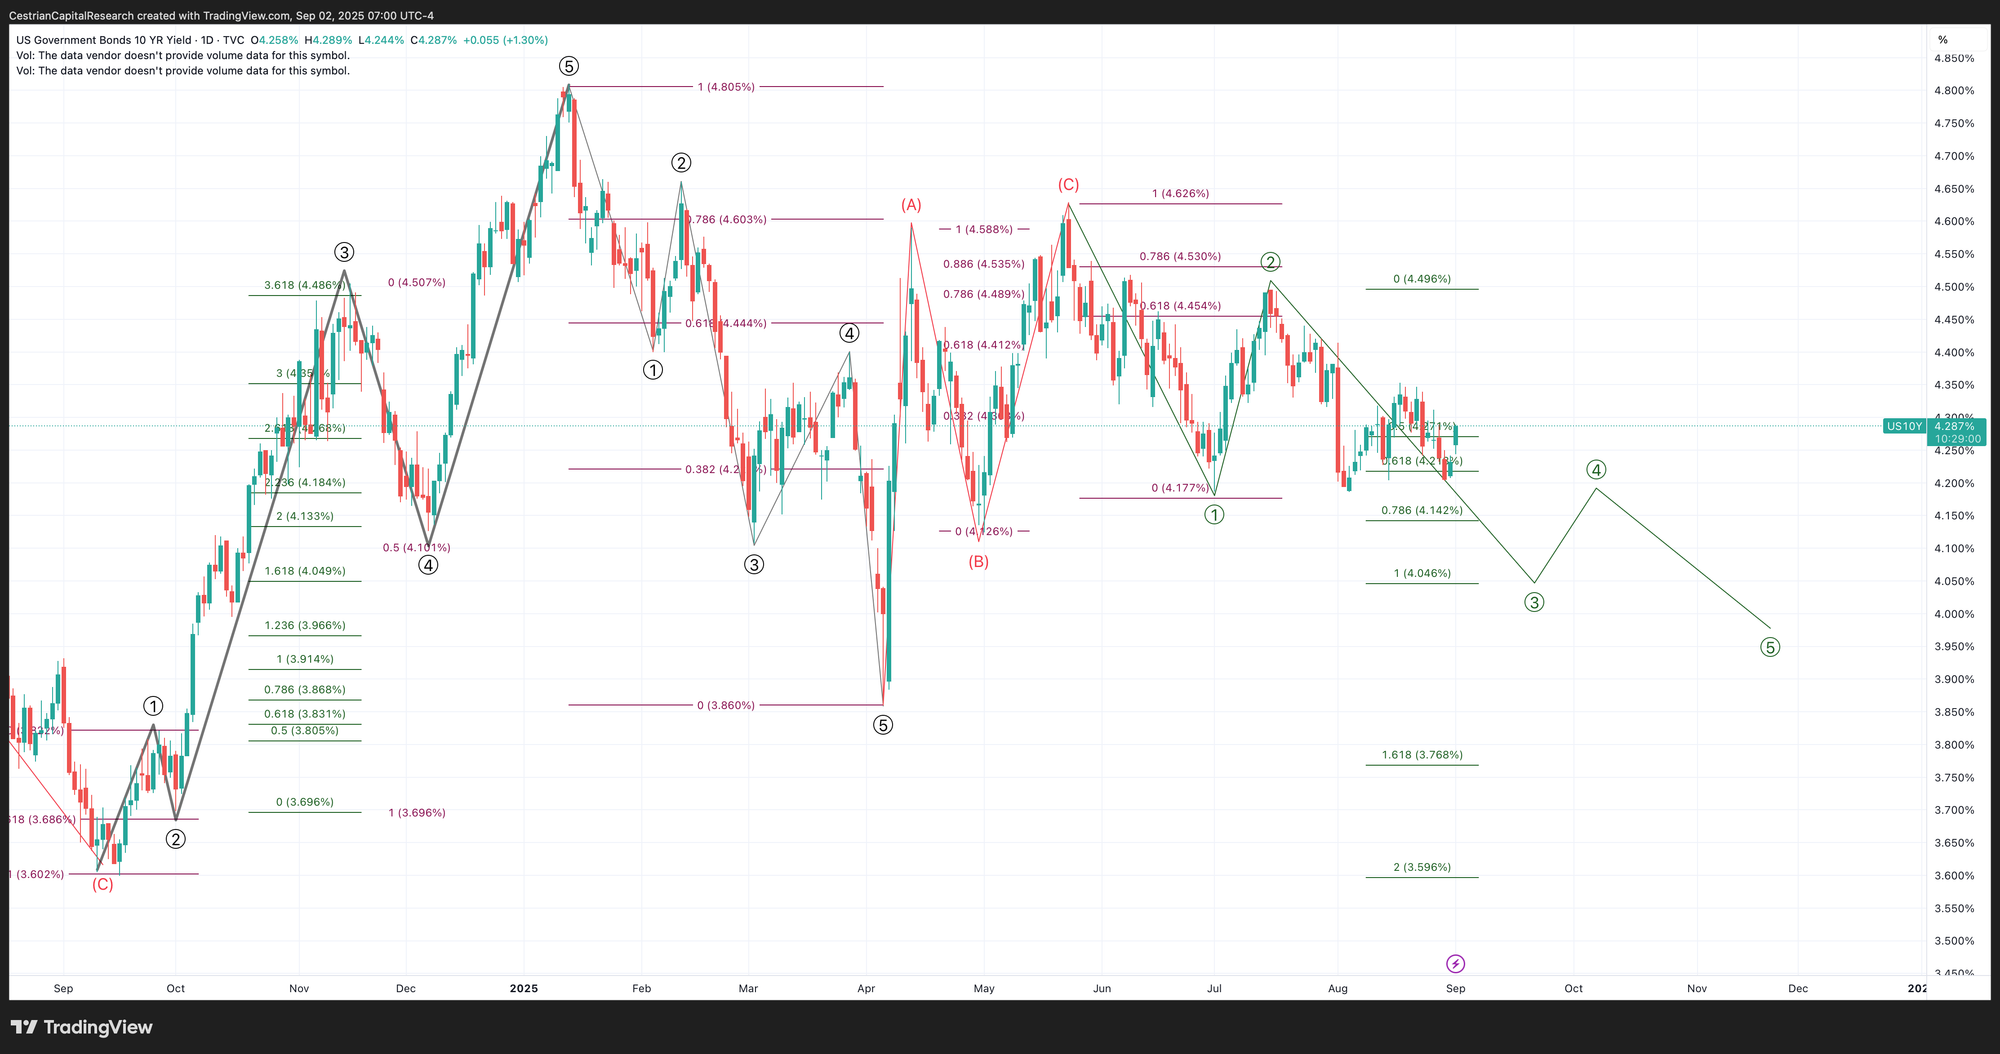
US 10-Year Yield
Equity Volatility
A little tick up in volatility (S&P500 >30DTE put-buying, in essence) today; likely in anticipation of a planned 2pm Eastern White House event.
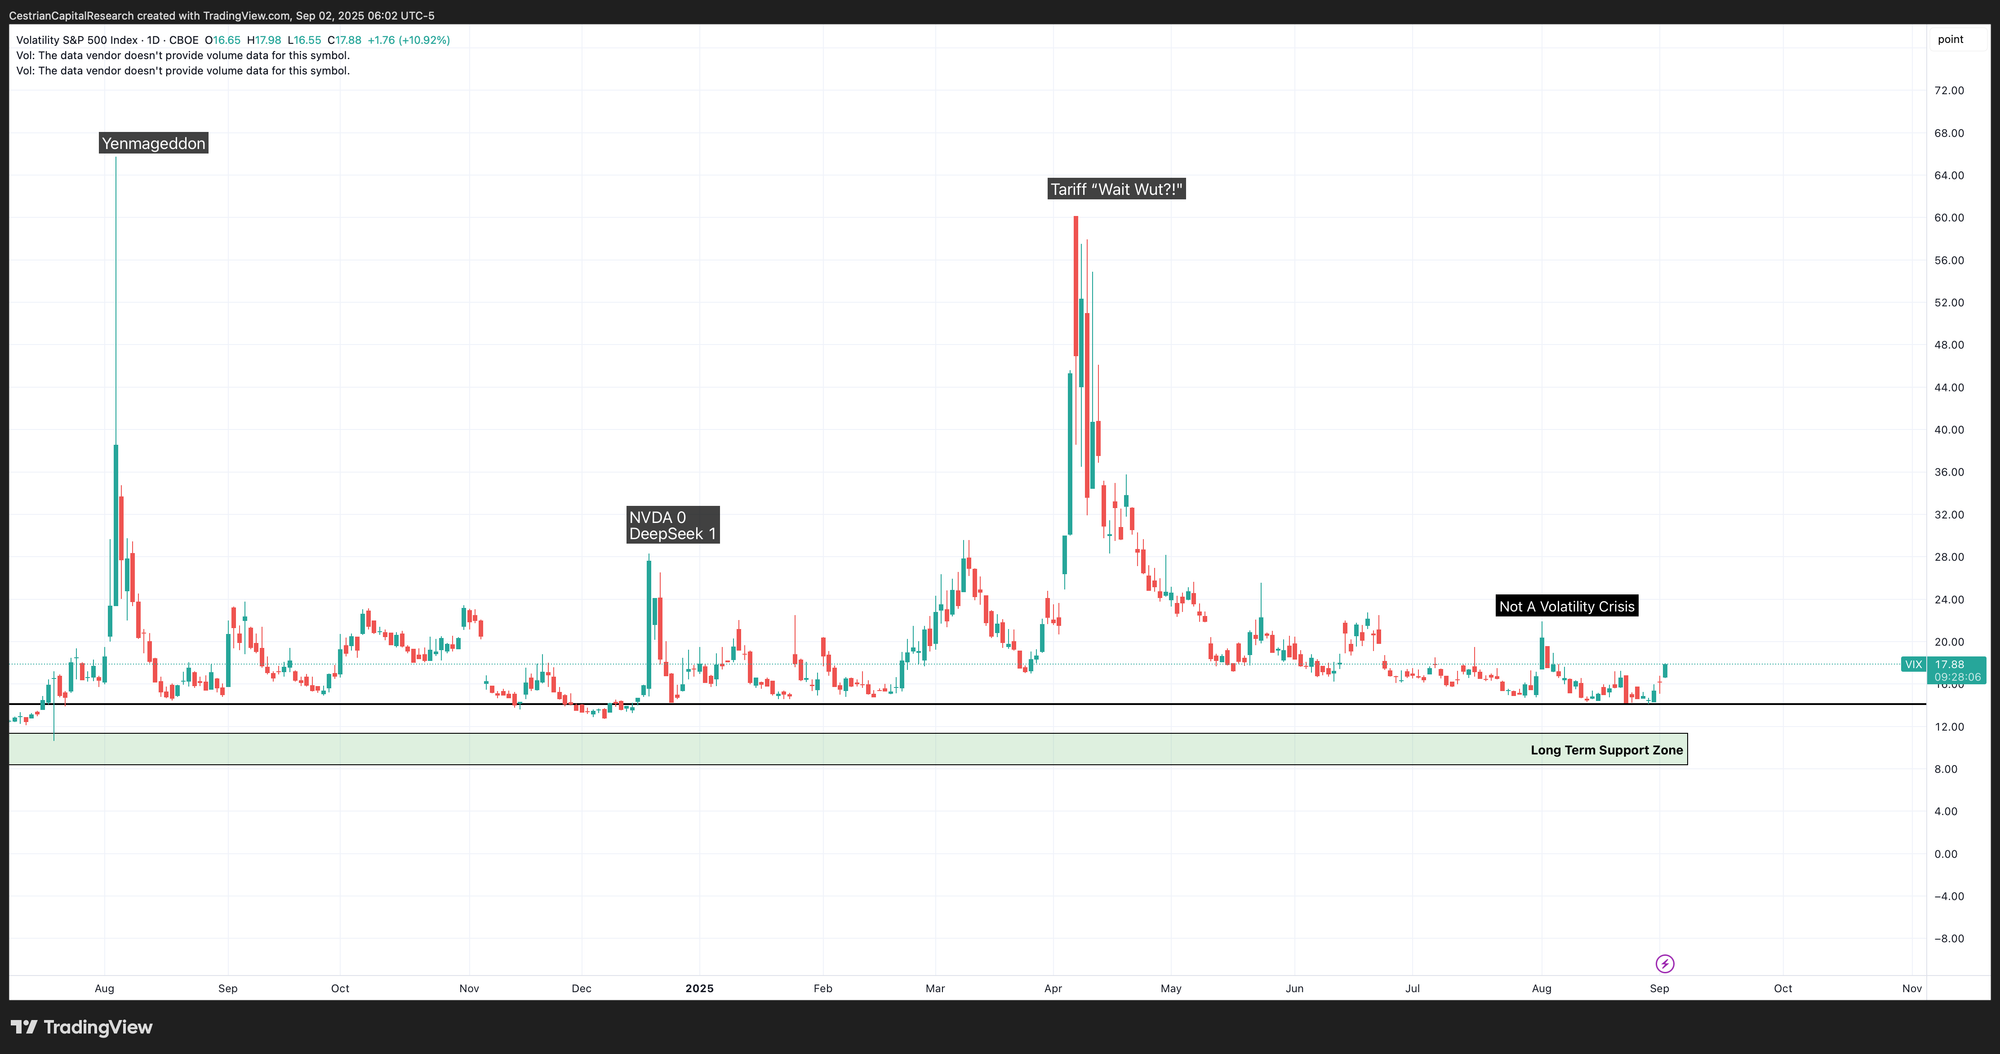
Disclosure: No position in any Vix-based securities.
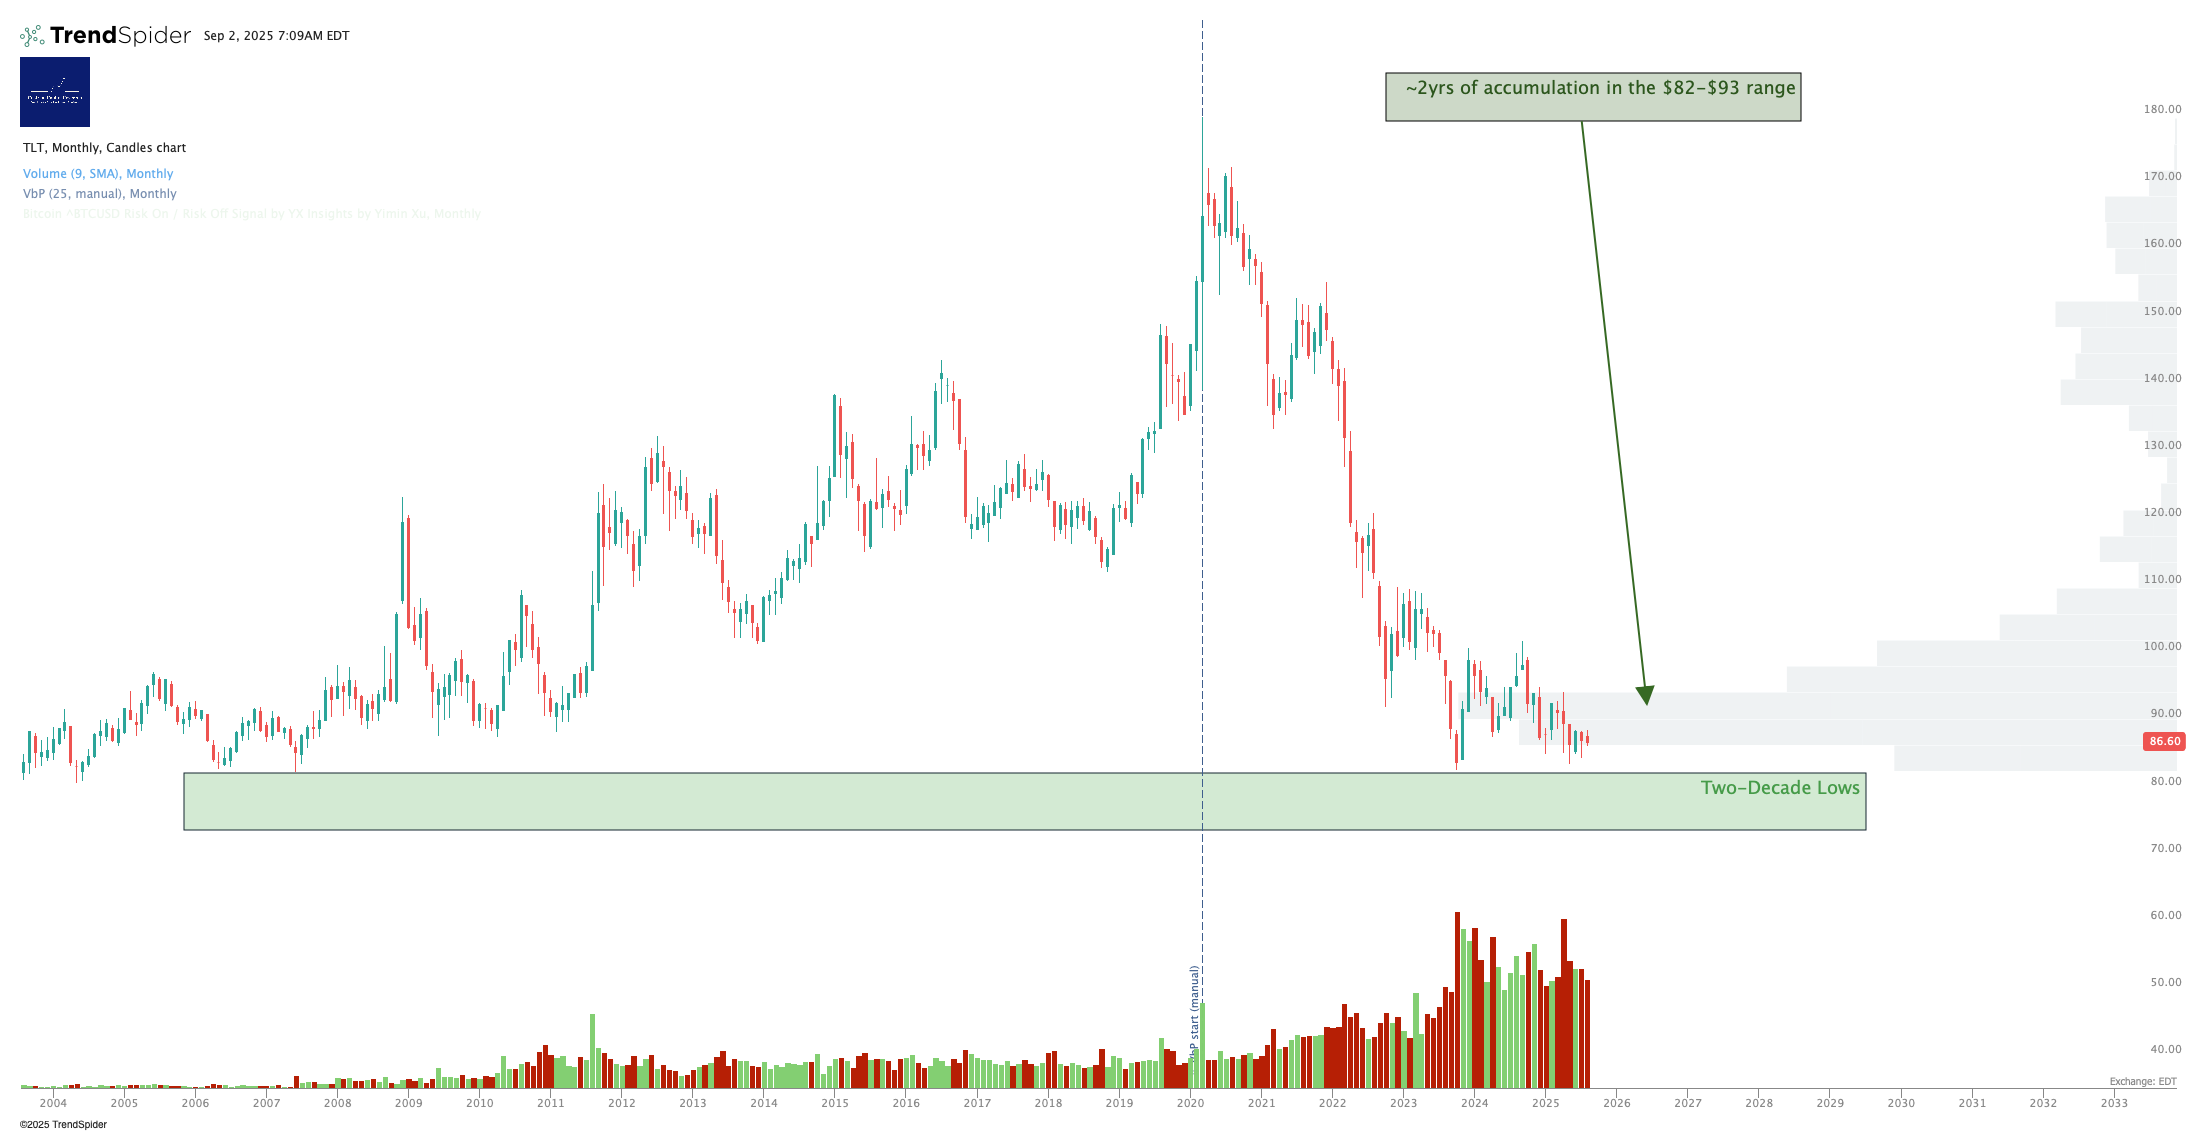
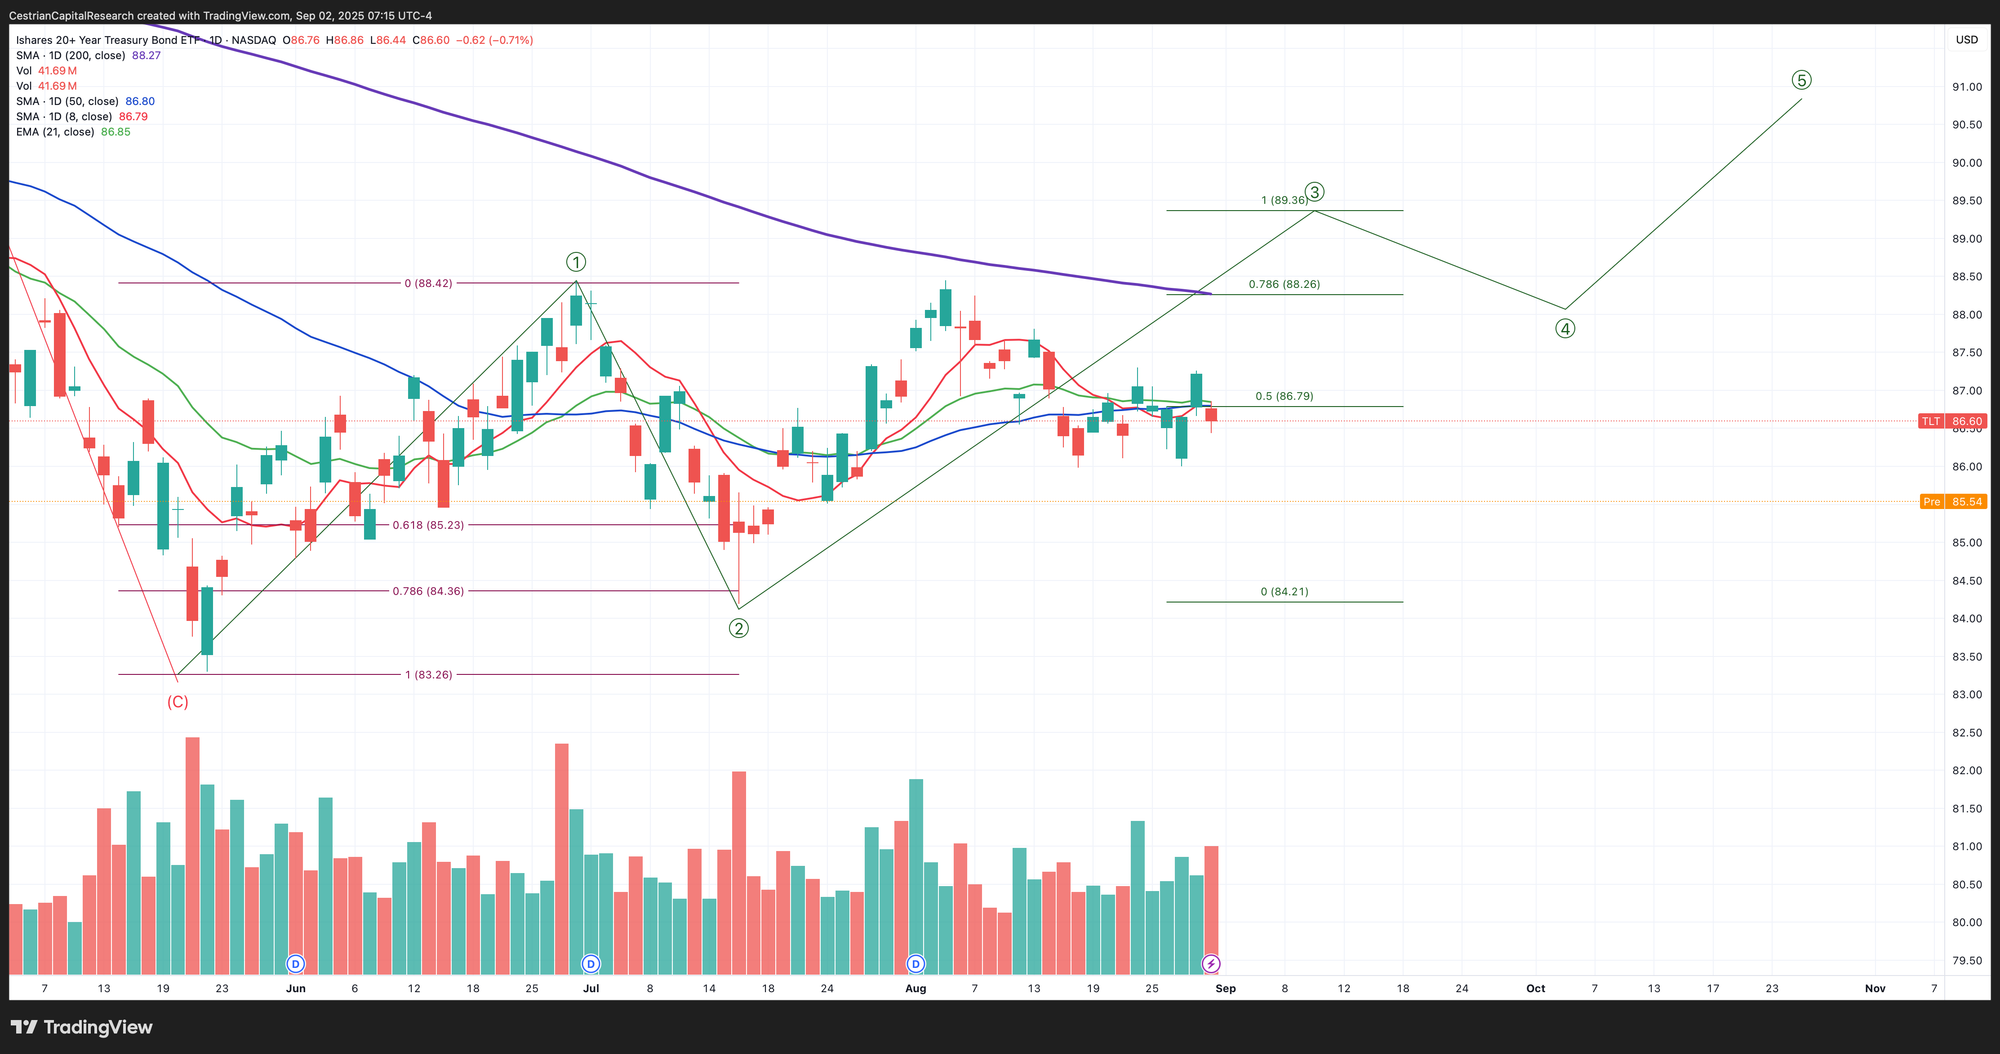
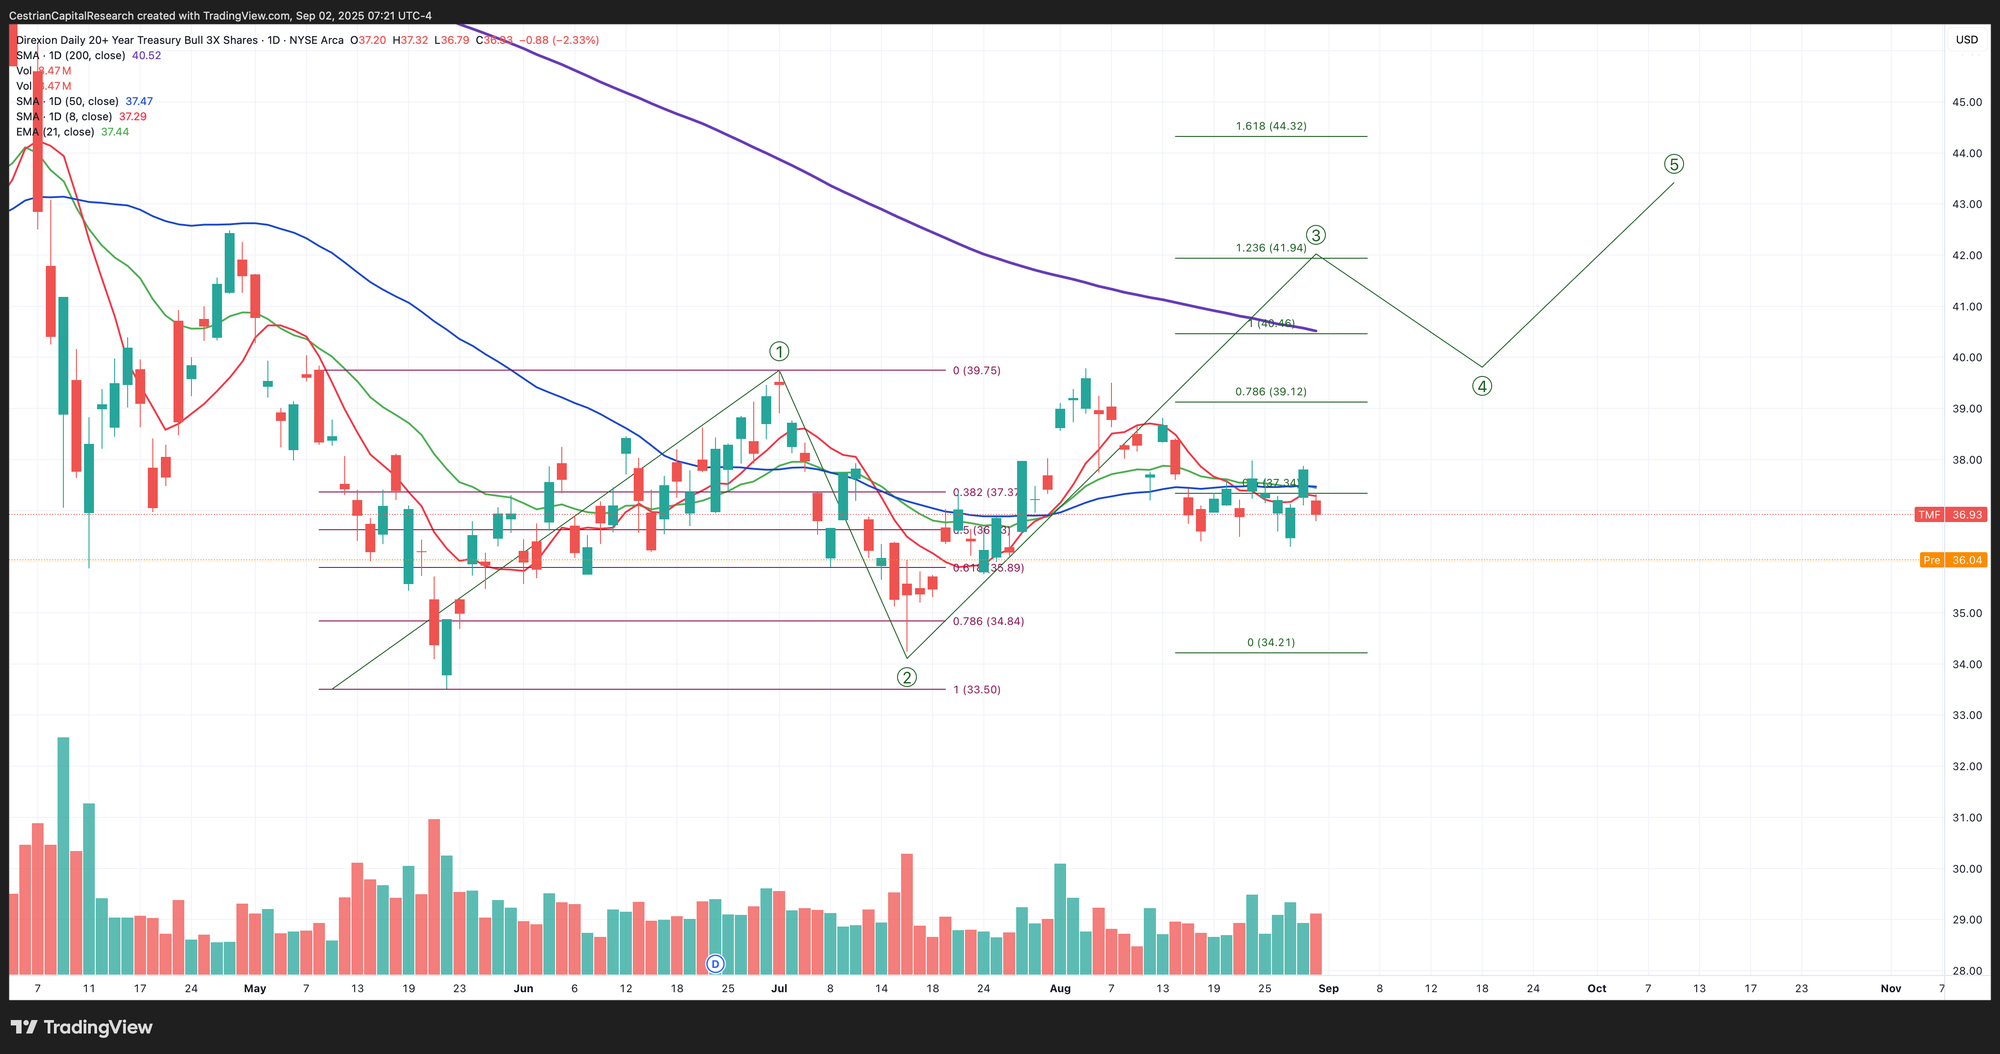
Longer-Term Treasury Bonds (TLT / TMF)
At this level of zoom, no change. I continue to believe that U.S. bonds are being accumulated down here, not sold (meaning I don’t think the volume is created by large, price-setting institutions deciding to abandon U.S. bonds).
Under pressure today as long-dated (esp 30yr) bonds are under pressure in the US and Europe alike this morning.
Note - Leveraged ETF. Read the fund documentation if you are considering using this instrument.
Below this cluster of short-term moving averages is a bearish place to be. For a bullish look one would want to see TMF at $37-38 or better, up and over all moving averages shown save for the 200-day.
Disclosure: I am unhedged long $TLT and similar EU UCITS ETFs.
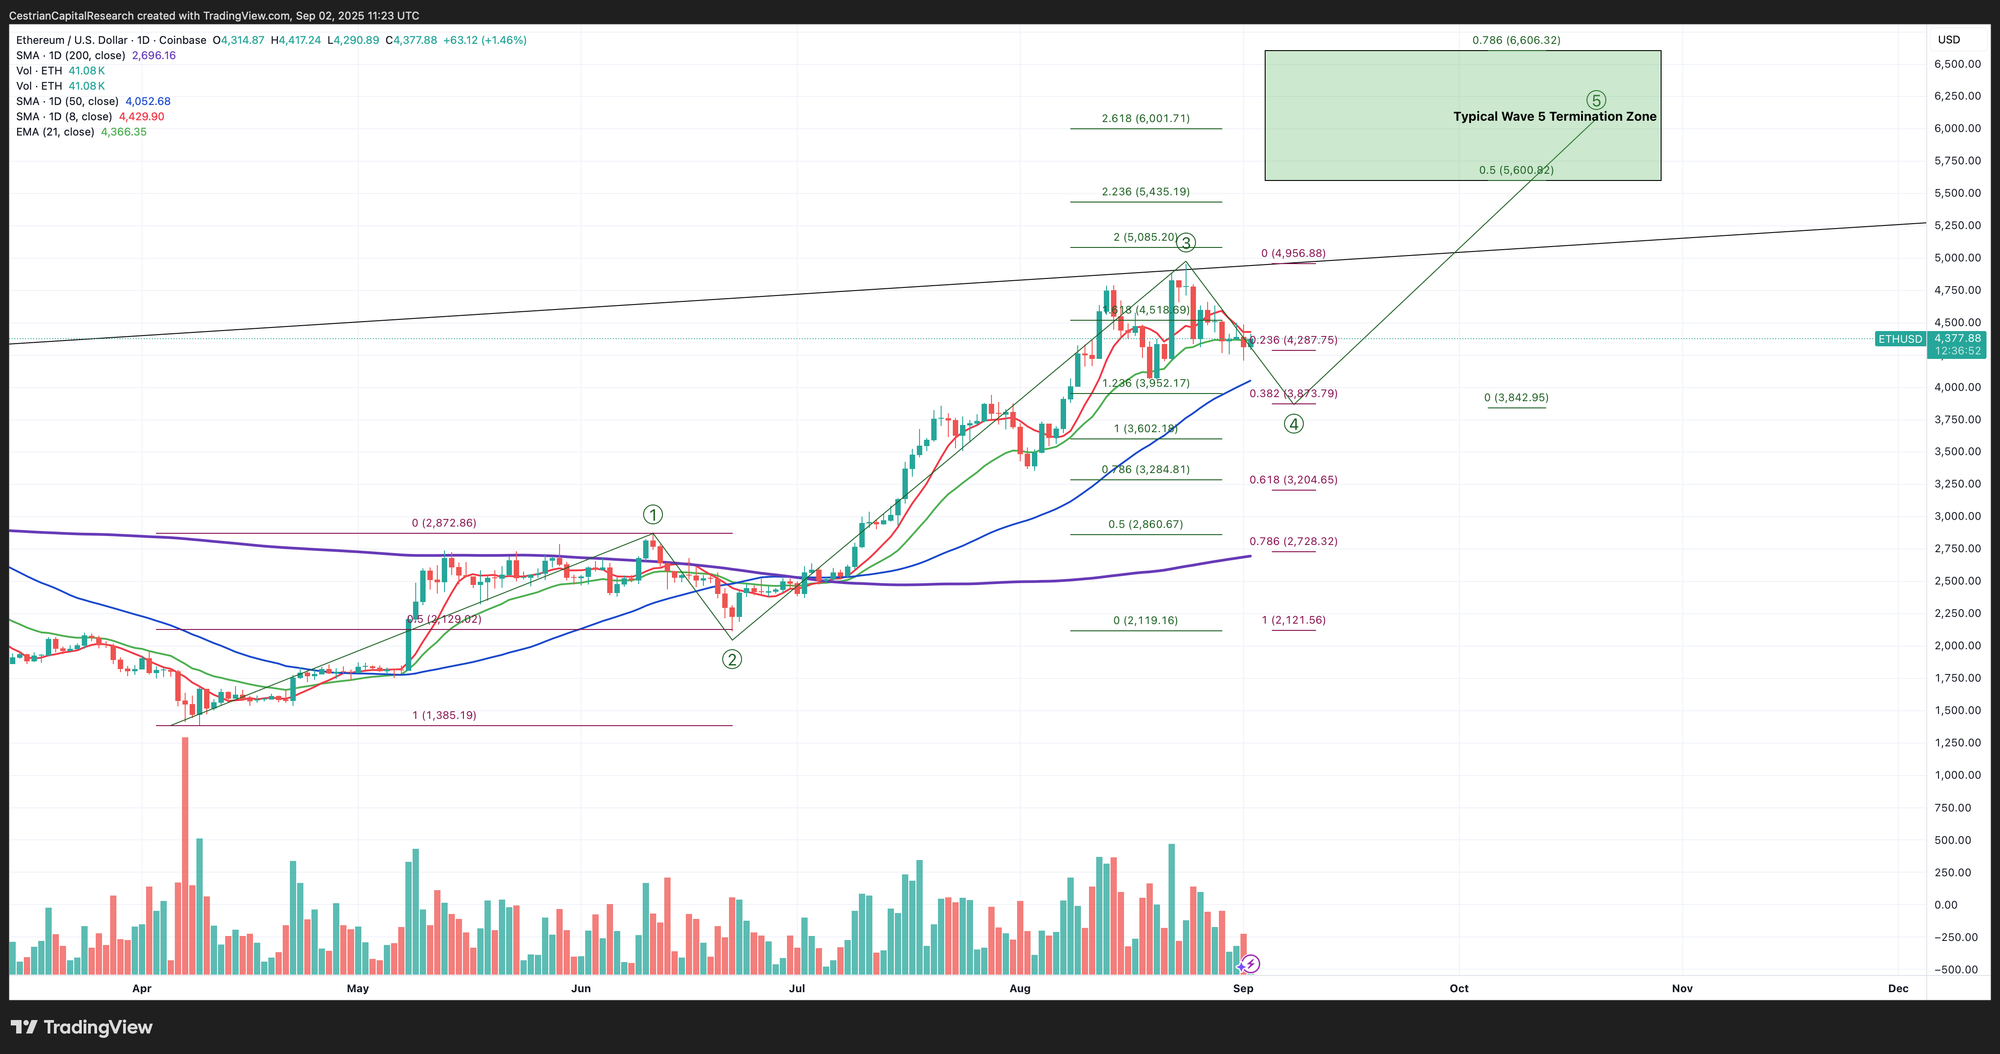
Ether
Below $4050 (the 50-day moving average) and in particular below $3800 (the .382 retrace of the big Wave 3 up shown) one ought to be bearish on Ether, at least in the short term. Above those levels, bullish. The ongoing bid from the Ether Treasury Companies remains.
If you’d like to have AI help you to trade Ether, Bitcoin, Solana and key crypto-centric stocks, take a look at our Big Money Crypto algorithmic signals, here (independent investors) and here (investment professionals).
Disclosure - Long $ETHA and others in the Ether complex.
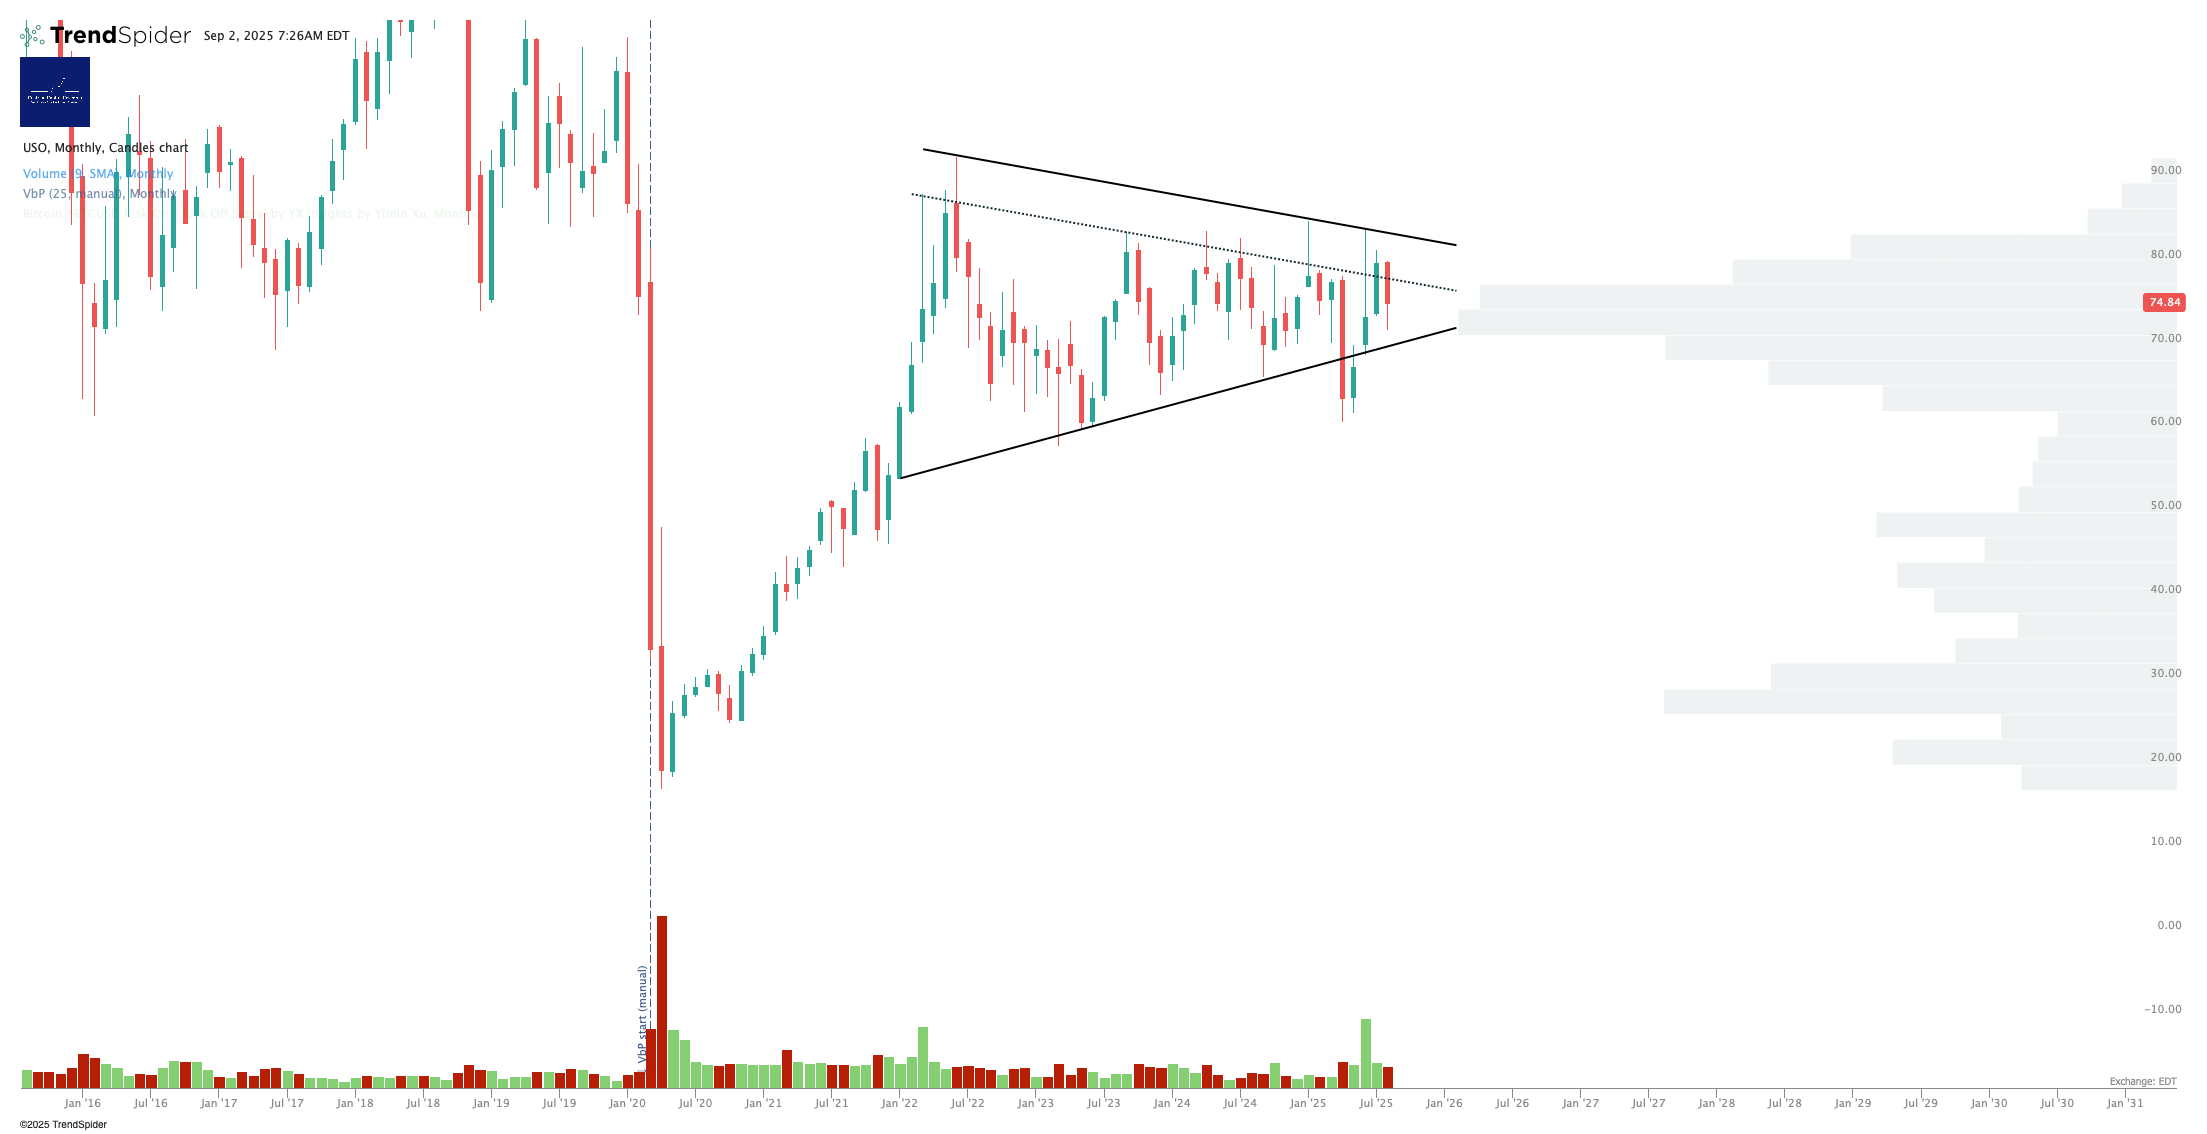
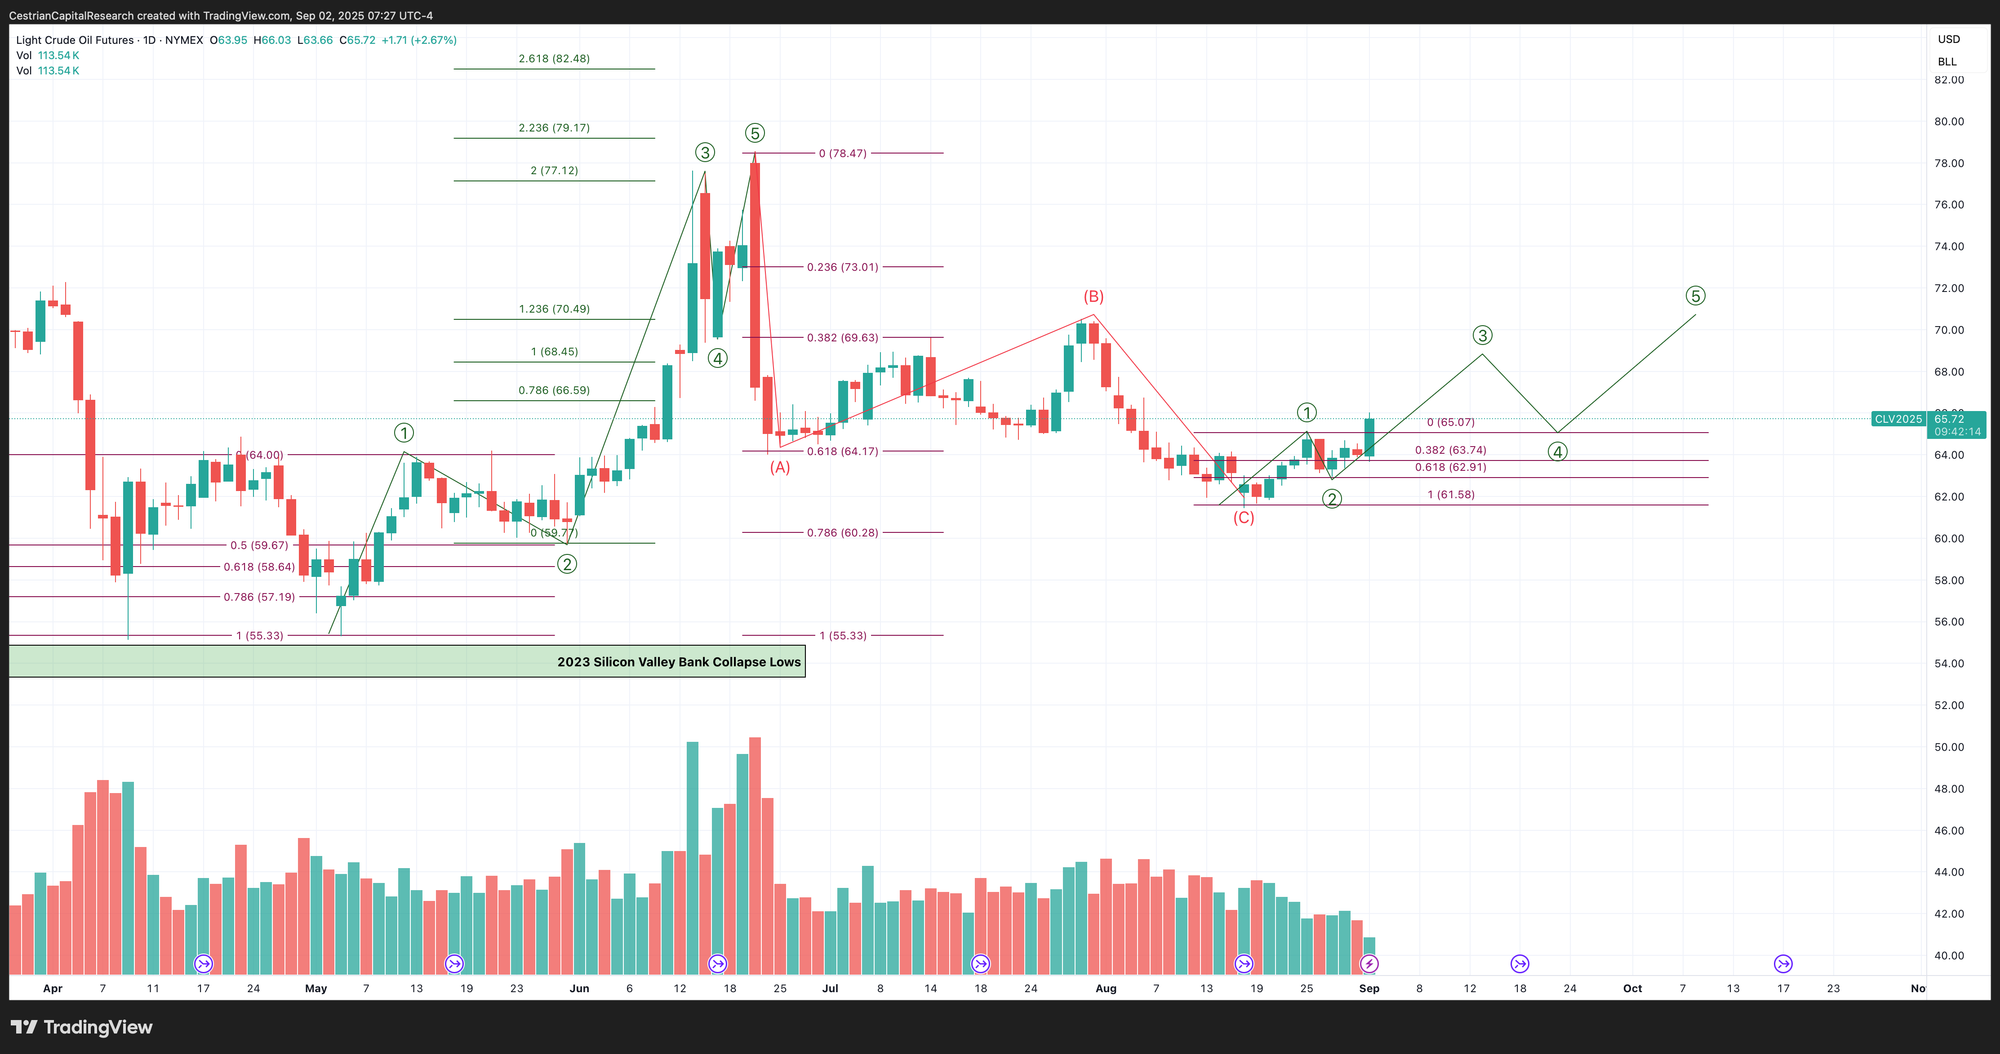
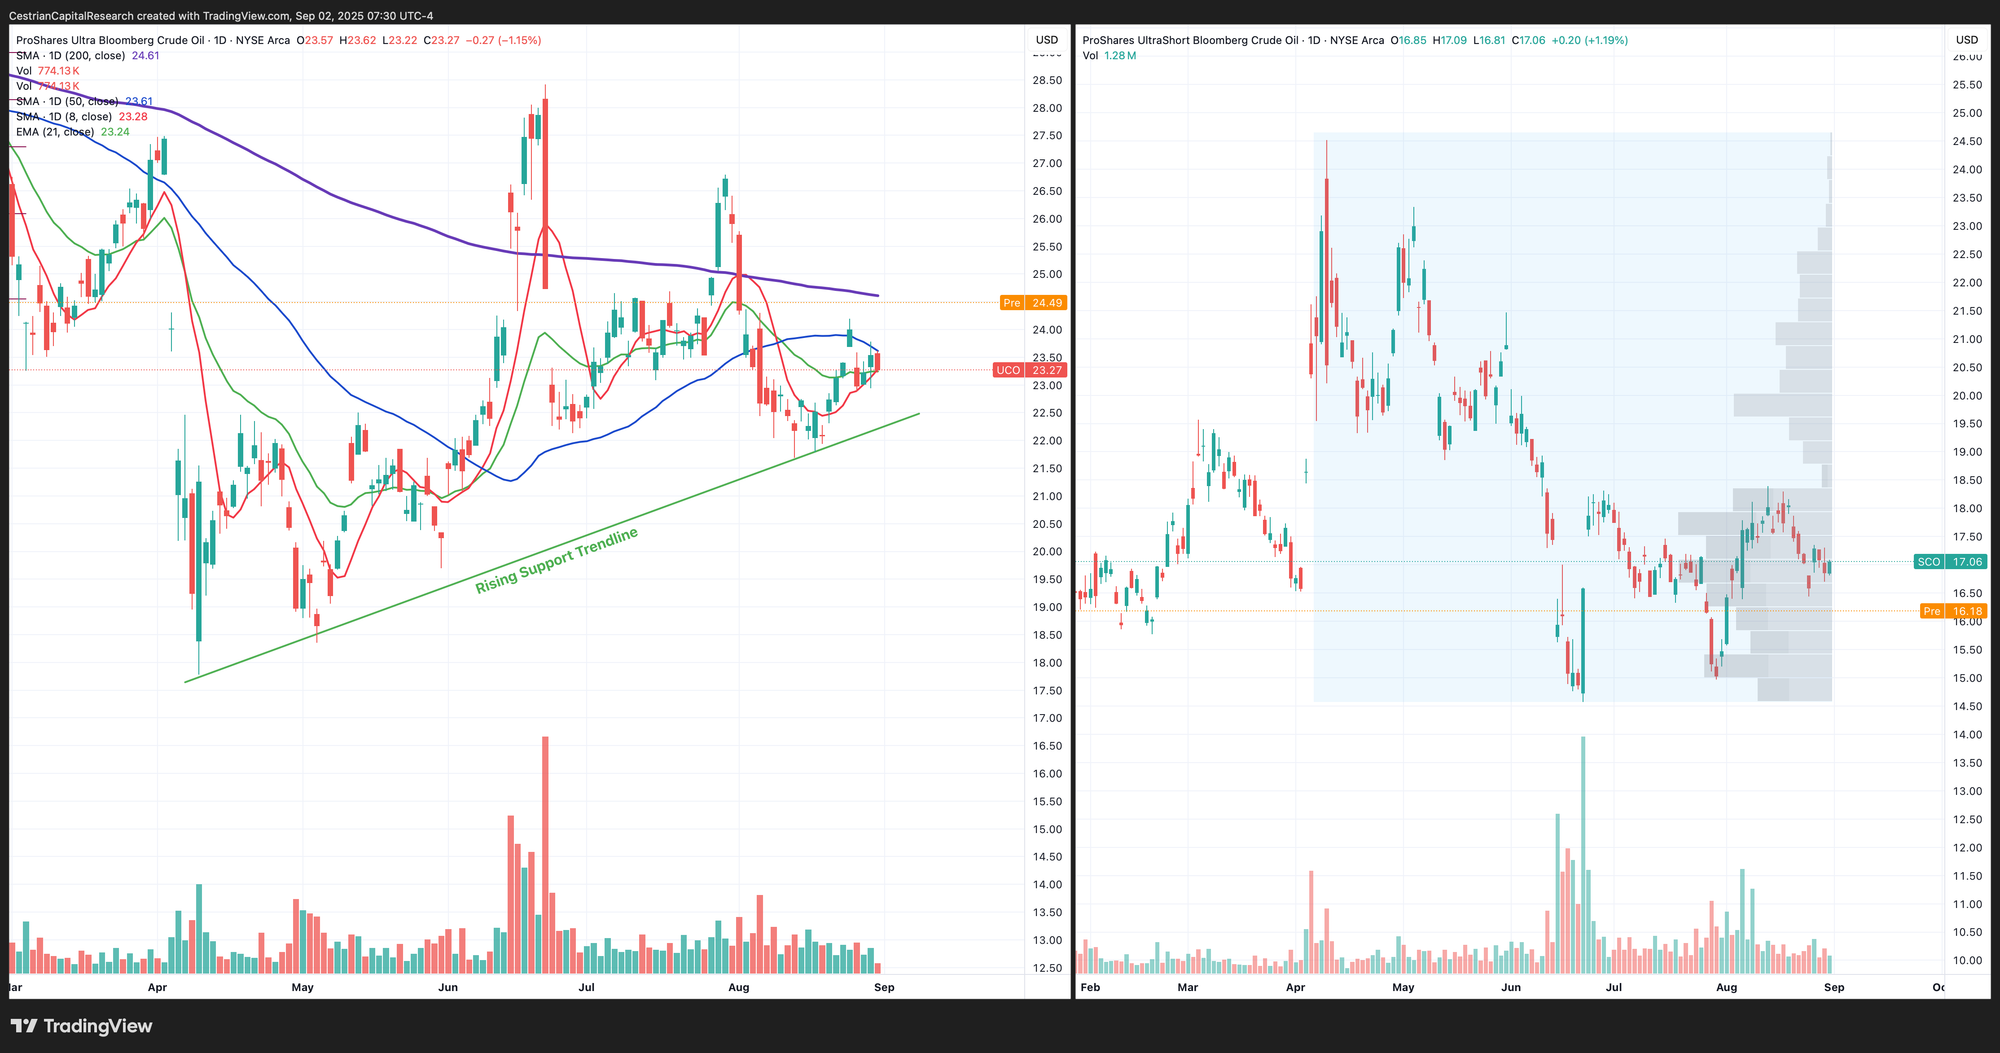
Oil (USO / WTI / UCO)
No change on this timeframe.
Confirmed a Wave 3 up on this timeline - now up and over the prior Wave 1 high.
2x Levered Long (UCO) / Short (SCO)
Note - Leveraged ETF. Read the fund documentation if you are considering using this instrument.
UCO pushing up at the 200-day moving average from below. Very bullish over it (about $24.75 on the daily close would confirm).
Disclosure: No position in oil.
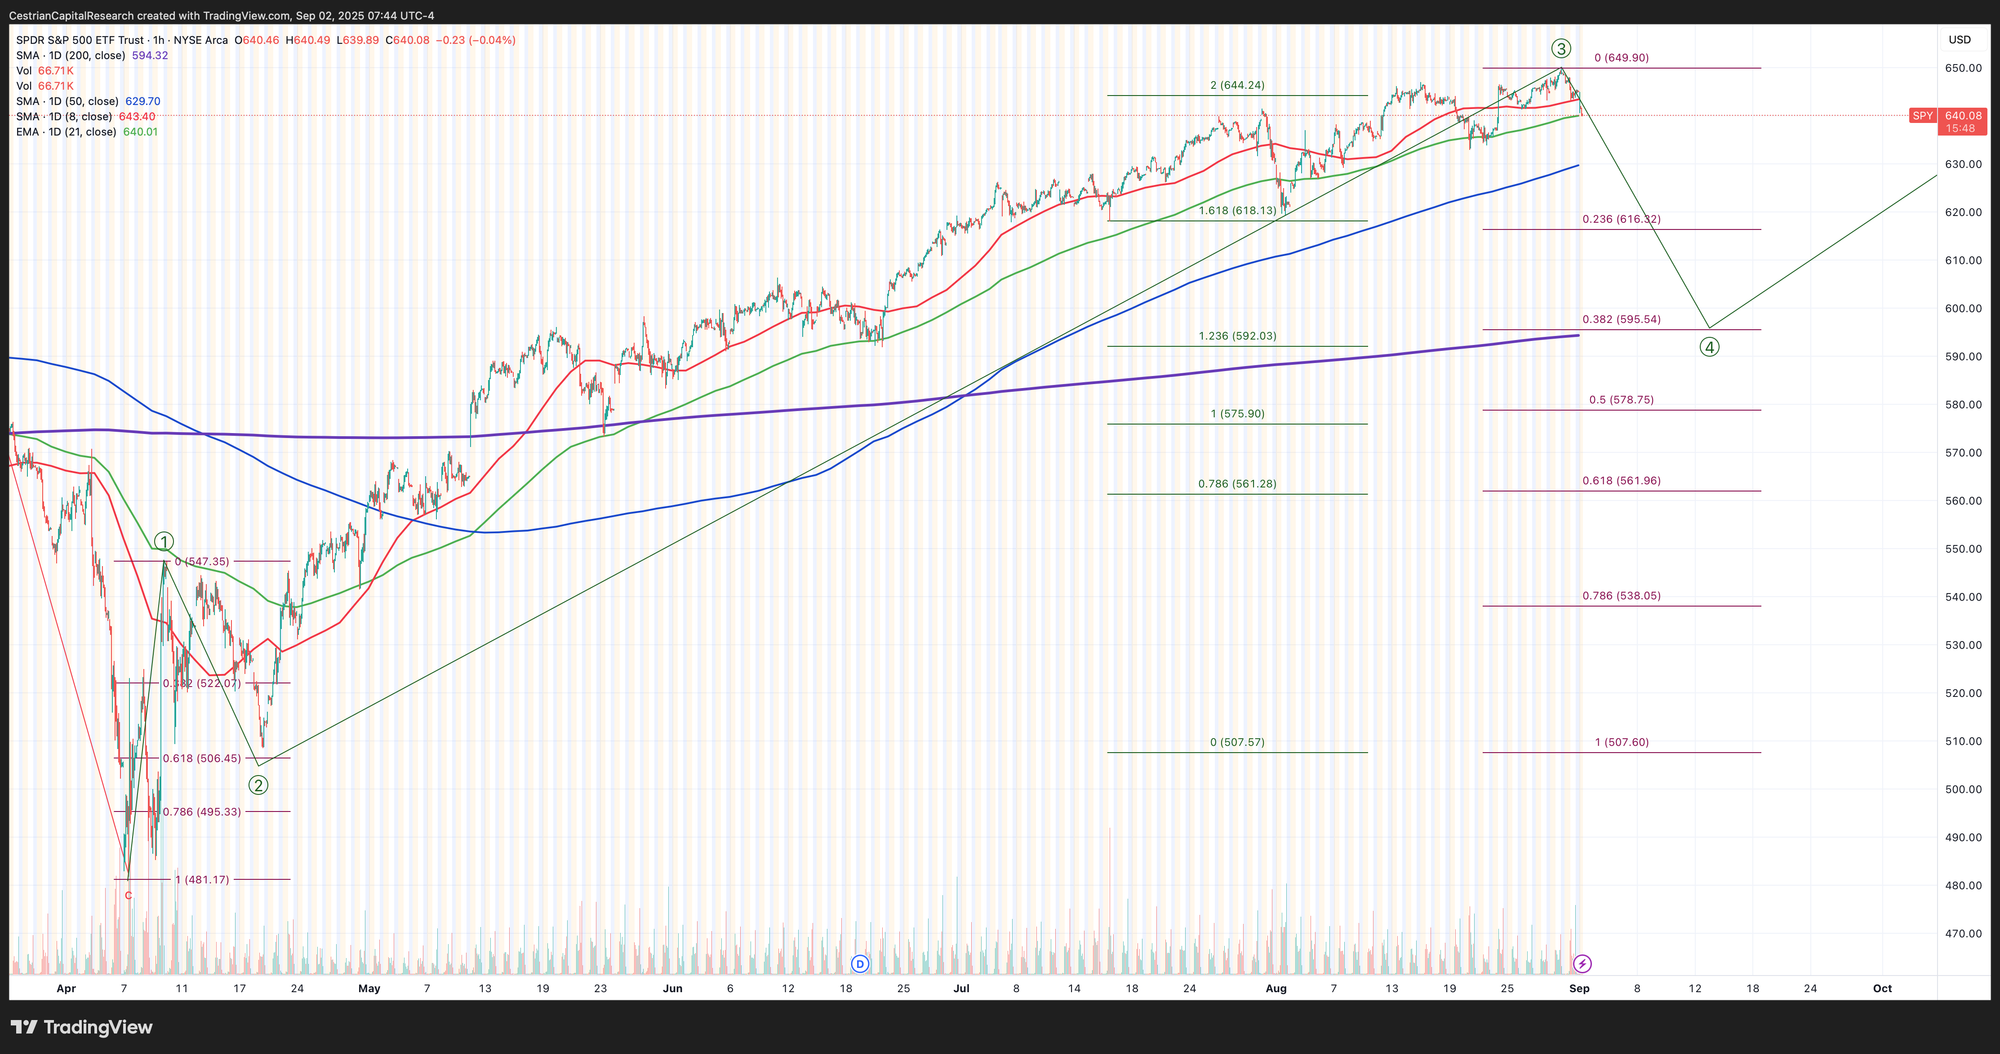
S&P500 / SPY / UPRO
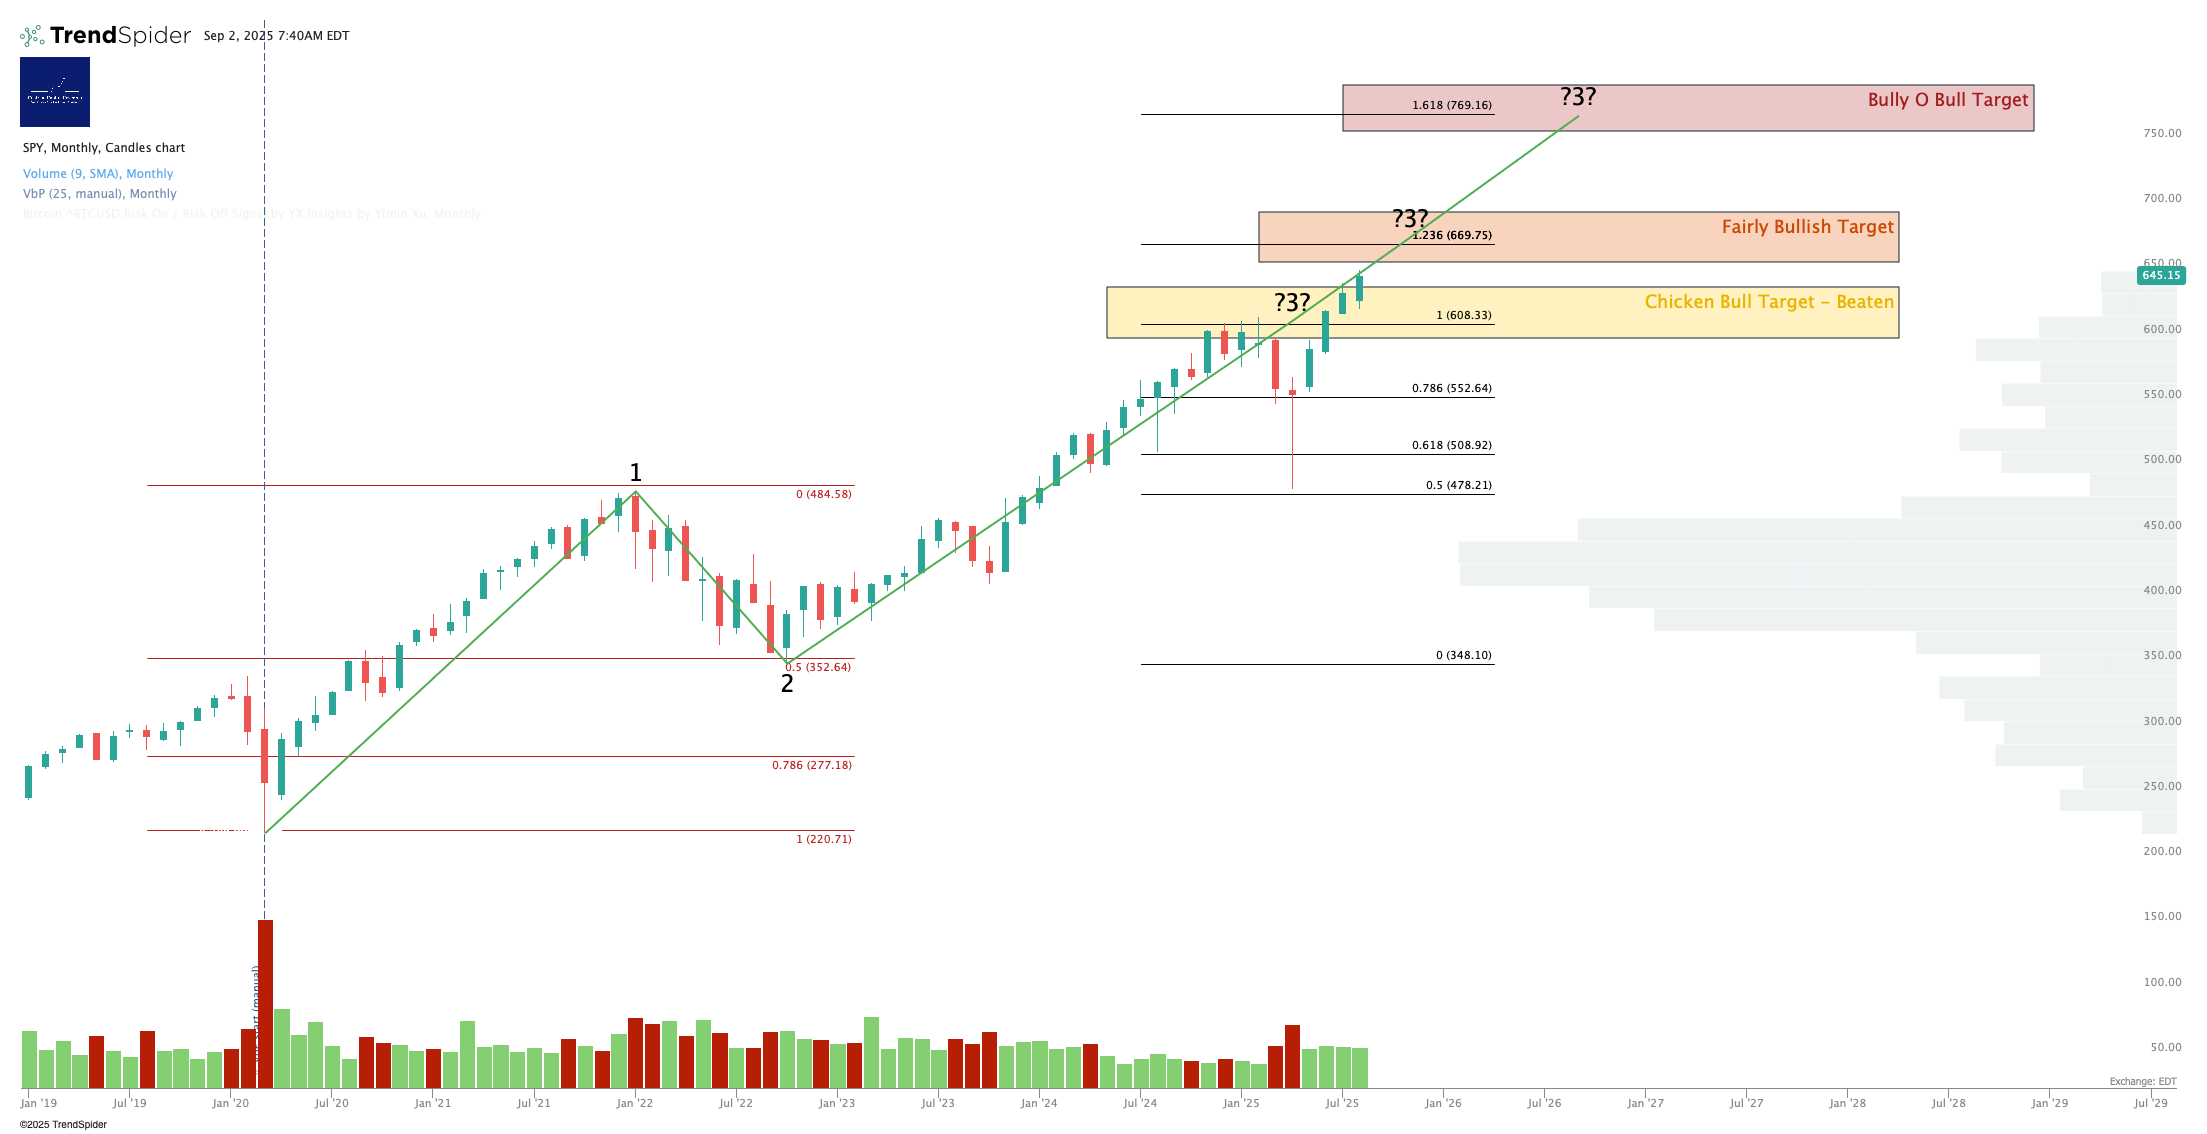
Zoomed out, away from the daily psychodrama, you can see that the S&P is just continuing its slow grind upwards.
Holding (just) over the 21-day EMA in pre-market trading. A drop below the green line - with a daily close below it, I should add - is meaningful.
3x Levered Long / Short ETF - UPRO, SPXU
Note - Leveraged ETF. Read the fund documentation if you are considering using this instrument.
Will follow SPY. Care needed in UPRO if SPY starts to drop, as the daily leverage will hurt. The accumulation pattern in SPXU remains clear as day.
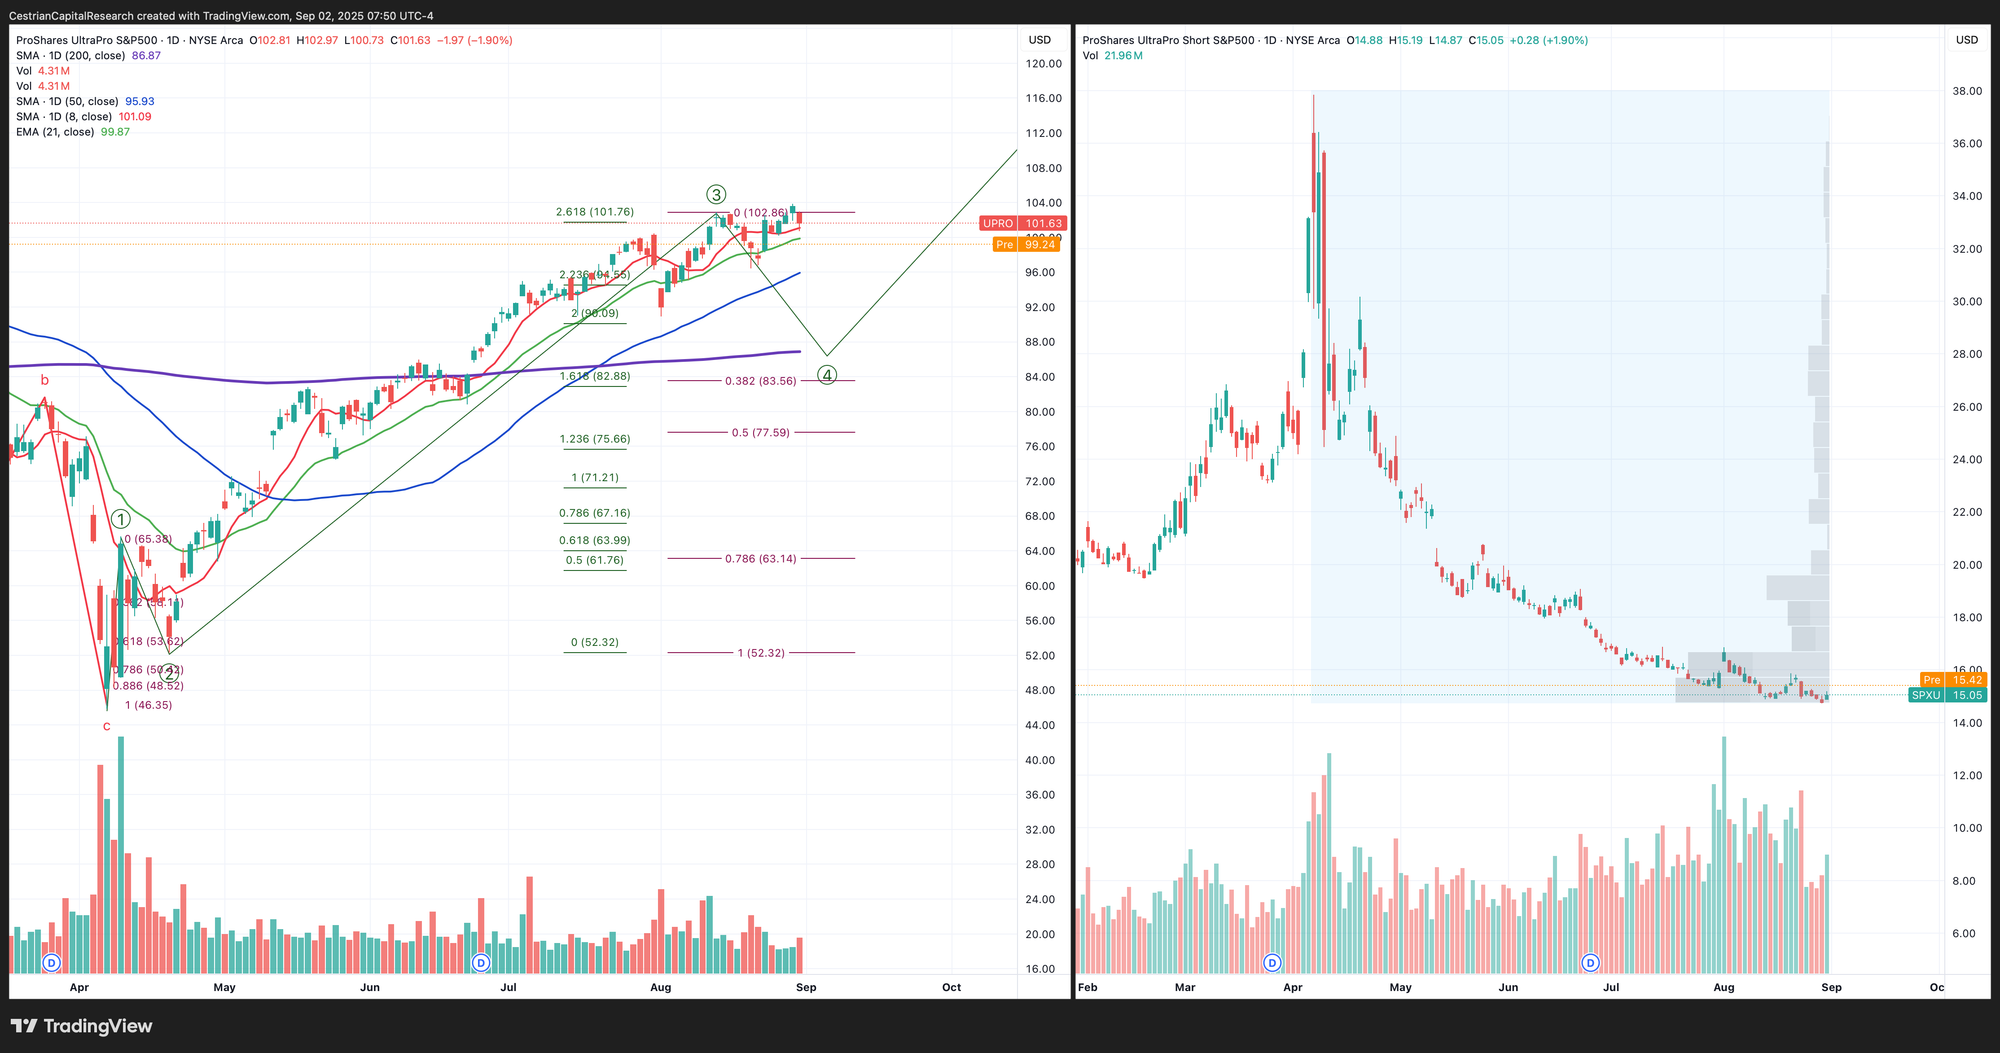
Disclosure: I am long $IUSA, and long SPY puts for September expiry. In aggregate net long the S&P.
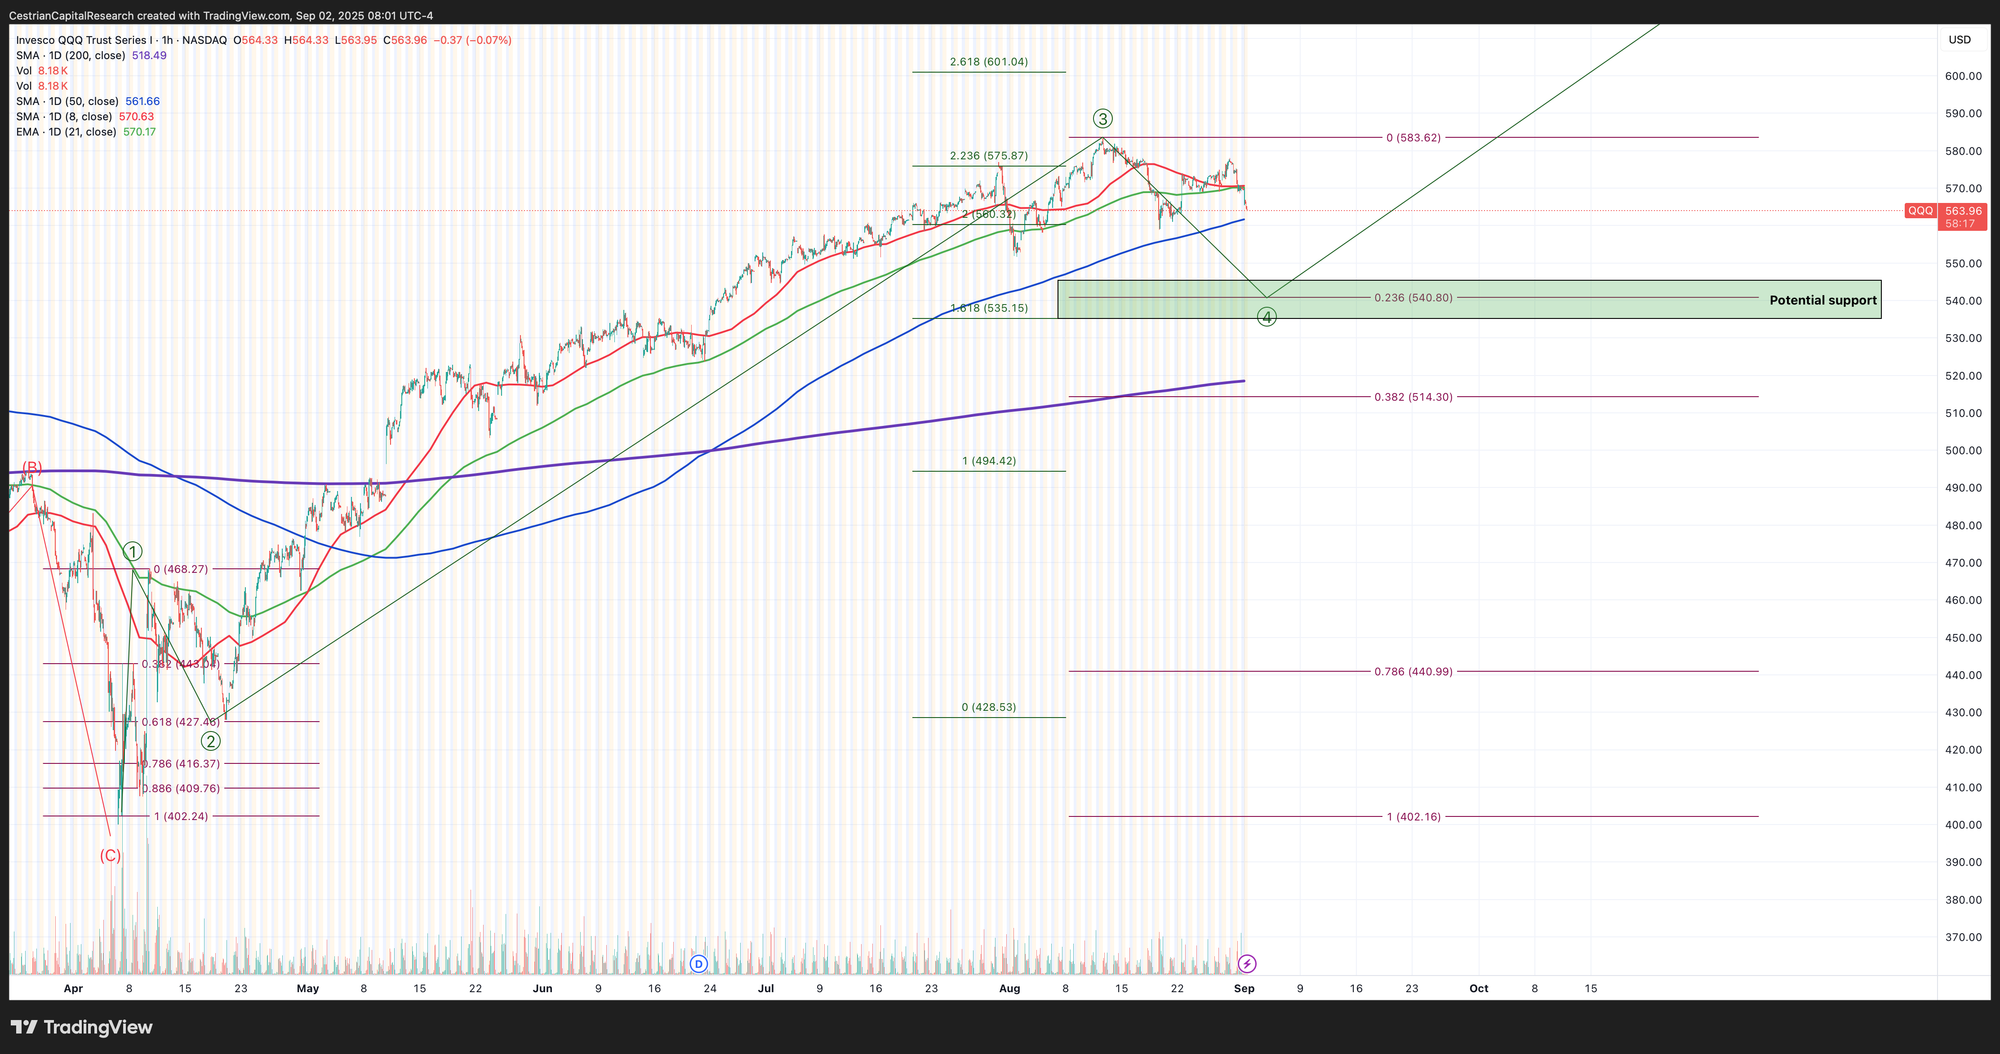
Nasdaq-100 / QQQ / TQQQ
No change on this timeframe. Bullish.
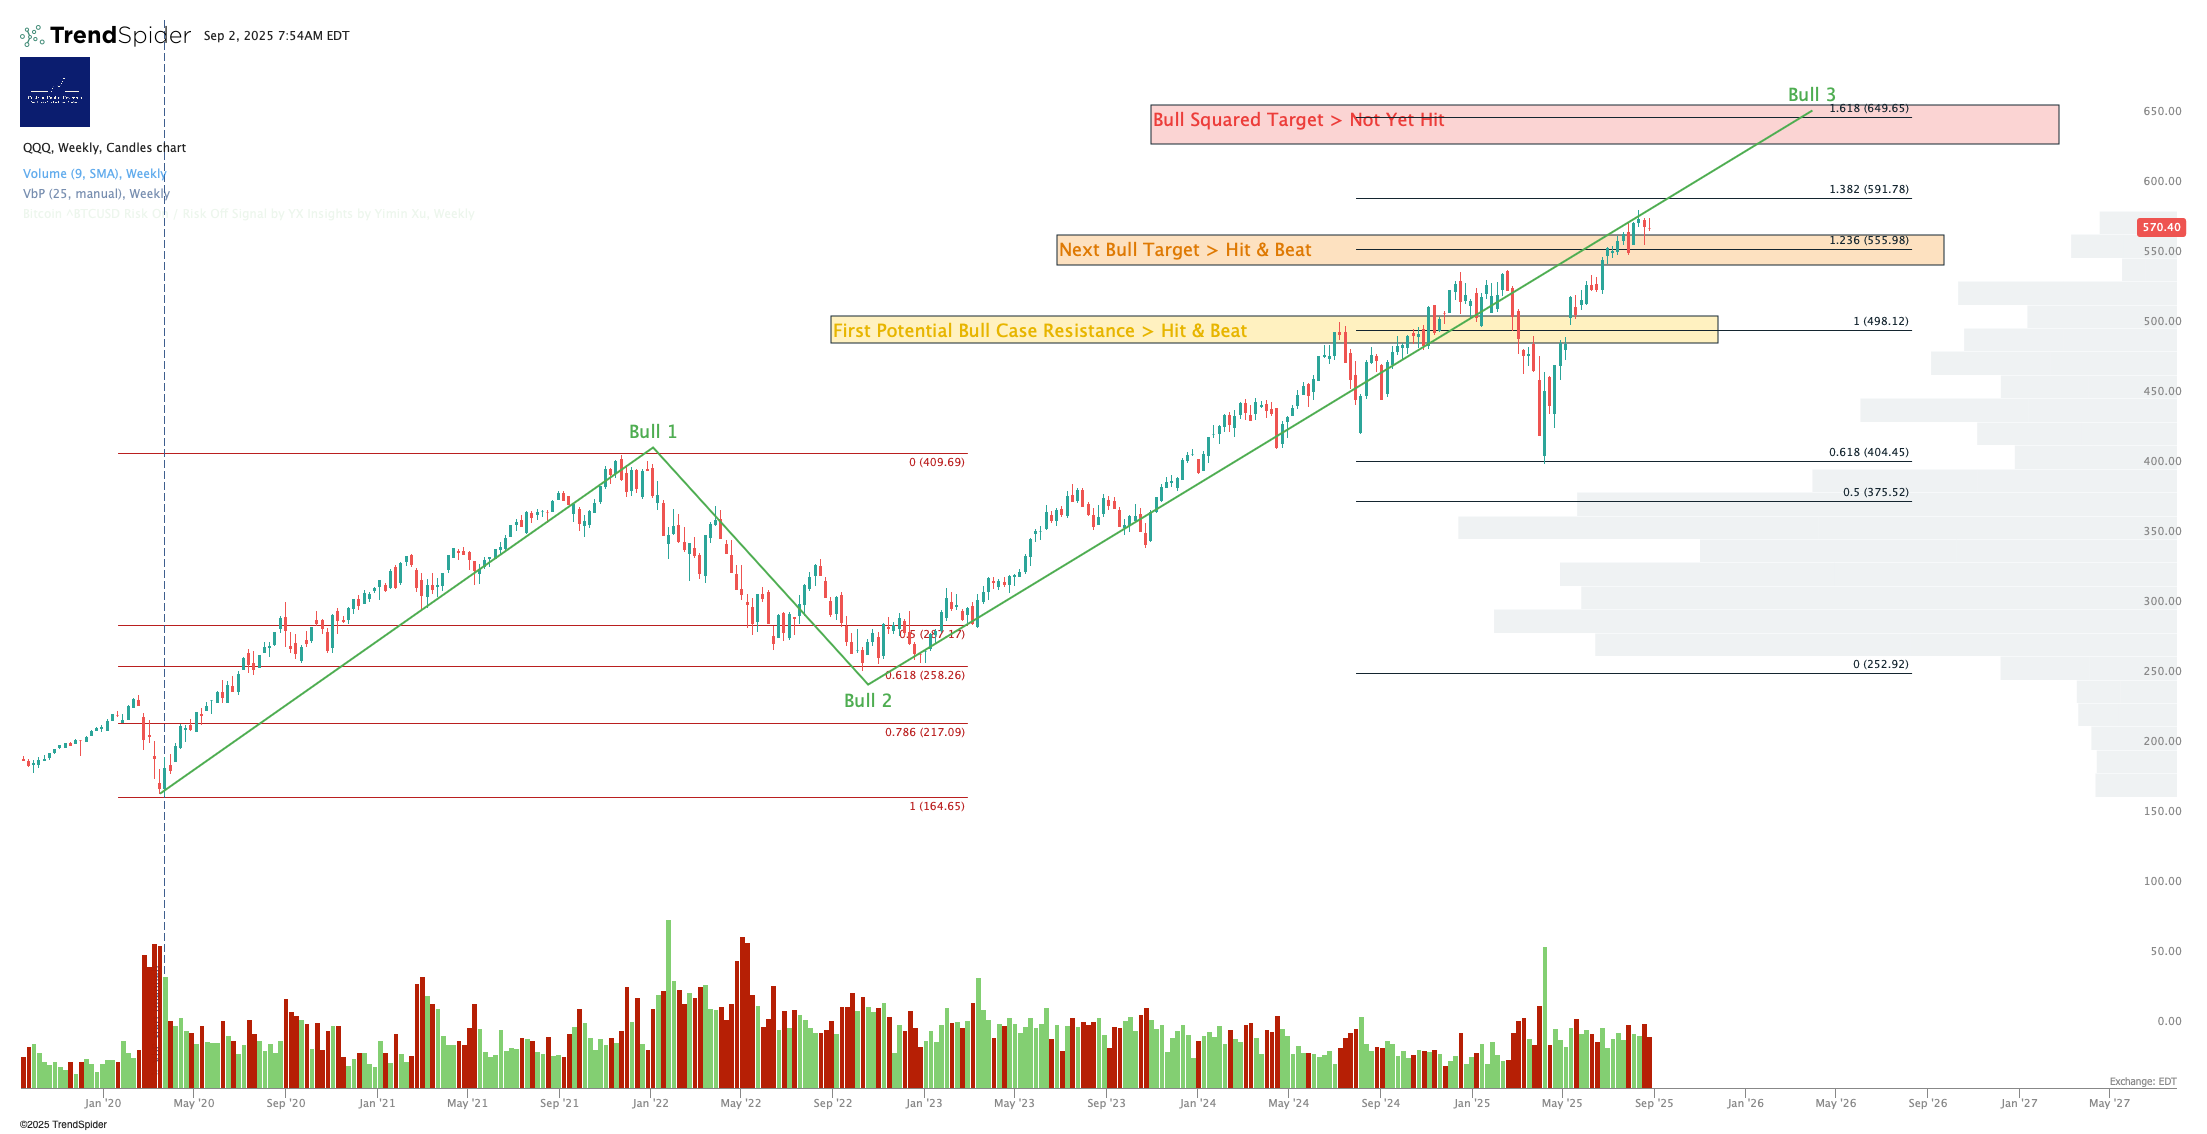
Looks like QQQ may have a date with its 50-day moving average at $562. A break of the 50-day would be meaningful and put the 200-day at $520 or so in play.
Should that happen - a touch of the 200-day - plenty of late, levered longs will lose their minds and the END SHALL BE DECLARED NIGH. But it won’t the the end in my view, just a modest Wave 4 pullback.
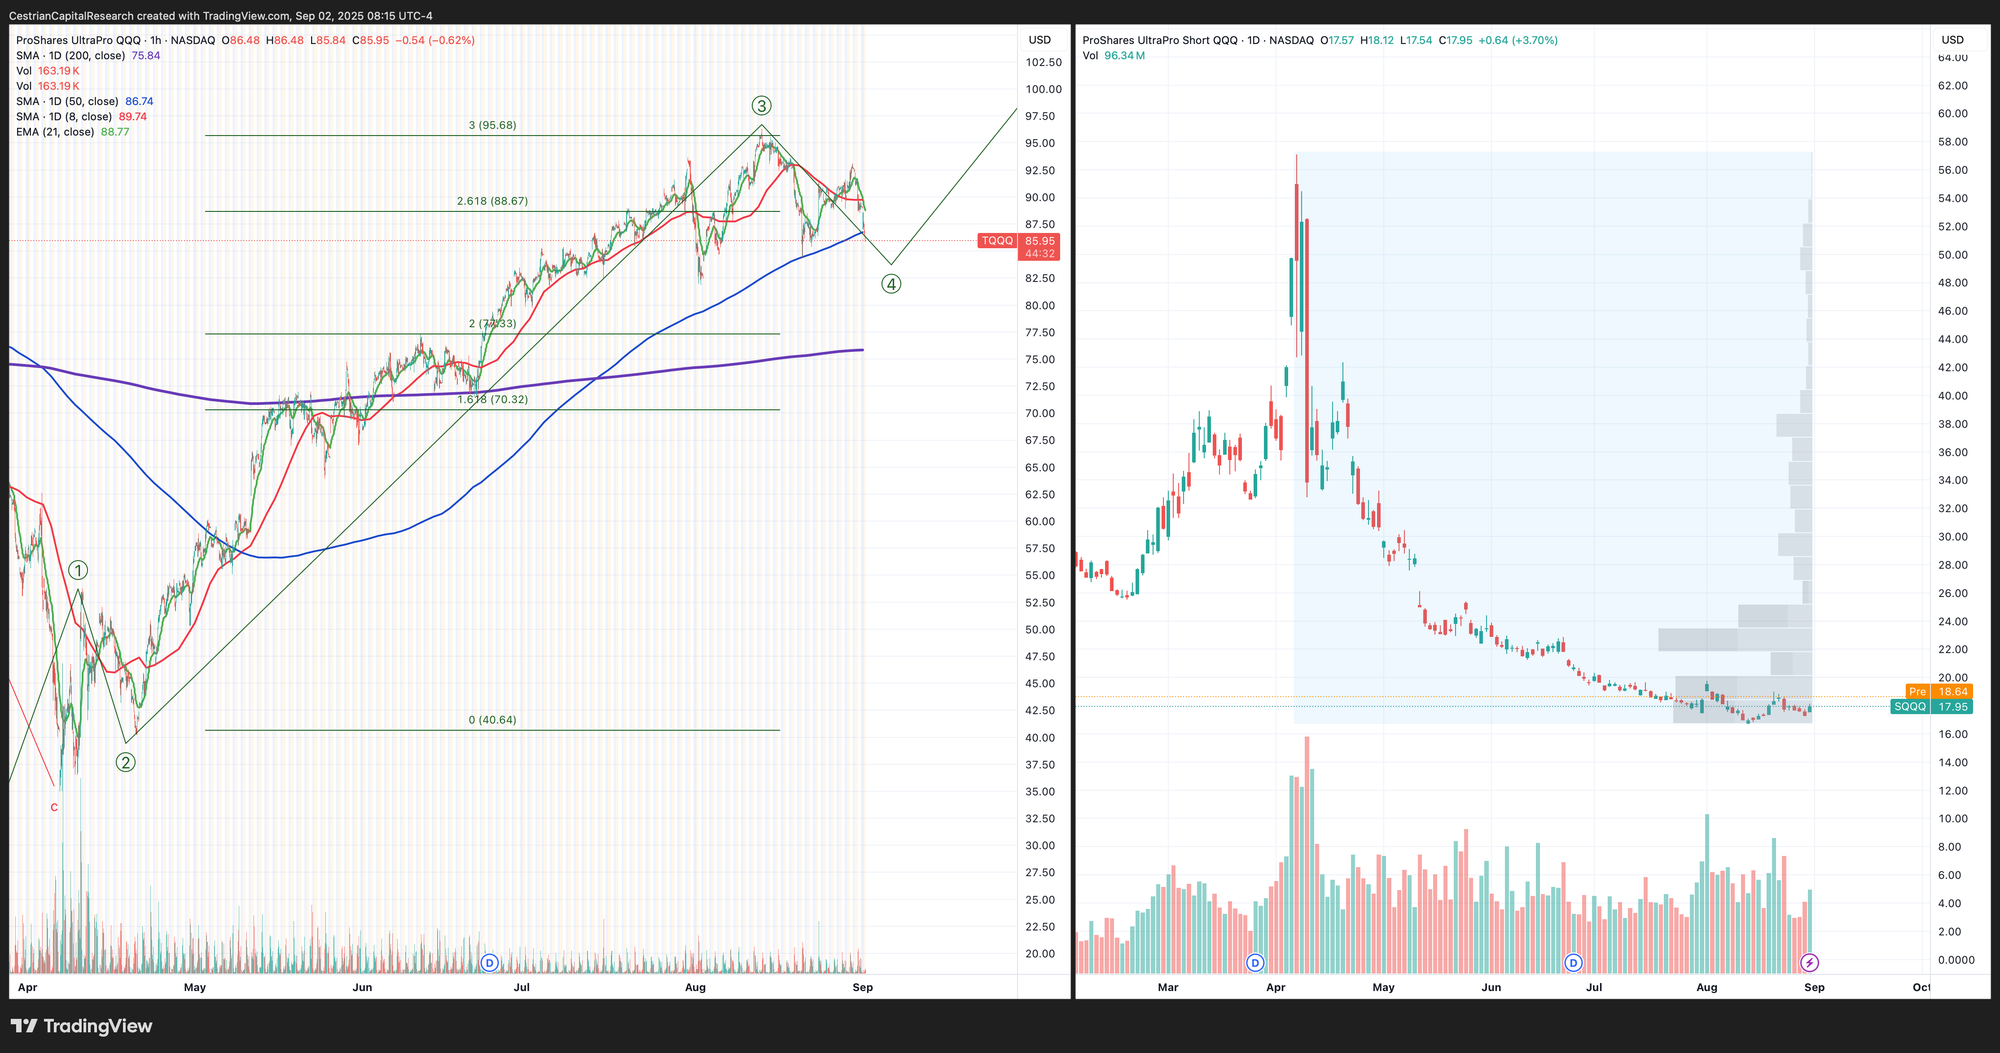
Levered Nasdaq - TQQQ Long / SQQQ Short
Note - Leveraged ETF. Read the fund documentation if you are considering using this instrument.
TQQQ below the 50-day in pre-market trading.
SQQQ accumulation pattern remains.
Choose your own ending.
Disclosure: I am hedged 1.05:1 $TQQQ:$SQQQ, and have $TQQQ and $QQQ puts for September expiry. Overall net long the Nasdaq.
Alex King, Cestrian Capital Research, Inc - 2 September 2025.
DISCLOSURE - Cestrian Capital Research, Inc staff personal accounts hold long positions in, inter alia, TQQQ, SQQQ, IUSA, SOXL, SOXS, SMH, TLT, DTLA, ETHE, ETHA; long September TQQQ, QQQ and SPY puts.