
Warren Buffett Isn’t Always Wrong

DISCLAIMER: This note is intended for US recipients only and, in particular, is not directed at, nor intended to be relied upon by any UK recipients. Any information or analysis in this note is not an offer to sell or the solicitation of an offer to buy any securities. Nothing in this note is intended to be investment advice and nor should it be relied upon to make investment decisions. Read our full disclaimer, here.
Anti-Environmental Tourism
by Alex King, CEO, Cestrian Capital Research, Inc.
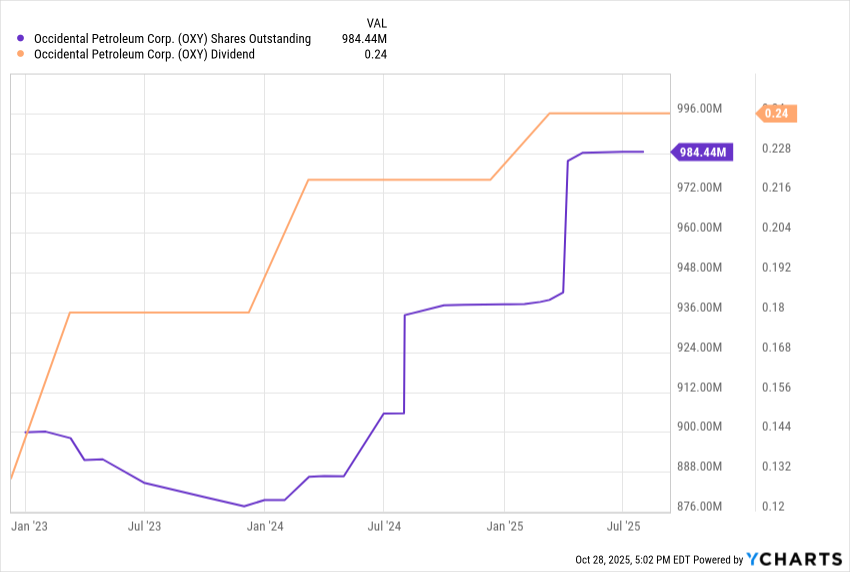
I don’t know much about the oil industry and I know even less about why Mr. Buffett is so taken with $OXY, the price of which has fallen like so much ancient sediment in recent years. It more than halved from the post-Ukraine-invasion high of $77 in August 2022 to just $35 at the post-Liberation Day lows in April this year. “Ah, but the dividend!” you may say. "And the buybacks increasing Berkshire’s ownership stake!”, you may add. To which I would say, this doesn’t look like a classic Berkshire stock. In fact $ORCL looks a lot more like a classic Berkshire stock.
I think, however, that there may be a nice swing trade opportunity in $OXY. Let’s deal with that right here and then you can look at the numbers below; though I think the numbers are entirely tangential to this opportunity.
Here’s how the chart looks to me. You can open a full page version, here.
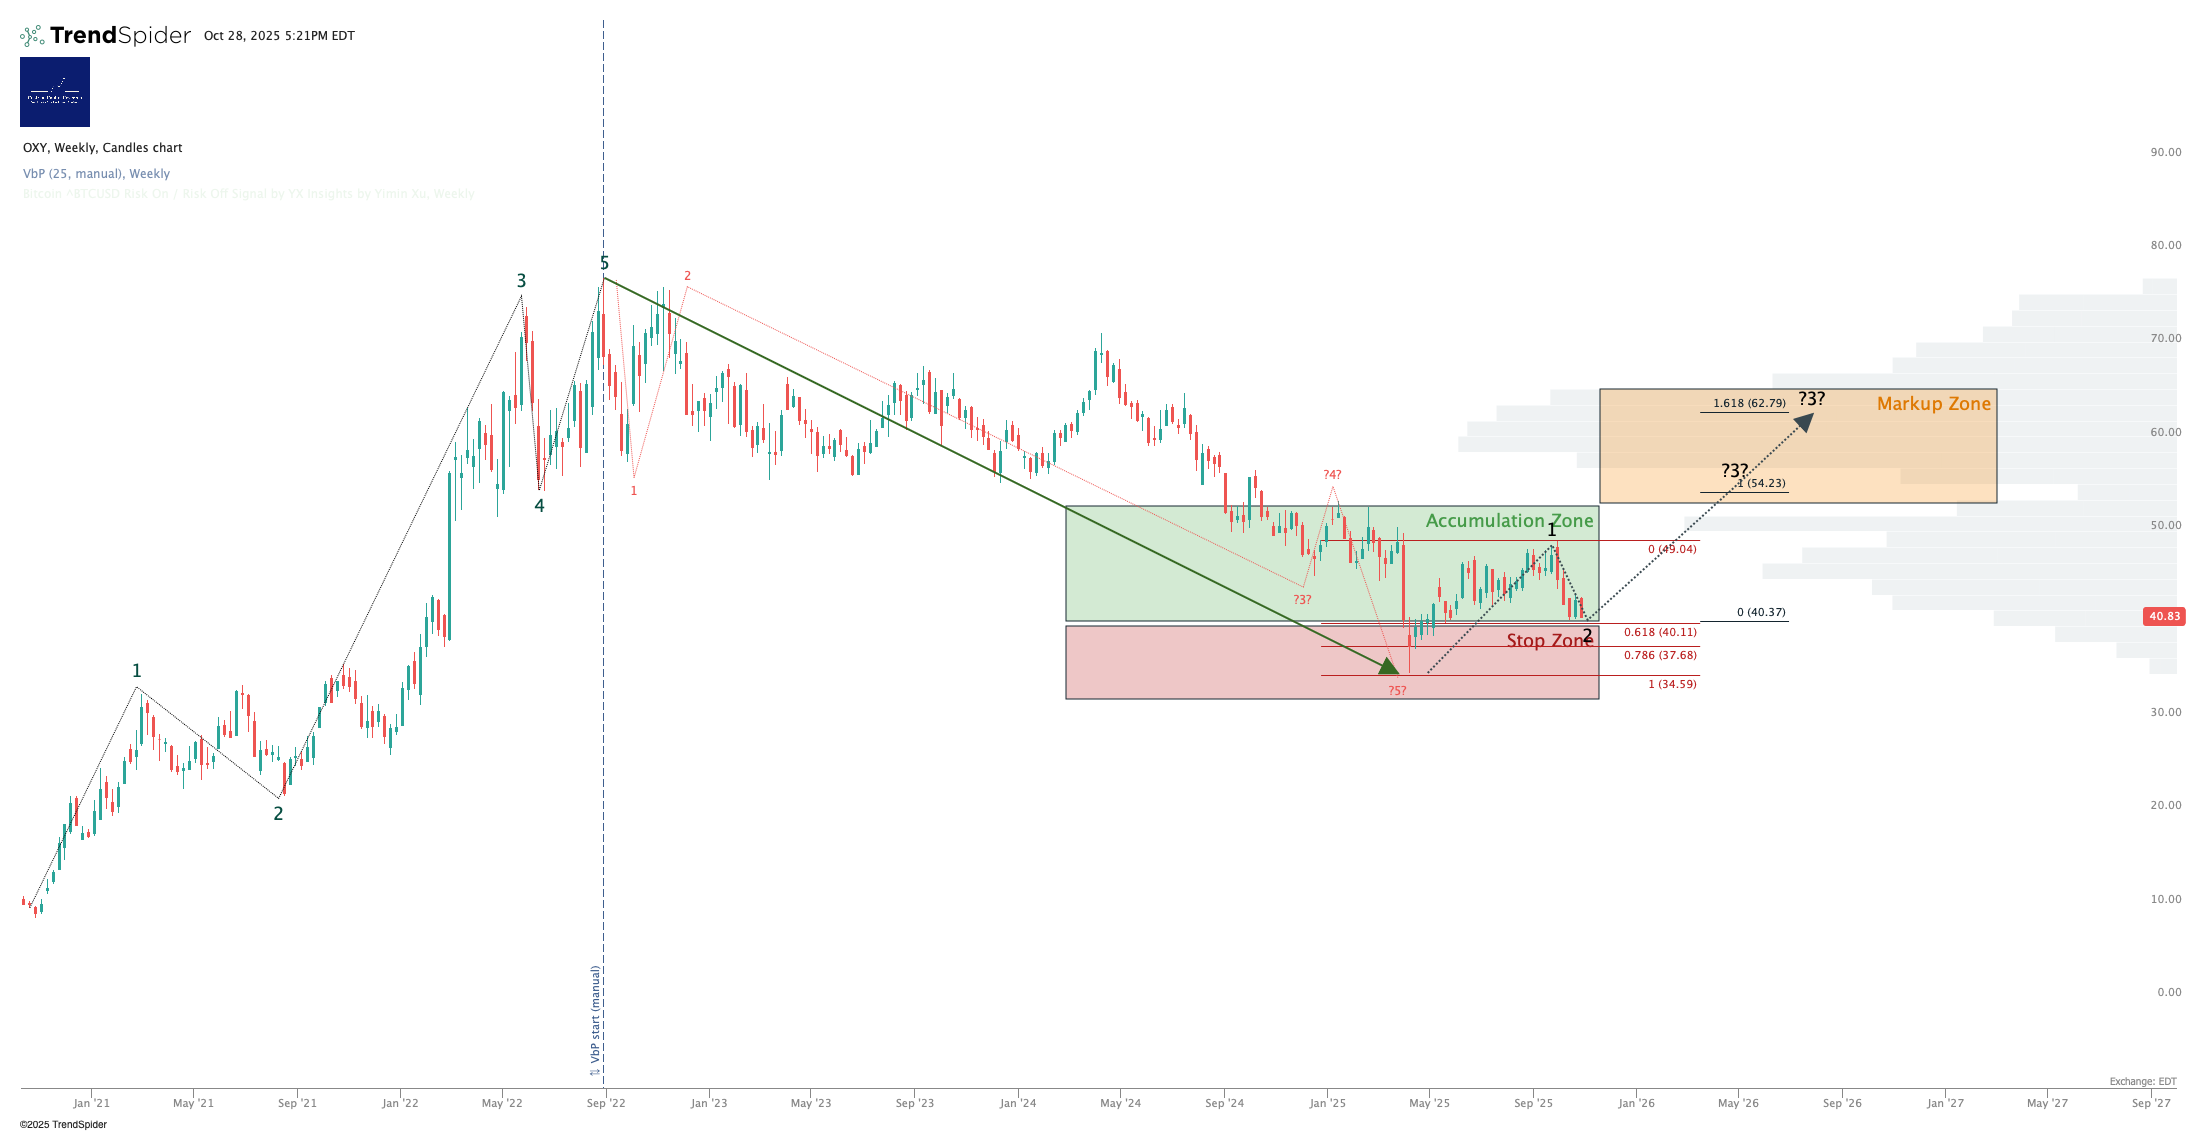
The suggestion that a local low might be in is where the stock has found support in recent days. It began a move up from that $35 low in April, hit a local high of $49 at the end of September, and then fell back to a level that has held for three weeks now, being around $41 which is the .618 Fibonacci retracement of that $35-$49 April to September move.
Now, anything can happen but a .618 Fib retracement like that - tested over three weeks with no willing sellers below - looks a lot like a Wave 2 low with the Wave 1 being the April to September bull move. And if that’s a Wave 2 low, a Wave 3 may follow.
Upside price levels that could be hit:
- $49 (the prior Wave 1 high)
- $52 (the 100% Fibonacci extension of the prior Wave 1 placed at the Wave 2 low, ie. a lame Wave 3 high)
- $62 (the 1.618 Fibonacci extension of the same, a more conventional Wave 3 high).
Downside levels I think make sense as a stop:
- A touch below $37 (that’s the .786 retracement of the April to September move. If the stock breaches that to the downside then this chart is likely wrong and it’s better to be out with just a small loss).
So, $4 downside from here vs. $8 - $11 - $21 upside depending on how much you like to ride your luck if it starts moving. I think that’s a pretty good risk/reward mix.
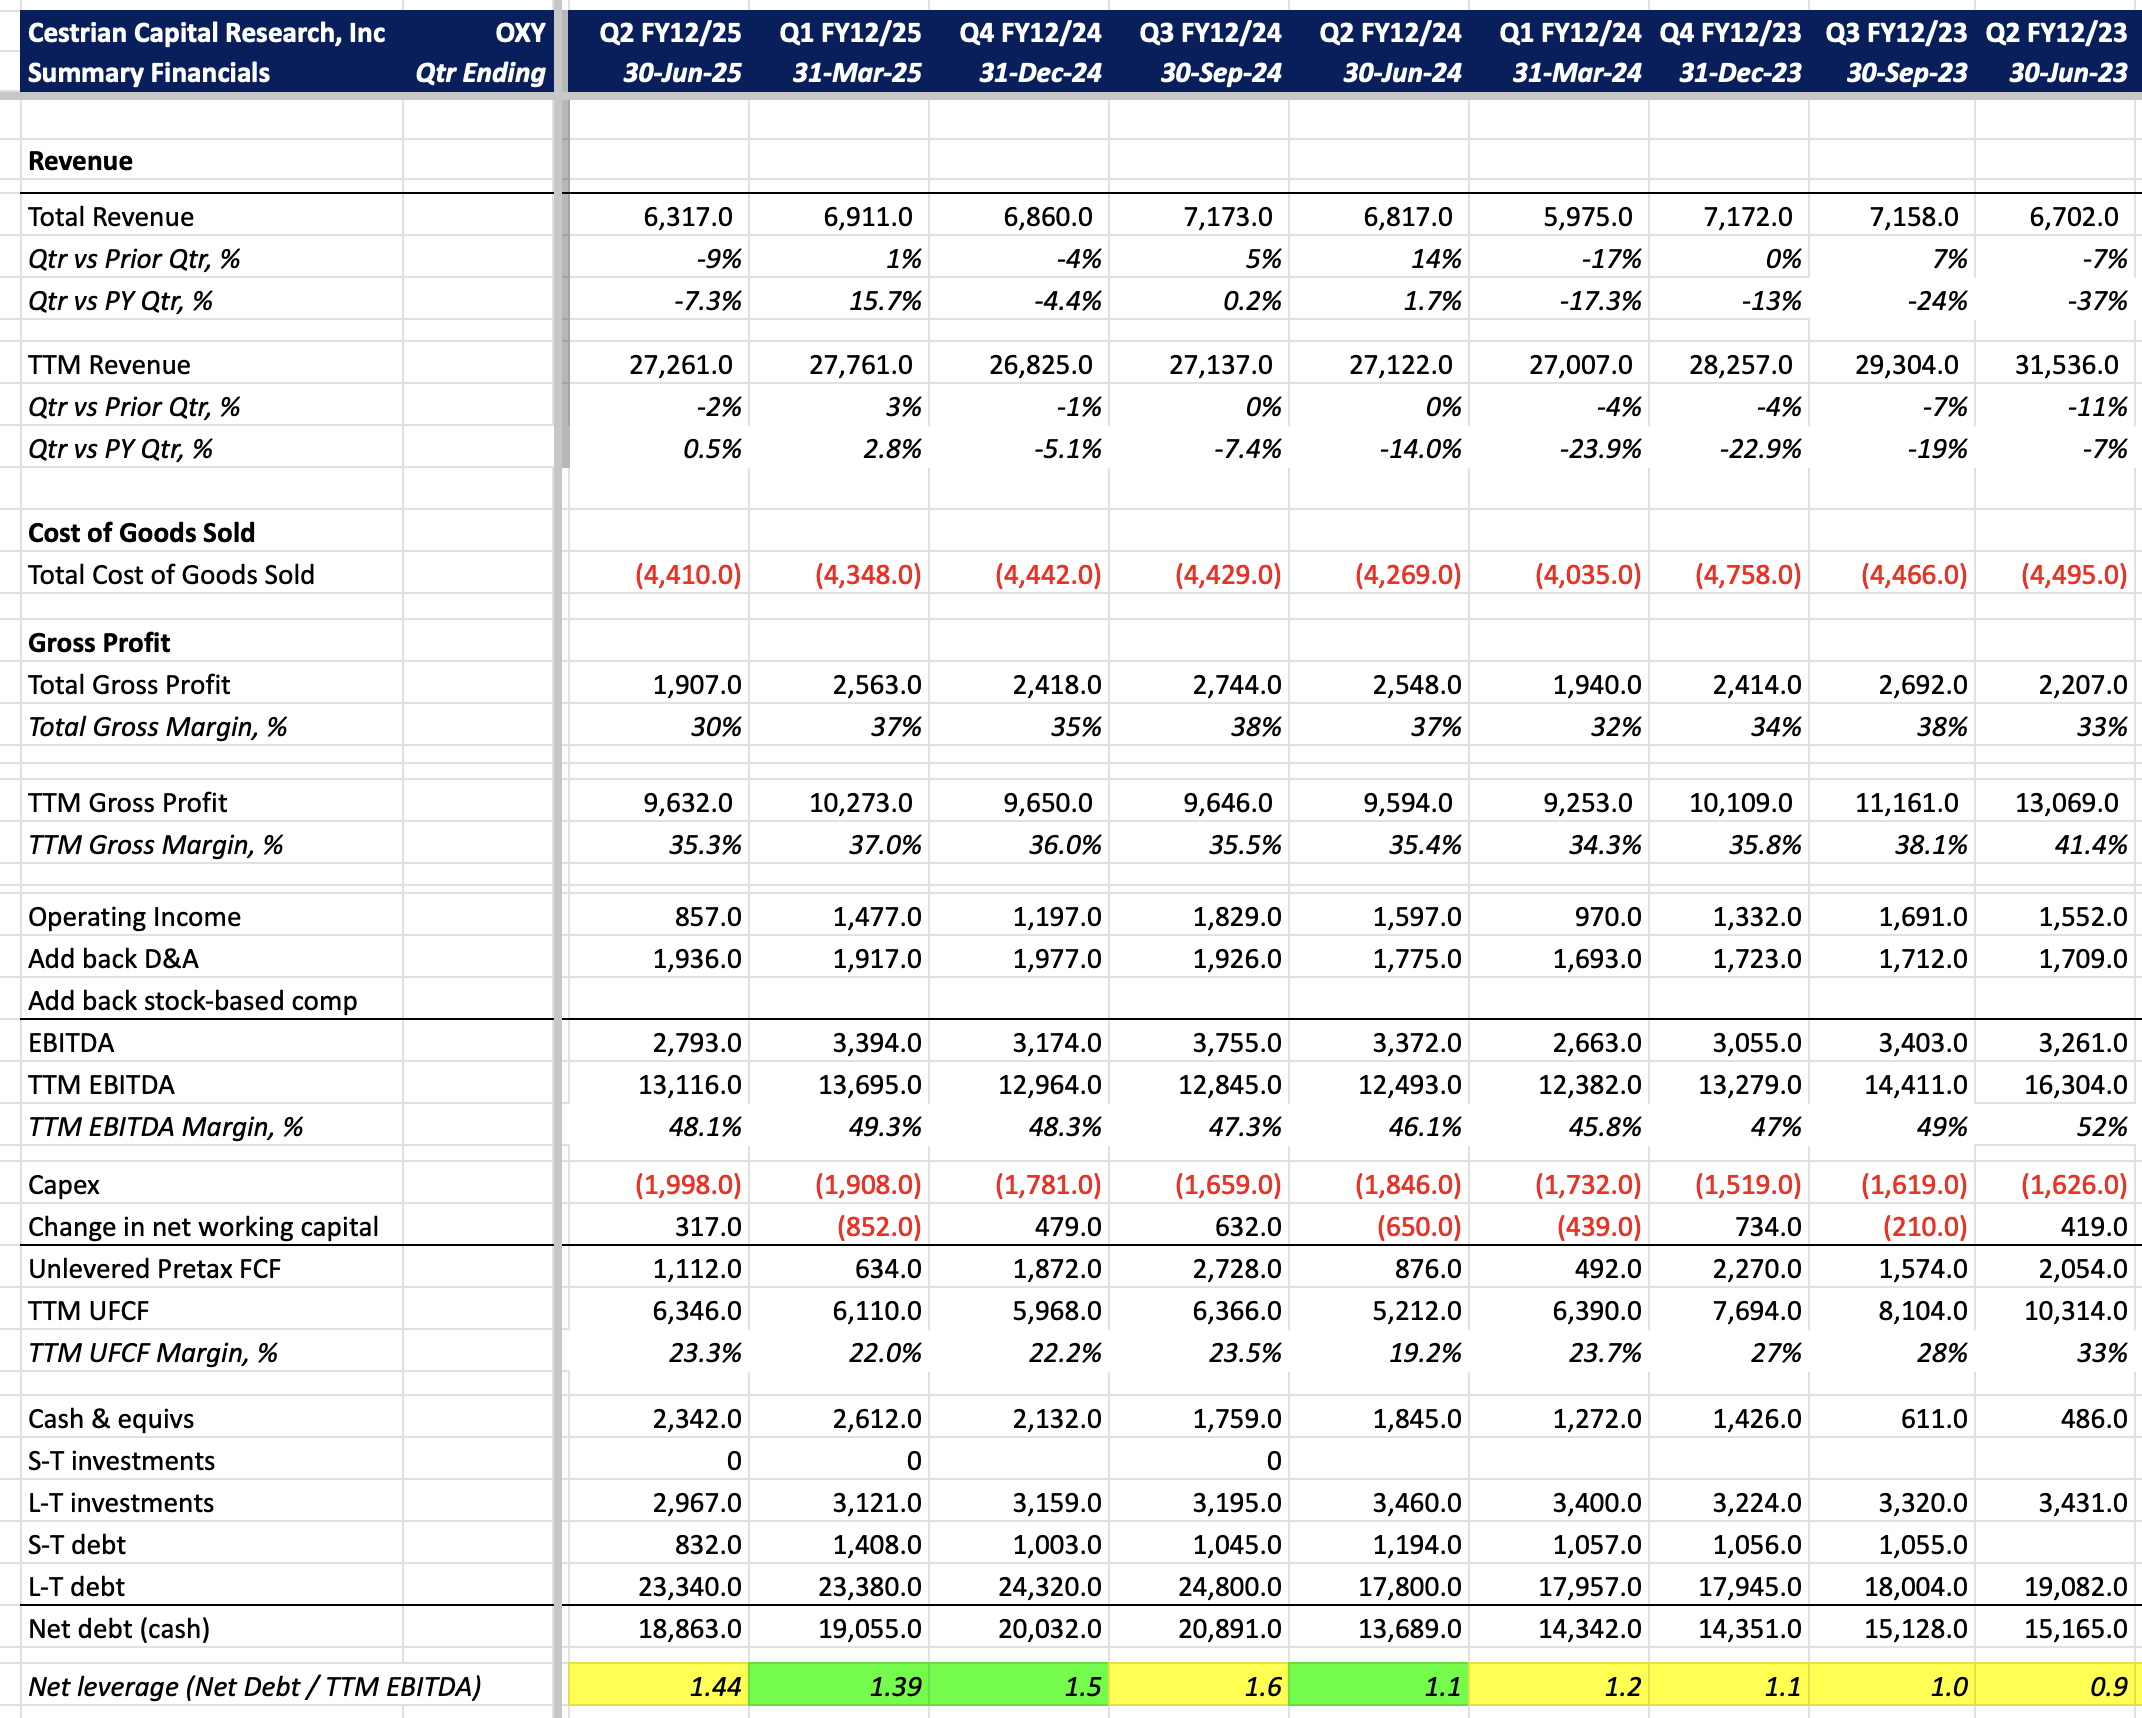
Fundamentals
Fundamental value here is more driven by M&A and balance sheet activity than it is organic performance. Here’s the reported financials anyway.
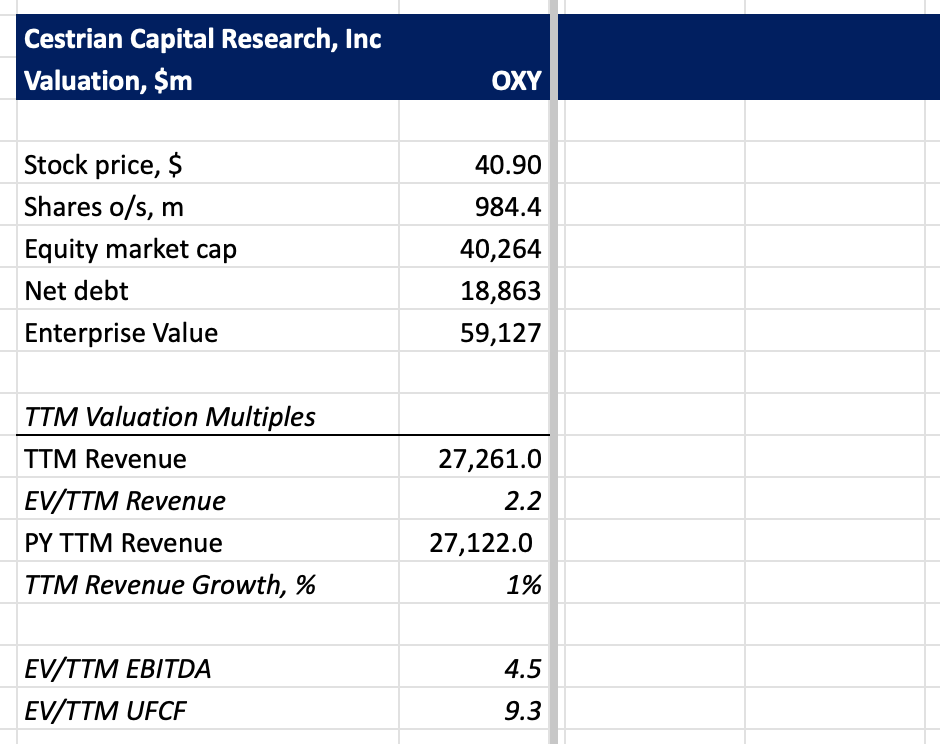
Valuation
The stock is inexpensive in my view; sub 10x TTM unlevered pretax FCF and leverage is muted.
Rating
Based on the above chart we rate the stock at Accumulate.
Cestrian Capital Research, Inc - 28 October 2025.
DISCLOSURE: Cestrian Capital Research, Inc staff personal accounts have no positions in $OXY at the time of publication, but intend to open position(s) in $OXY at the New York cash open on Wednesday 29 October.