
Market On Open, Tuesday 24 June

DISCLAIMER: This note is intended for US recipients only and, in particular, is not directed at, nor intended to be relied upon by any UK recipients. Any information or analysis in this note is not an offer to sell or the solicitation of an offer to buy any securities. Nothing in this note is intended to be investment advice and nor should it be relied upon to make investment decisions. Read our full disclaimer, here.
World Peace?
by Alex King, CEO, Cestrian Capital Research, Inc
The reason markets move up at the commencement of hostilities is usually because (1) price-setting investors have known the rough shape and timing of said hostilities for some weeks and have already replenished their cash reserves and/or margin capacity in order to take advantage of the fear-driven selloff that usually precedes shots fired; and (2) because in recent times the commencement of hostilities has not been a physical threat to the great money-centers of the world nor to those who command said monies. The outbreak of war has of late been a wonderful dip to buy. And the cessation of war is what provides short-term exit liquidity to such dip-buyers.
I know a lot more about investing than I do about geopolitics and so I won’t claim to know what the prospects are for a lasting peace are in the Israel/Iran conflict, but I do know that right now there is some market euphoria at the thought of it. The charts today should be read in that light. This move up may see resistance levels broken up and through in the major indices - for some days now I have been pointing out the stubborn resistance levels overhead in the S&P500, the Nasdaq-100, and some sector ETFs like $SOXX - but if not then this is merely the denouement of the bull move up off of the April 7 lows. And if true we will see some selldown before another attempt on new all-time highs.
Our Standing Invitation To The Future
If you aren’t using AI to help you invest and trade more successfully, you are falling behind. I speak as someone who was trained in pure fundamentals; who has spent a decade learning technical analysis to great effect; and who is now layering in AI assistance to raise my game further. You can deny the future if you like, but it will leave you behind if you do.
There are many providers of quantitative signals out there in the market; I am sure some of them are very good and some are not. I am extremely proud of the services we host, from two different quantitative model providers, each of whom are achieving great things. I would invite you to learn all about how they can help you raise your game - be it for your own capital, your clients’ capital, or your investors' capital.
Learn more here:
- Bitcoin and Mag7 Signals From Fridi Technologies
- S&P500, Nasdaq, and Sector ETF Rotation Signals From Upstream Development
Now let’s get to work.
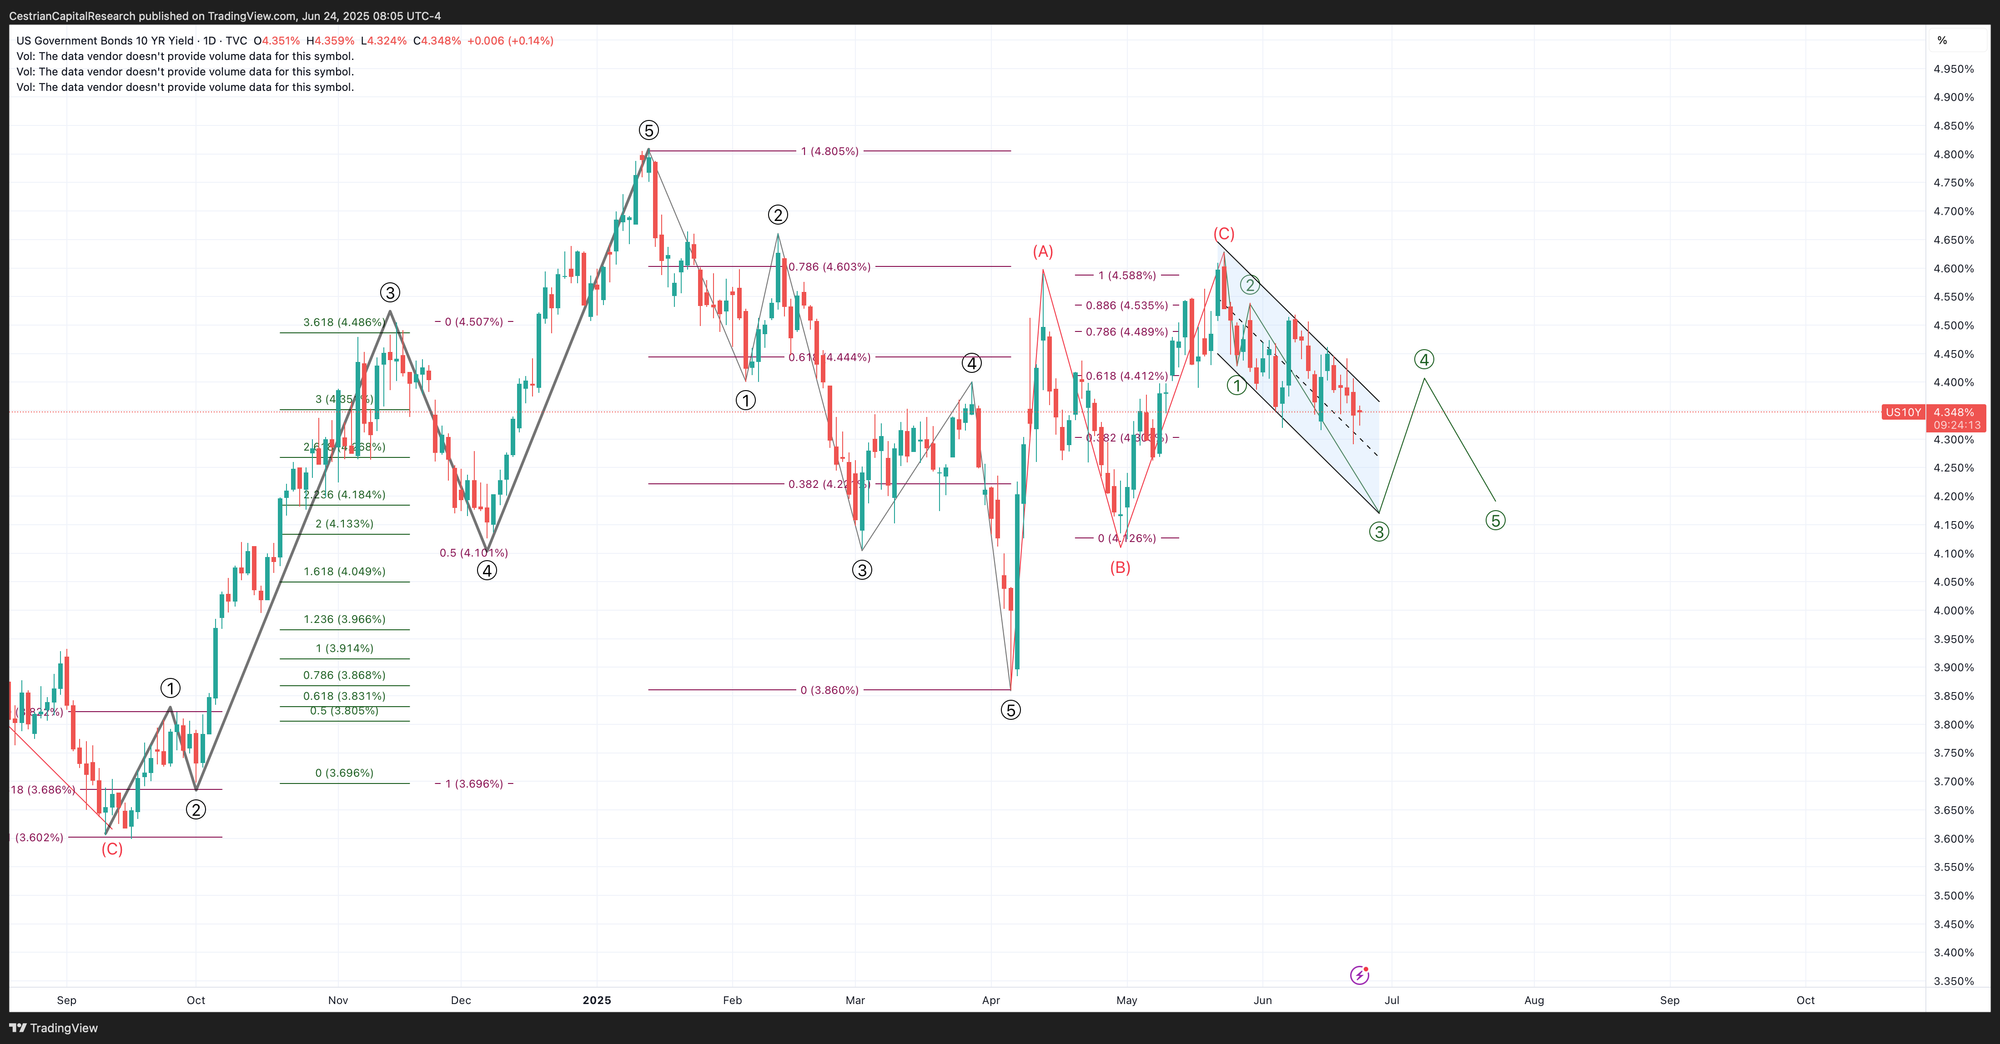
US 10-Year Yield
Downtrend intact.
Equity Volatility
The future looks so bright that … it will soon be time to buy some puts!!
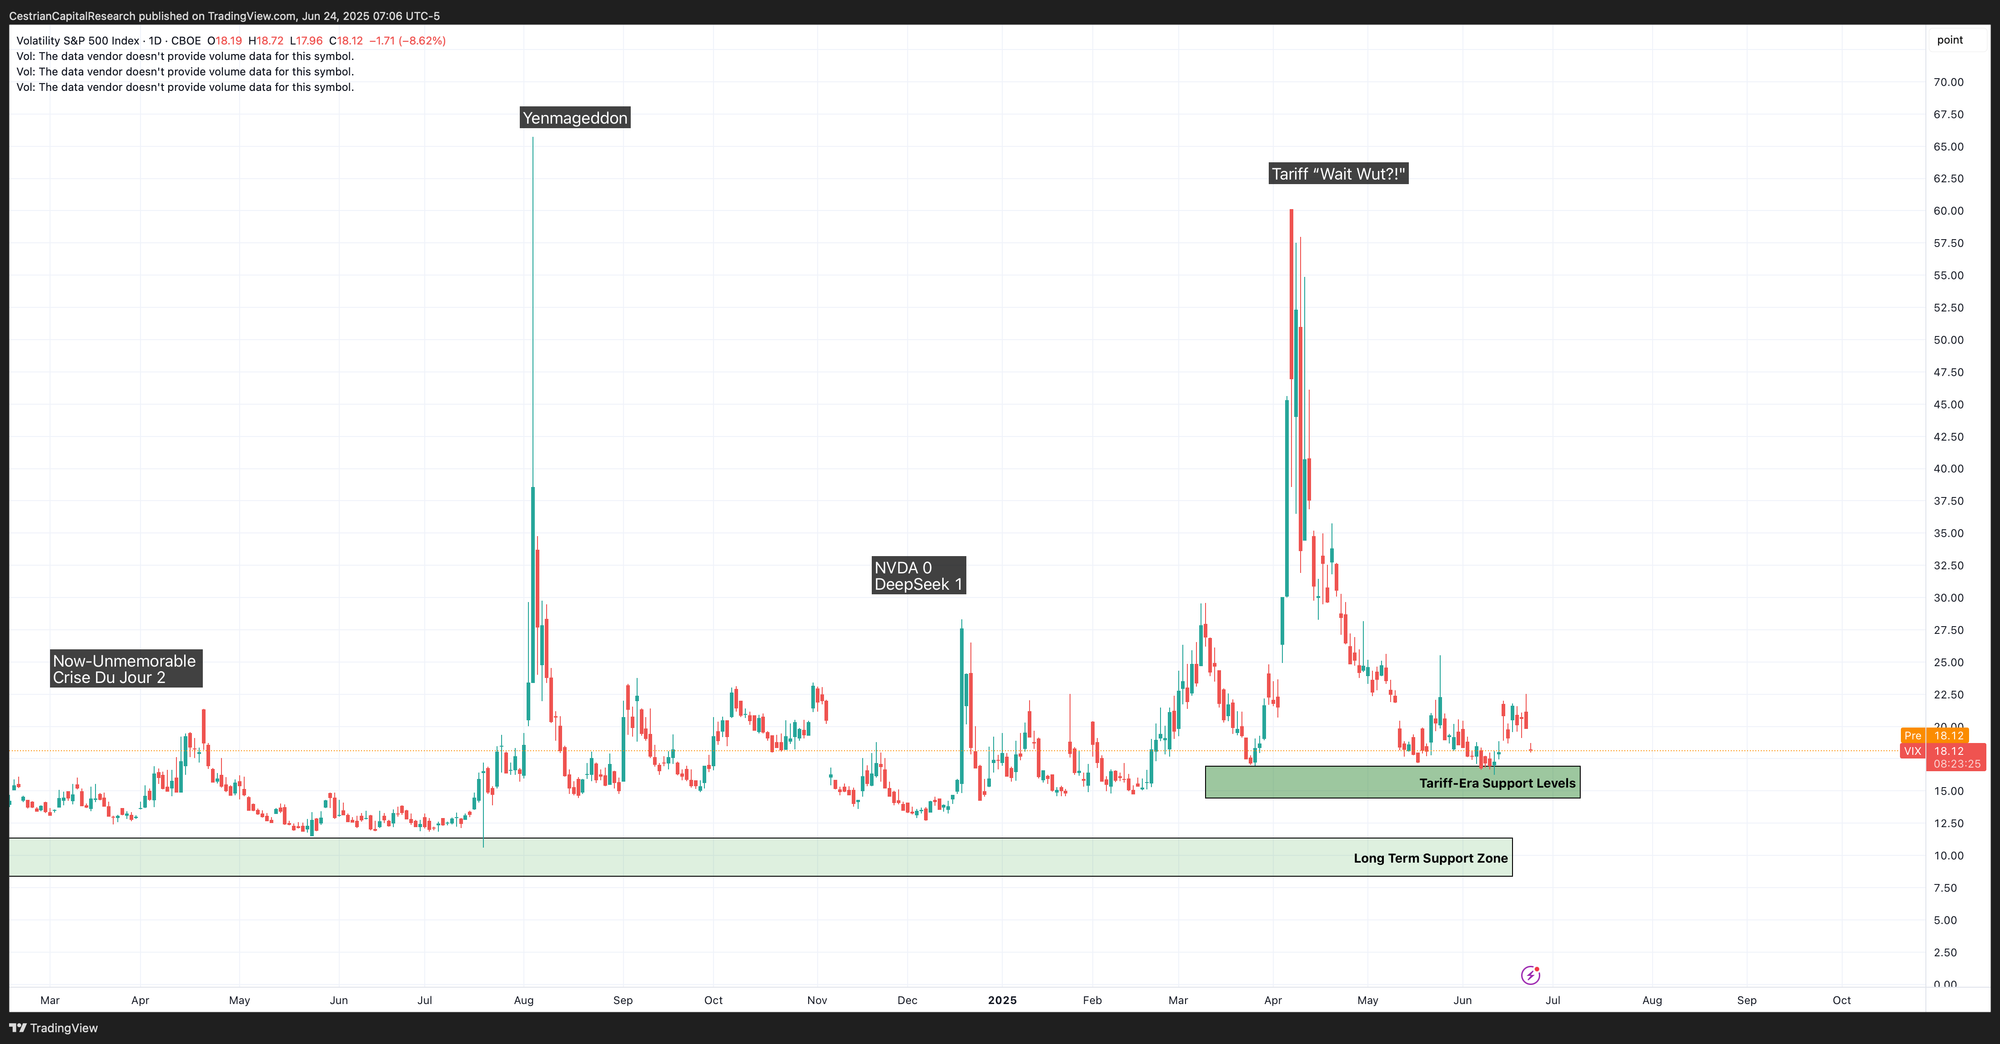
Disclosure: No position in any Vix-based securities.
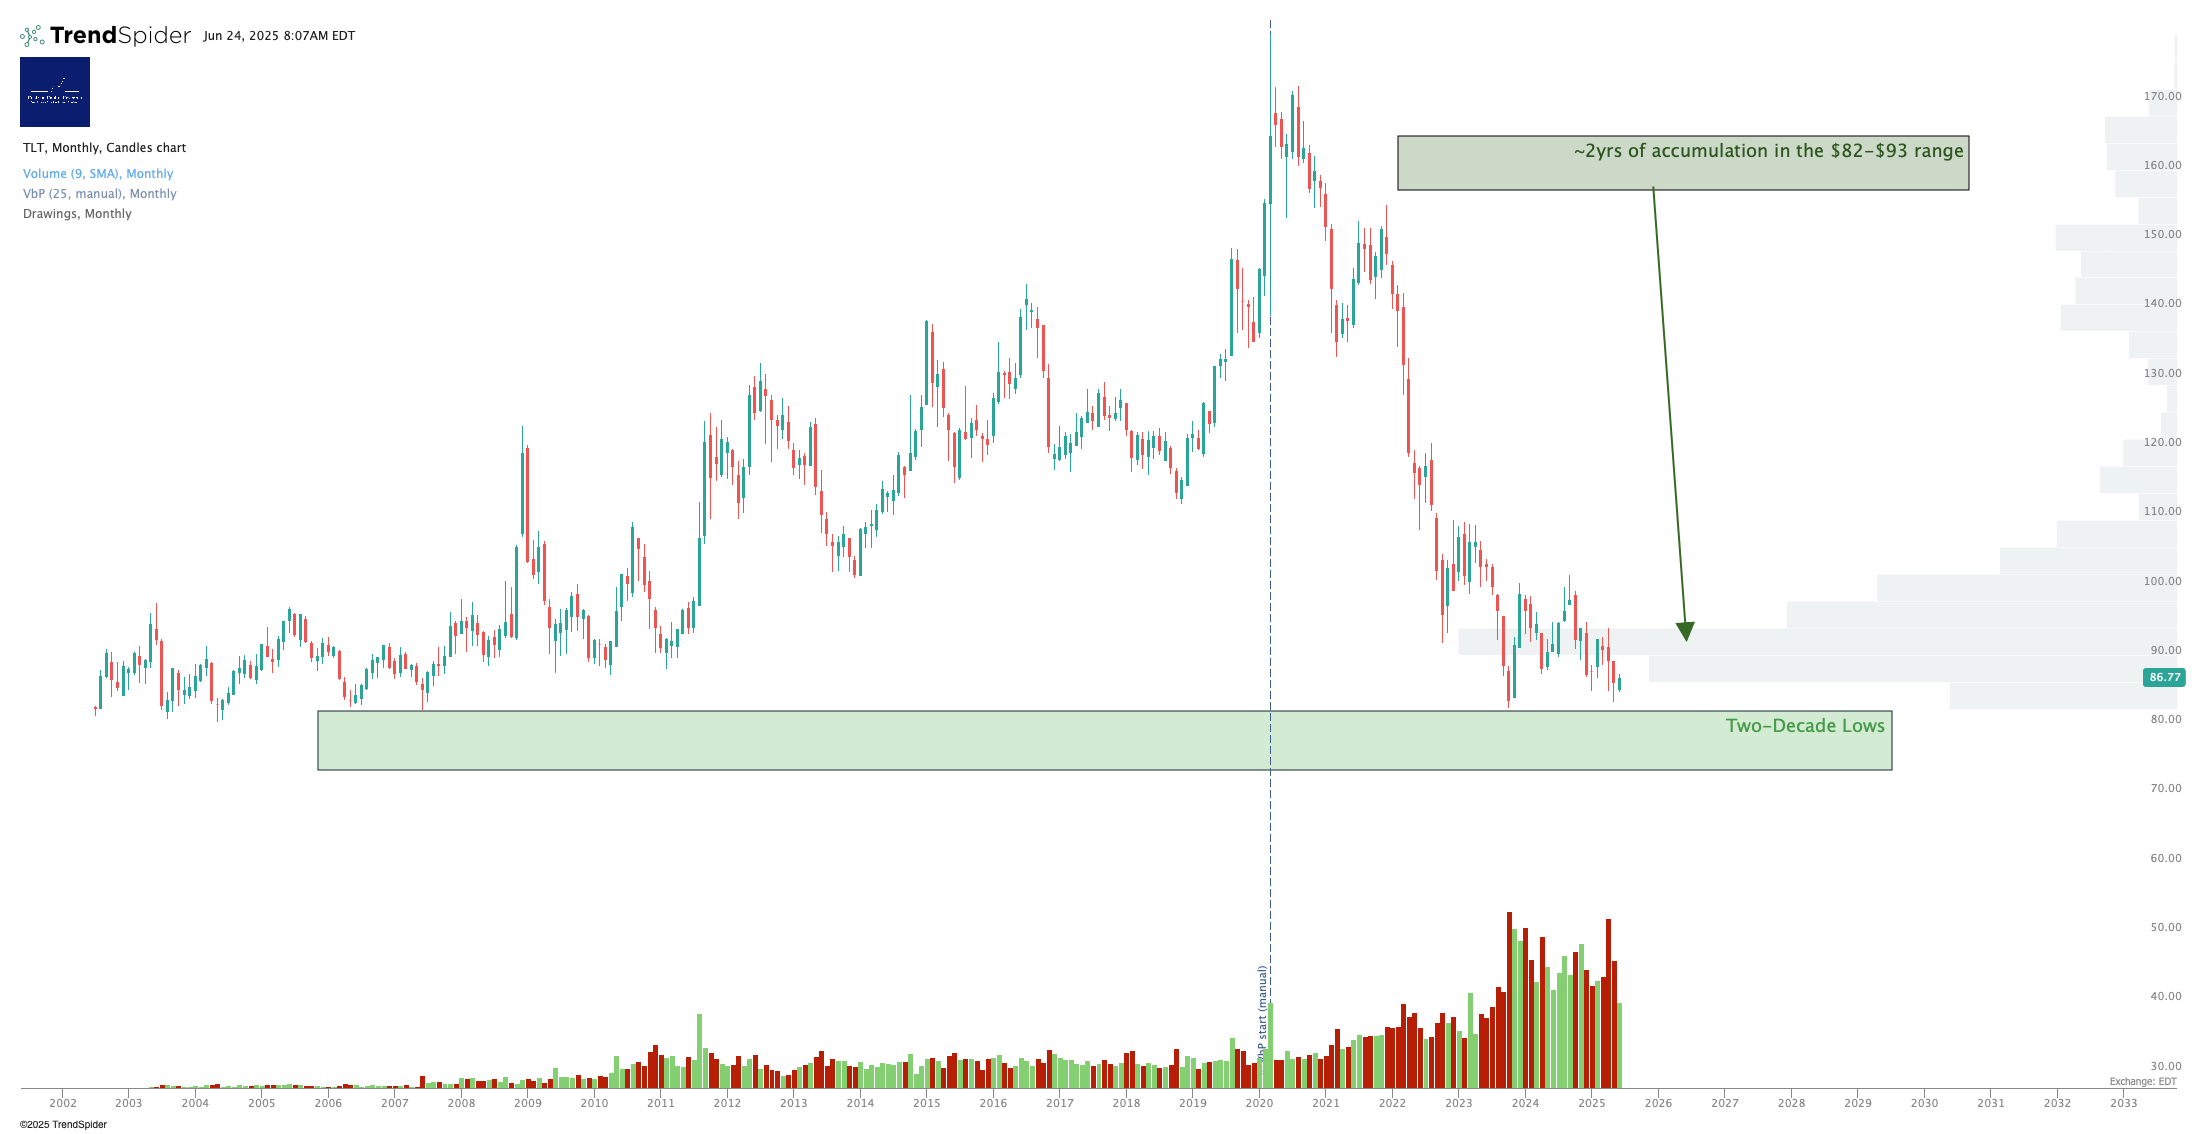
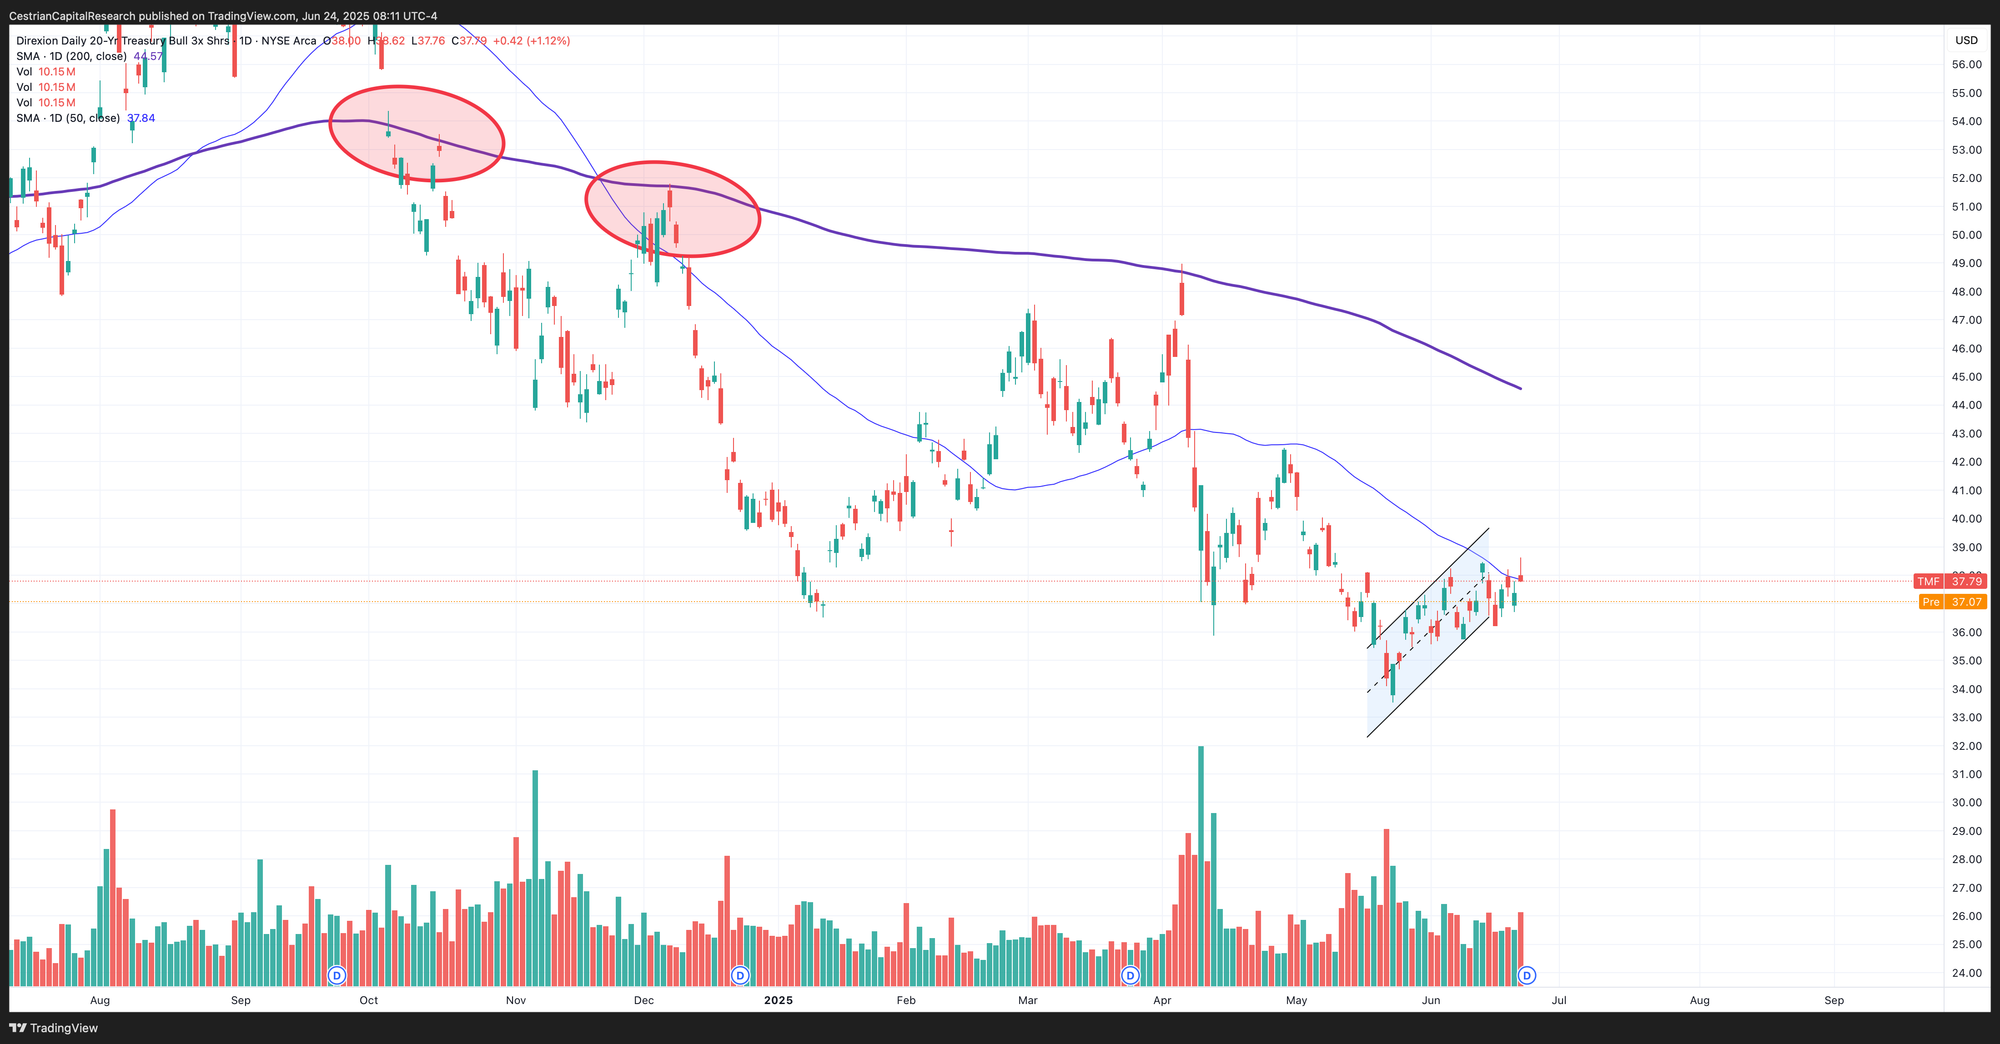
Longer-Term Treasury Bonds (TLT / TMF)
No change on this timeframe.
Yesterday saw the first daily close over the 50-day moving average since 7 April. That’s a bullish move.
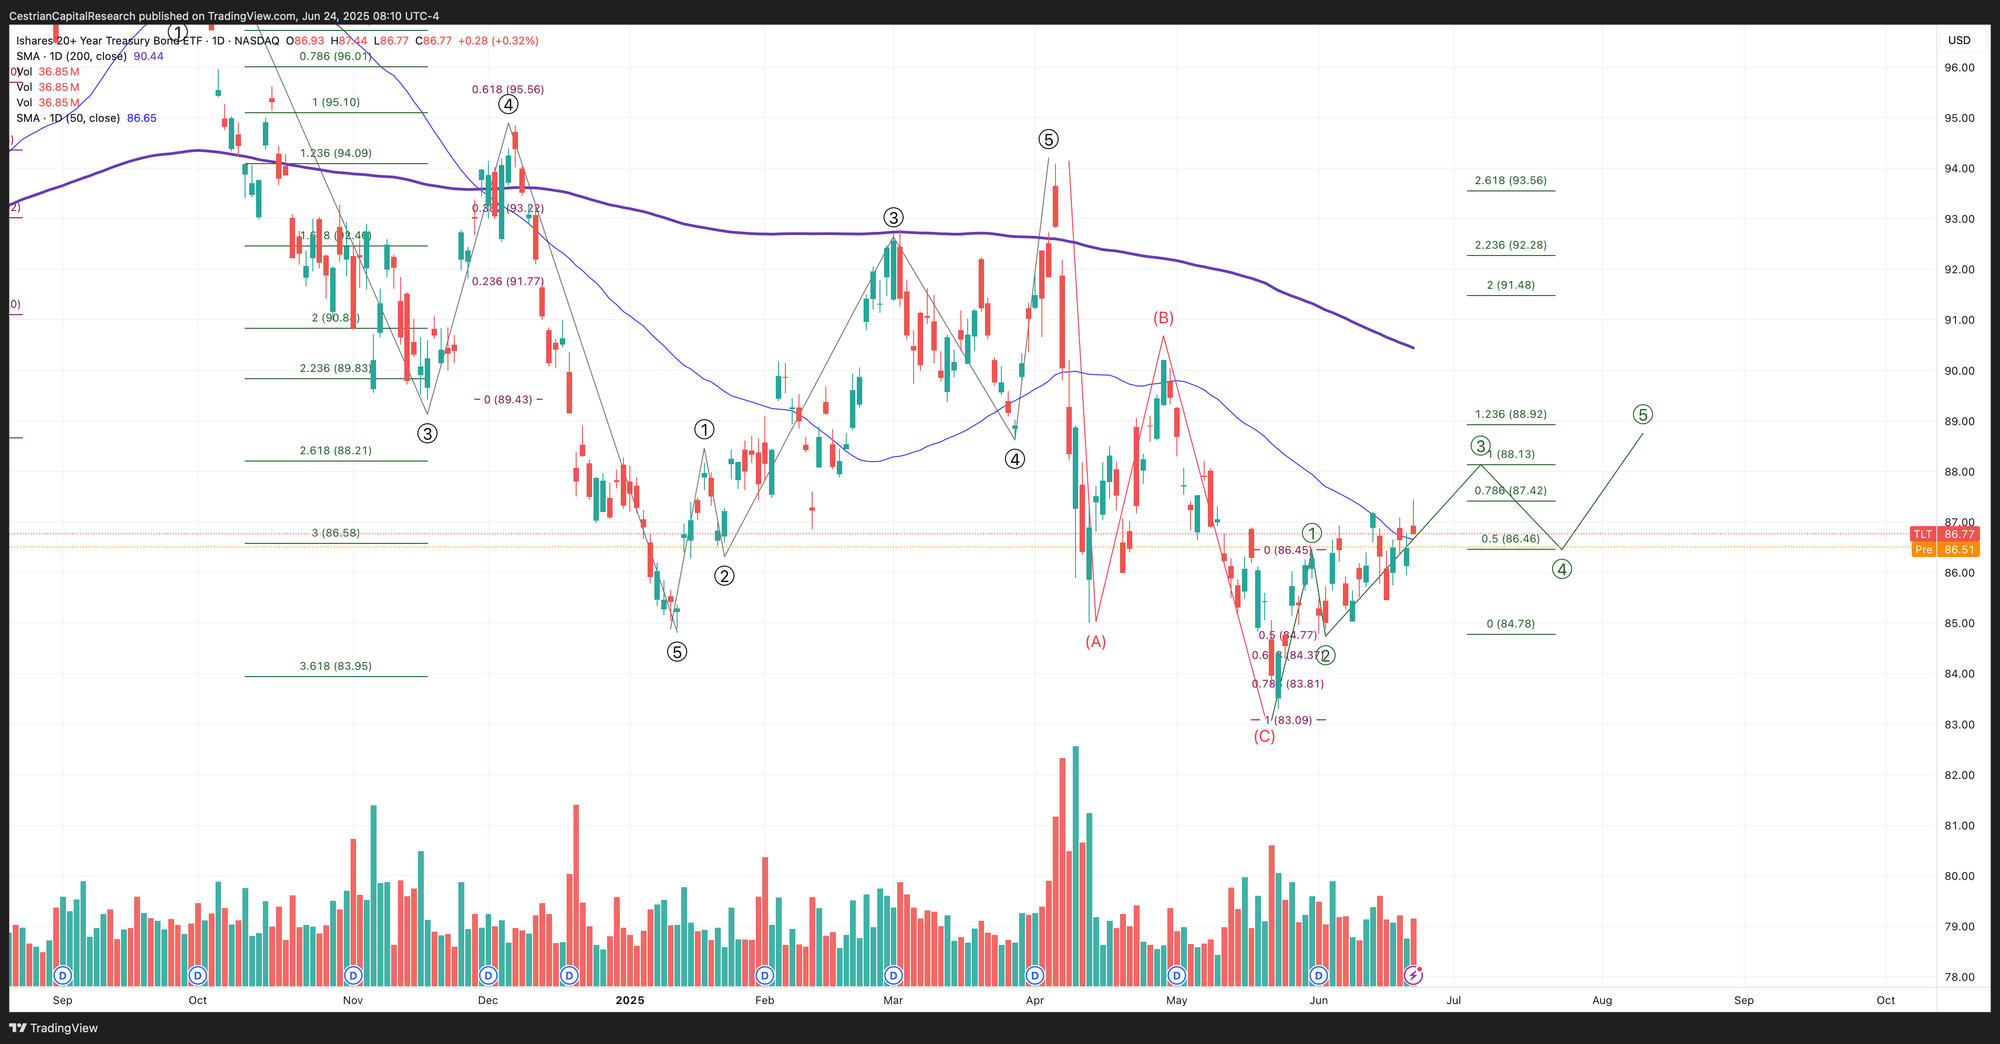
Note - Leveraged ETF. Read the fund documentation if you are considering using this instrument.
TLT’s tweaker cousin TMF closed a touch below its own 50-day moving average. Needs another push to get it up and over. The most recent daily close above the 50-day was on 4 April. For now, close, but still no roll-your-own.
Disclosure: I am unhedged long $TLT and similar EU UCITS ETFs.
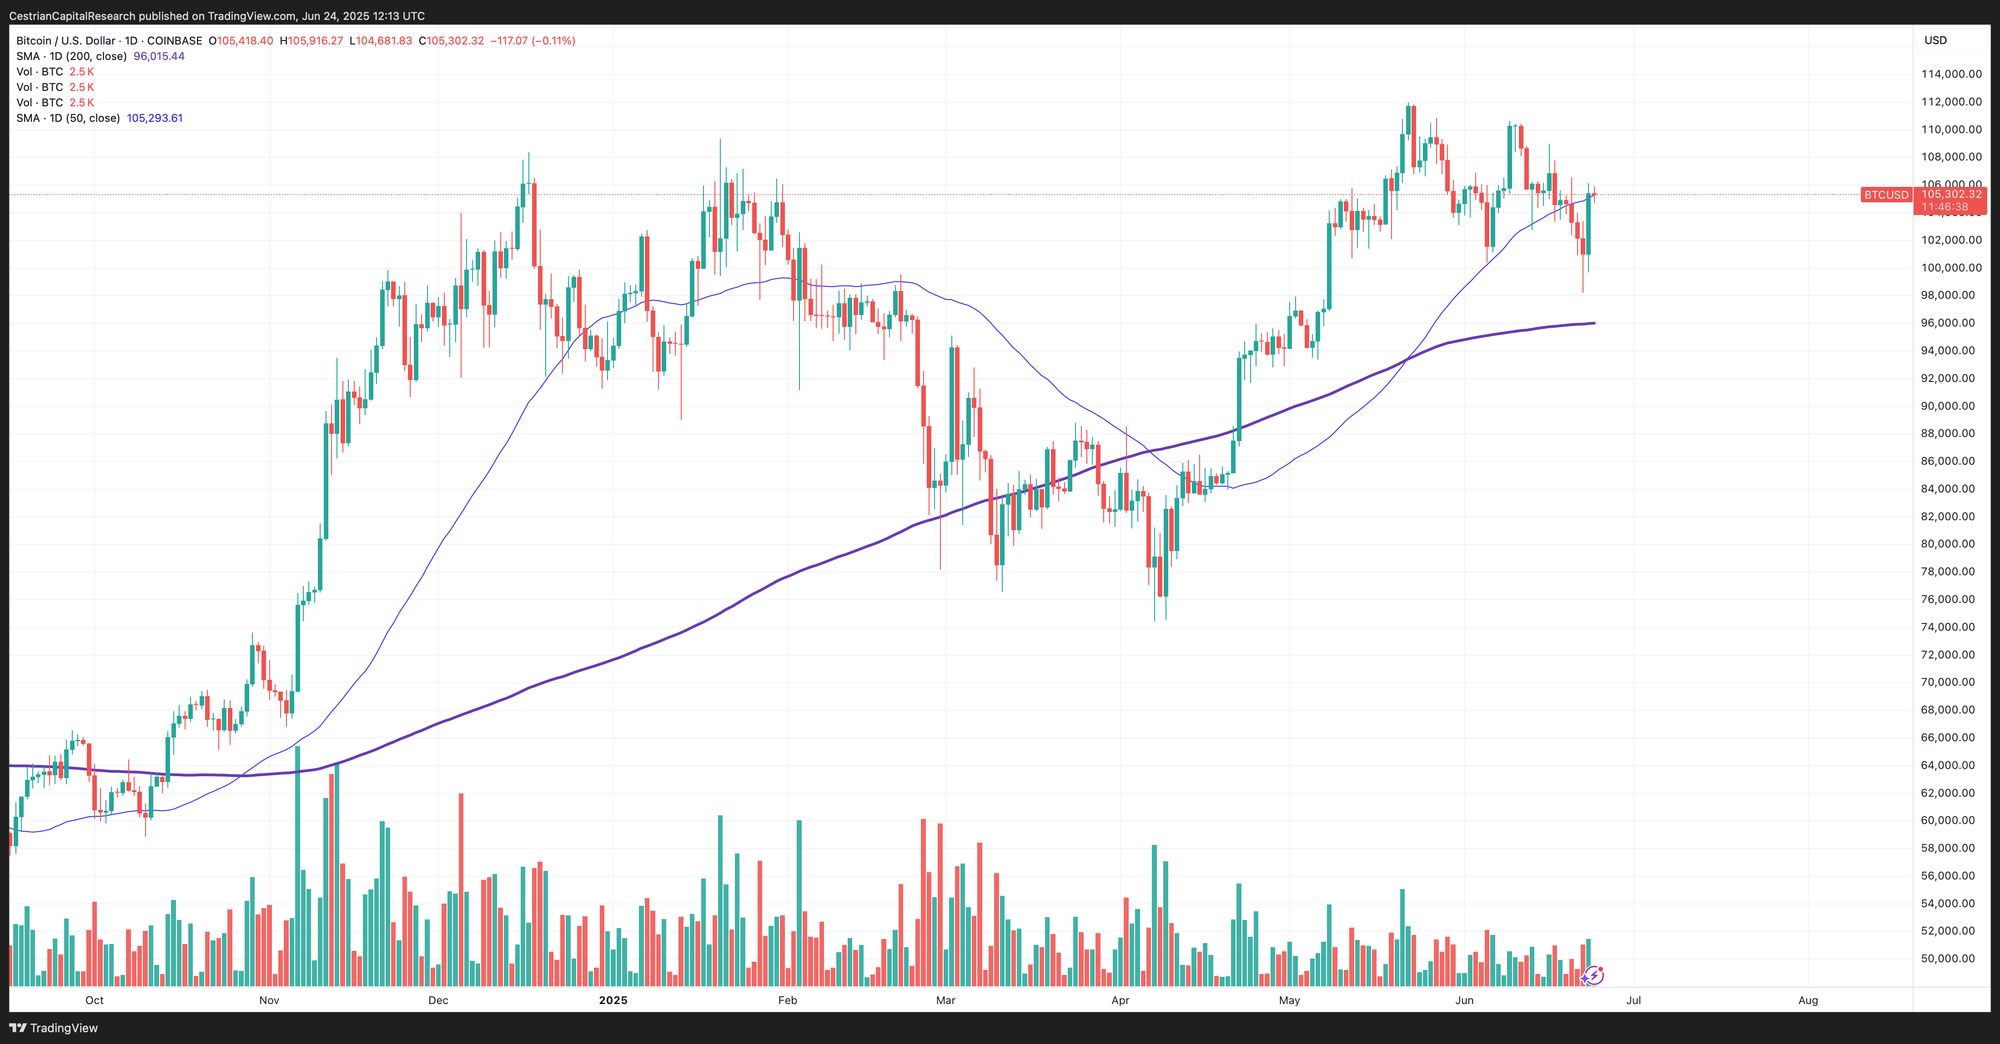
Bitcoin
Bitcoin, the most lucrative videogame in this Earthly kingdom, played a superb headfake down over the weekend to then moon this week. BTC is currently hovering over its 50-day; hasn’t turned it into strong support yet.
AI: Get Bitcoin trading signals, here (independent investors) or here (investment professionals).
Disclosure - No position in Bitcoin.
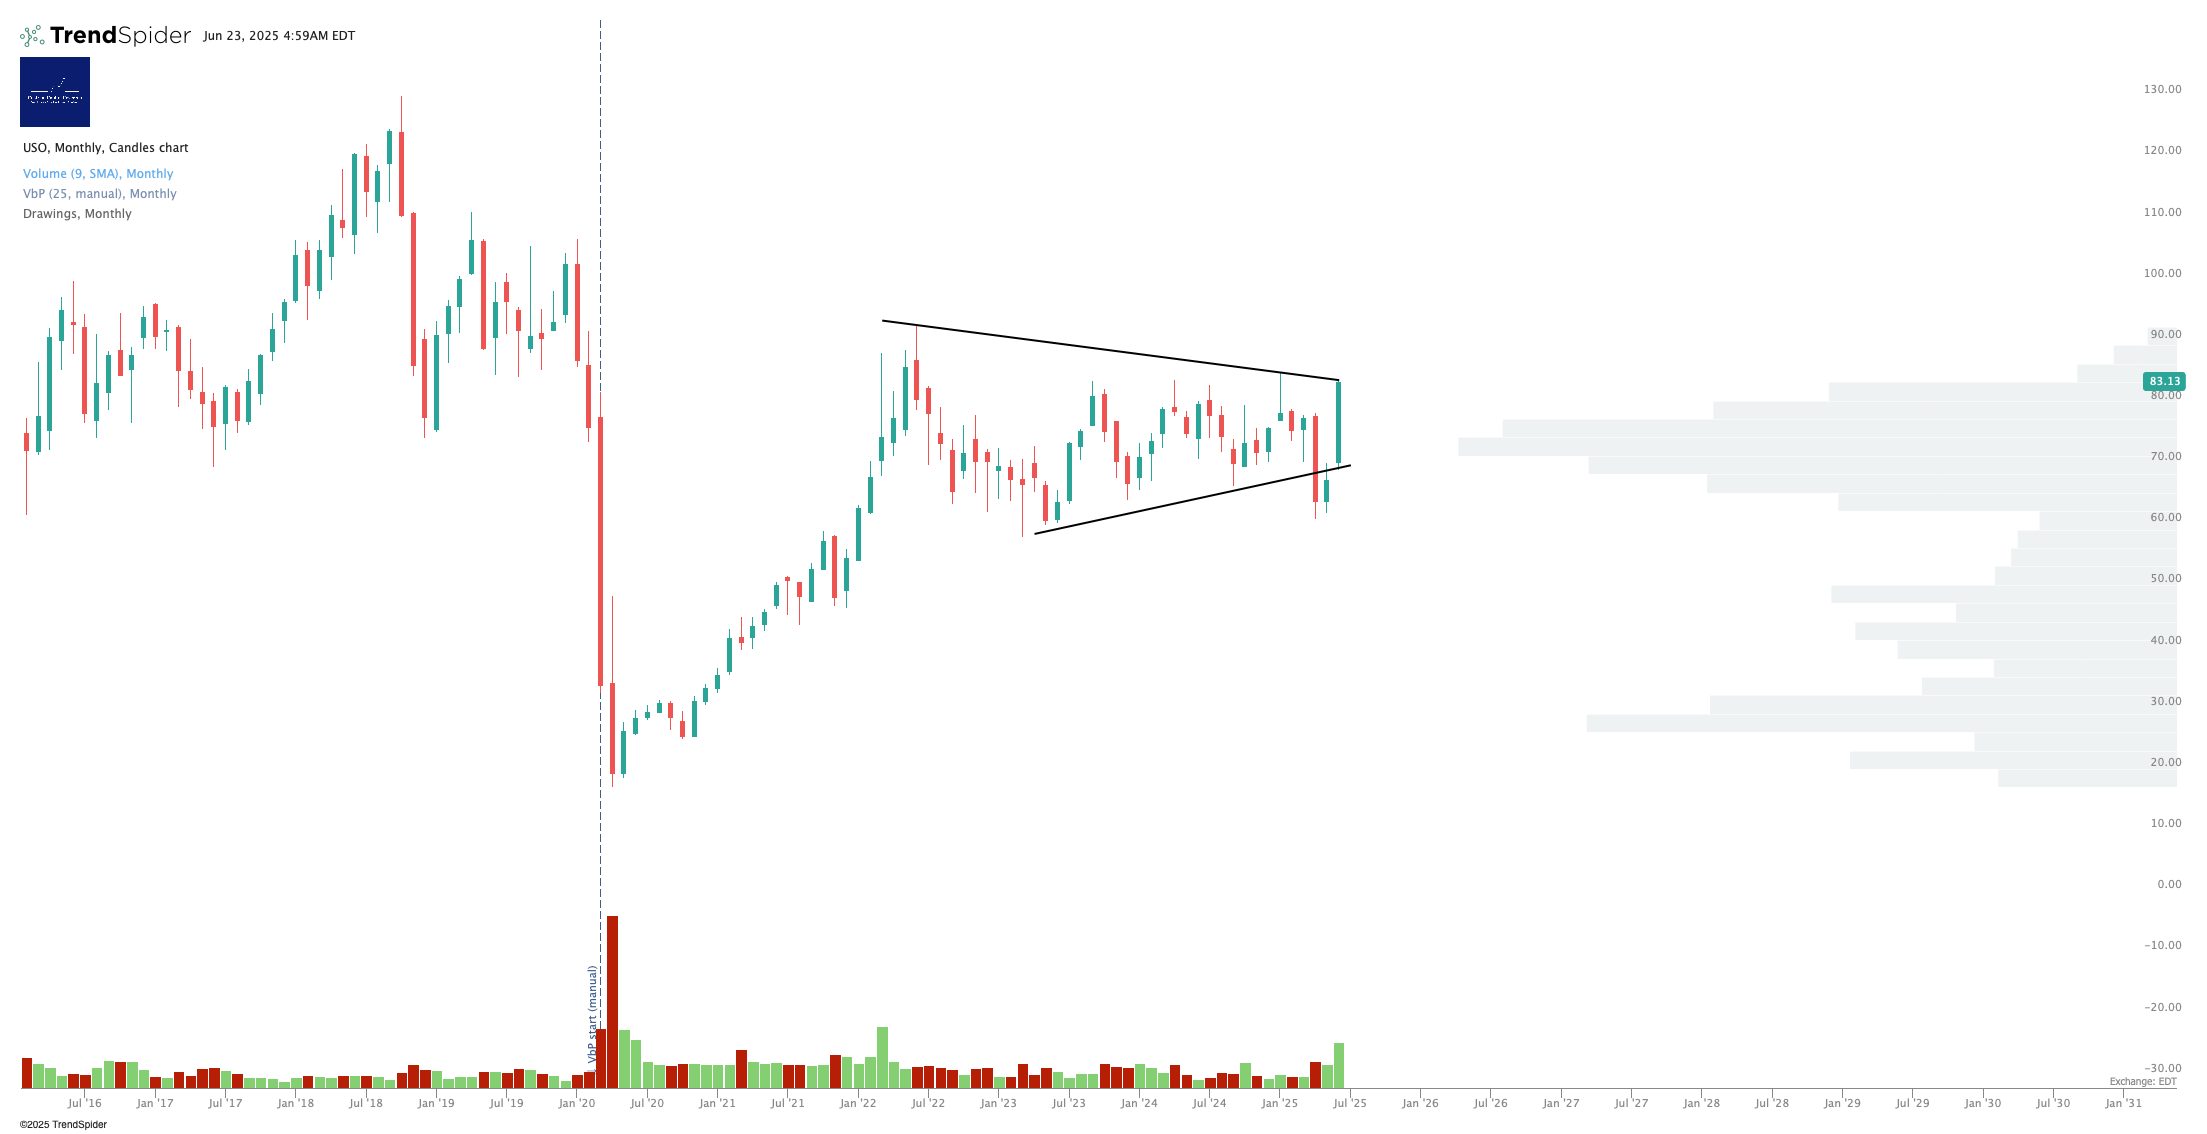
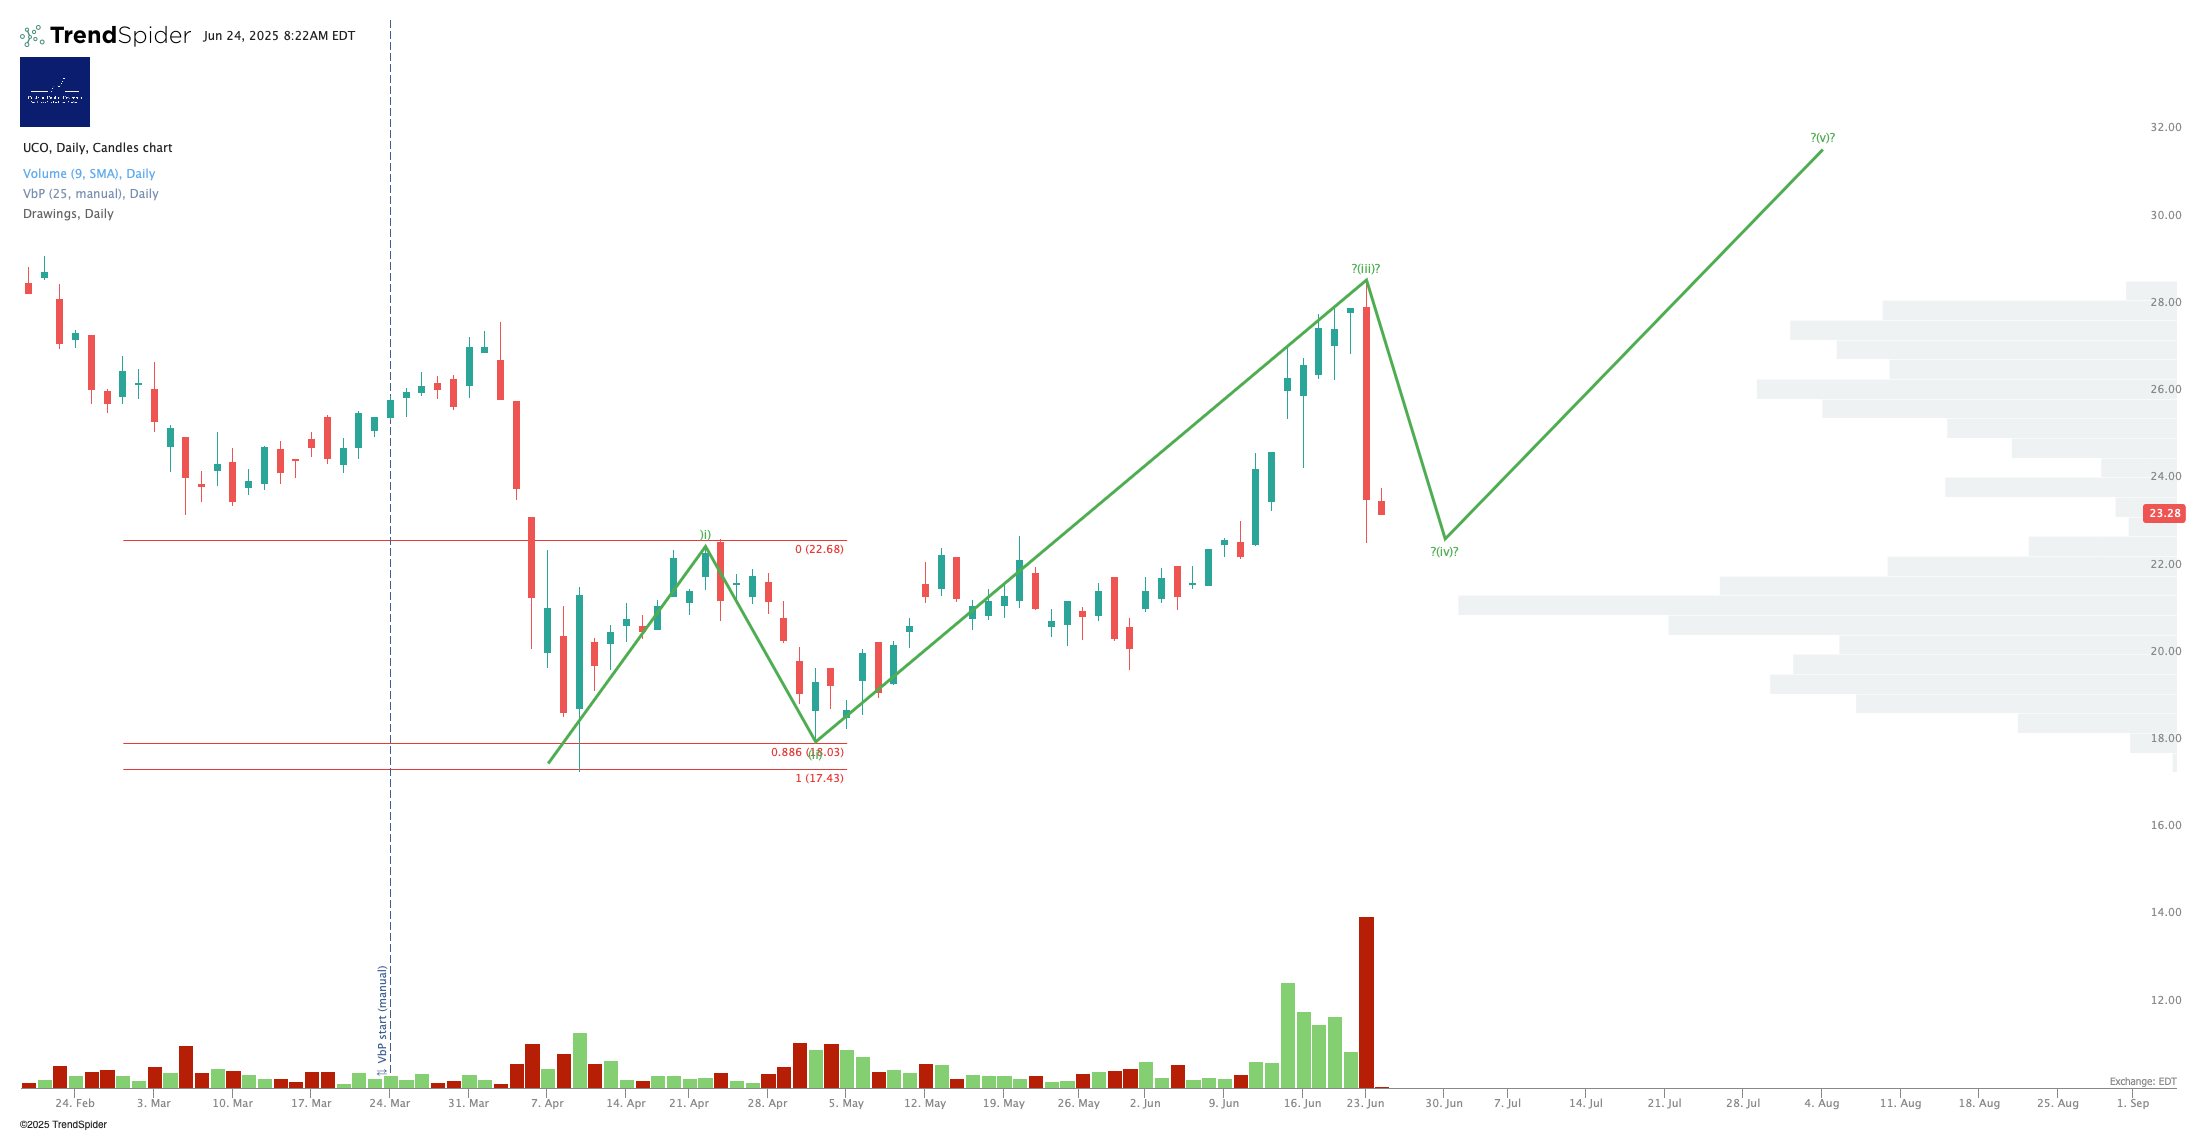
Oil (USO / WTI / UCO)
…. and this is why I hate wedge patterns! Yesterday USO was sat right beneath the upper boundary of this wedge; signalling either breakout or breakdown. It looks like breakdown, for now. The lower rising line has acted as resistance thus far so if there is to be a buying opportunity it may be around that level.
Sometimes a chart is so perfect you cannot believe it. Yesterday’s CL futures chart with a Wave 5 high proved spot on the money. CL is now selling off and will, I think, make a low soon; this will present a compelling long oil entry in my view, with clearly defined up- and downside risk parameters.
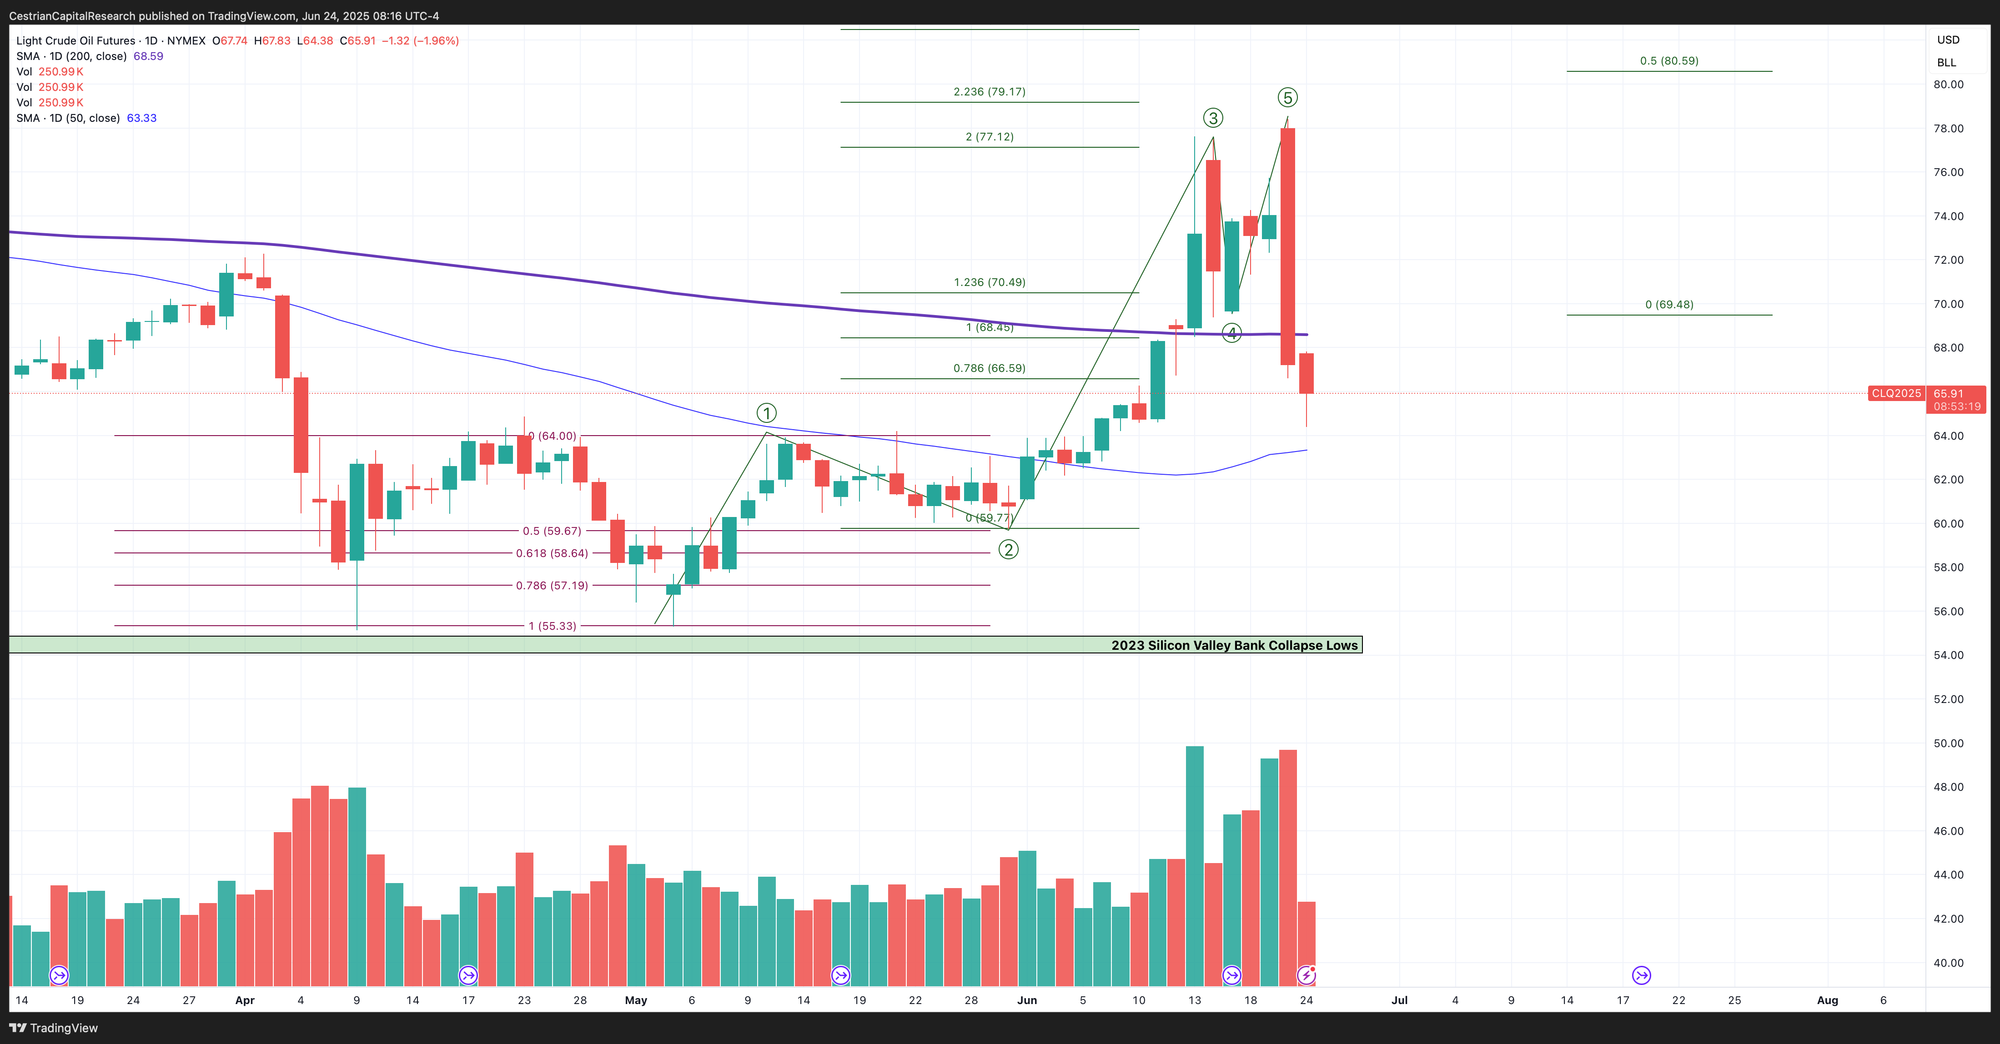
Note - Leveraged ETF. Read the fund documentation if you are considering using this instrument.
Tweakers are not to be trusted, since they are always hogging money for their own selfish uses; this is true of levered ETF charts too. But … UCO is saying another leg higher in oil is on the cards after this big sell. So let’s see if it is just trying to take a bag of money off of you for no reason, or whether it is for once leading the way over its less ambitious unlevered brethren.
Disclosure: No position in oil.
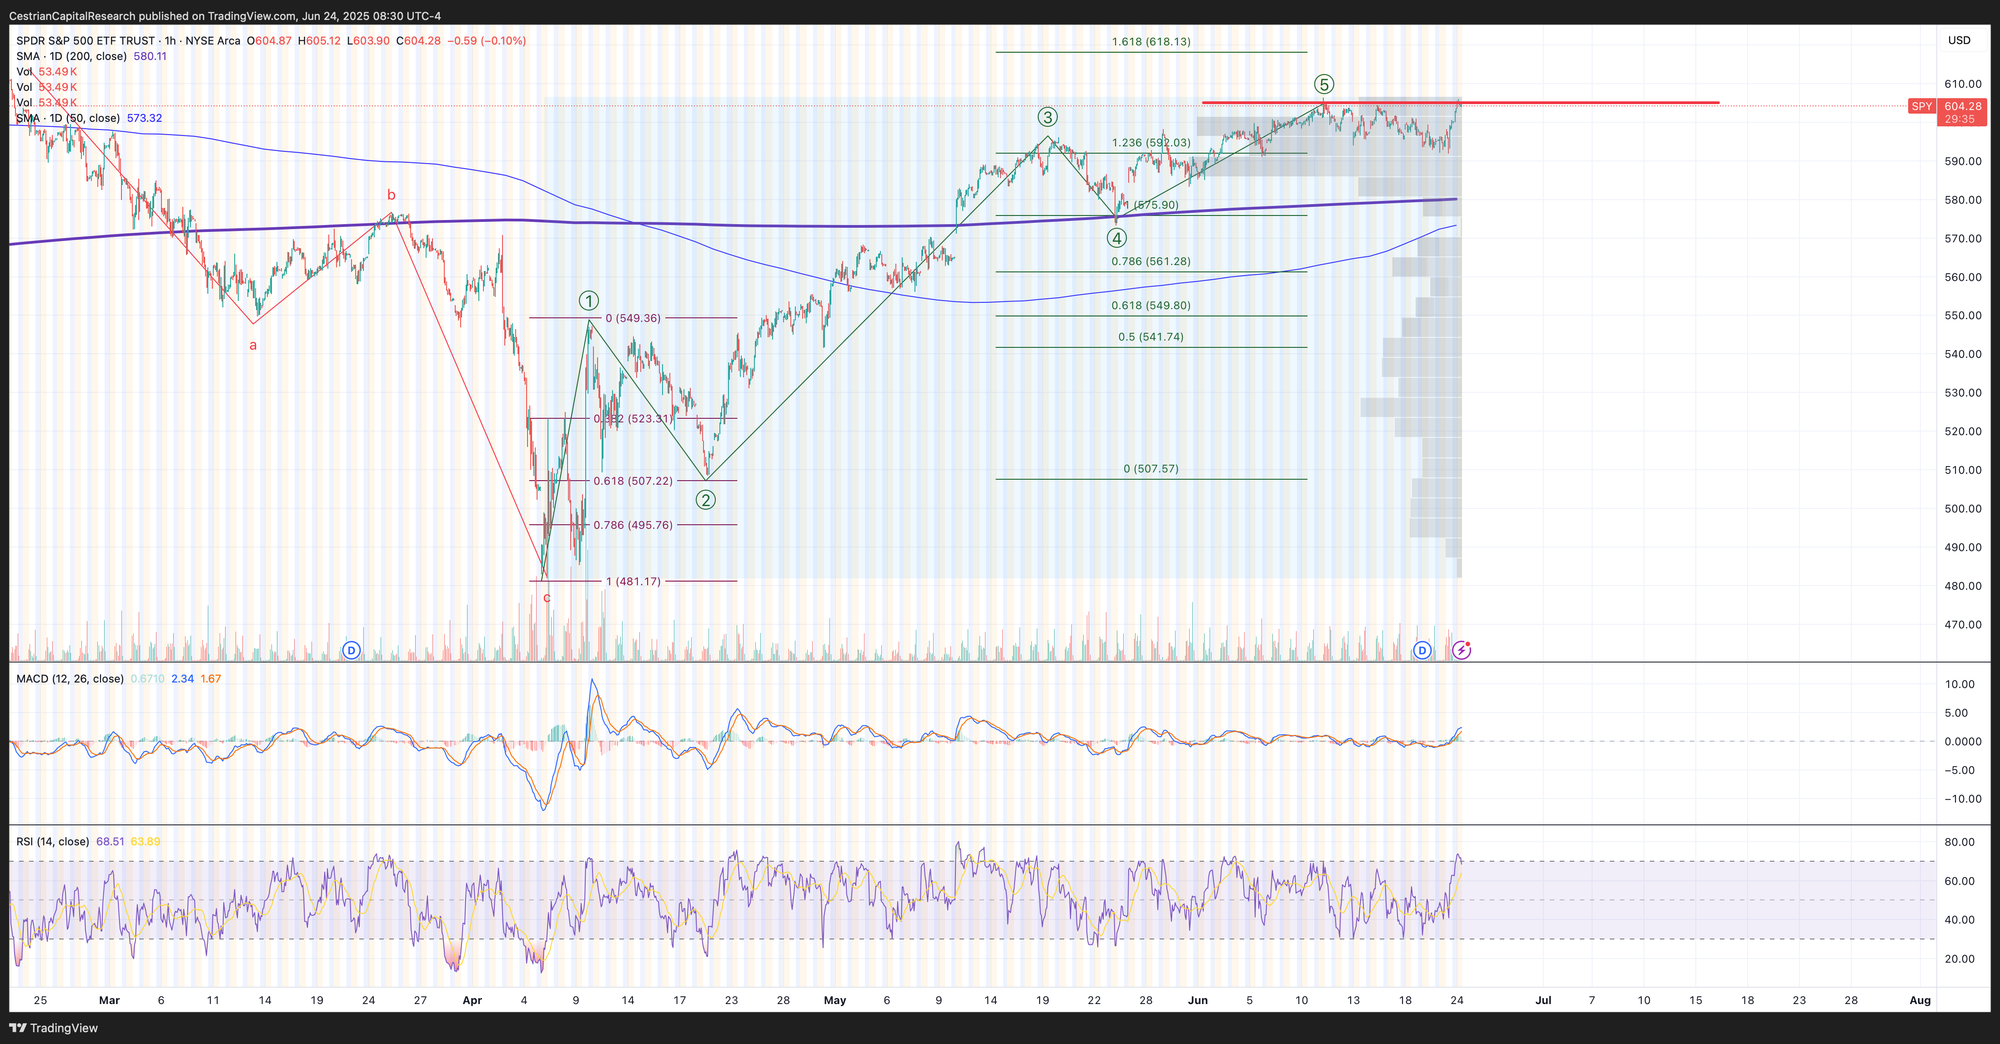
S&P500 / SPY / ES / UPRO
It’s all about that all-time-high sat just overhead. I think it will be beaten - but I think it will take some beating.
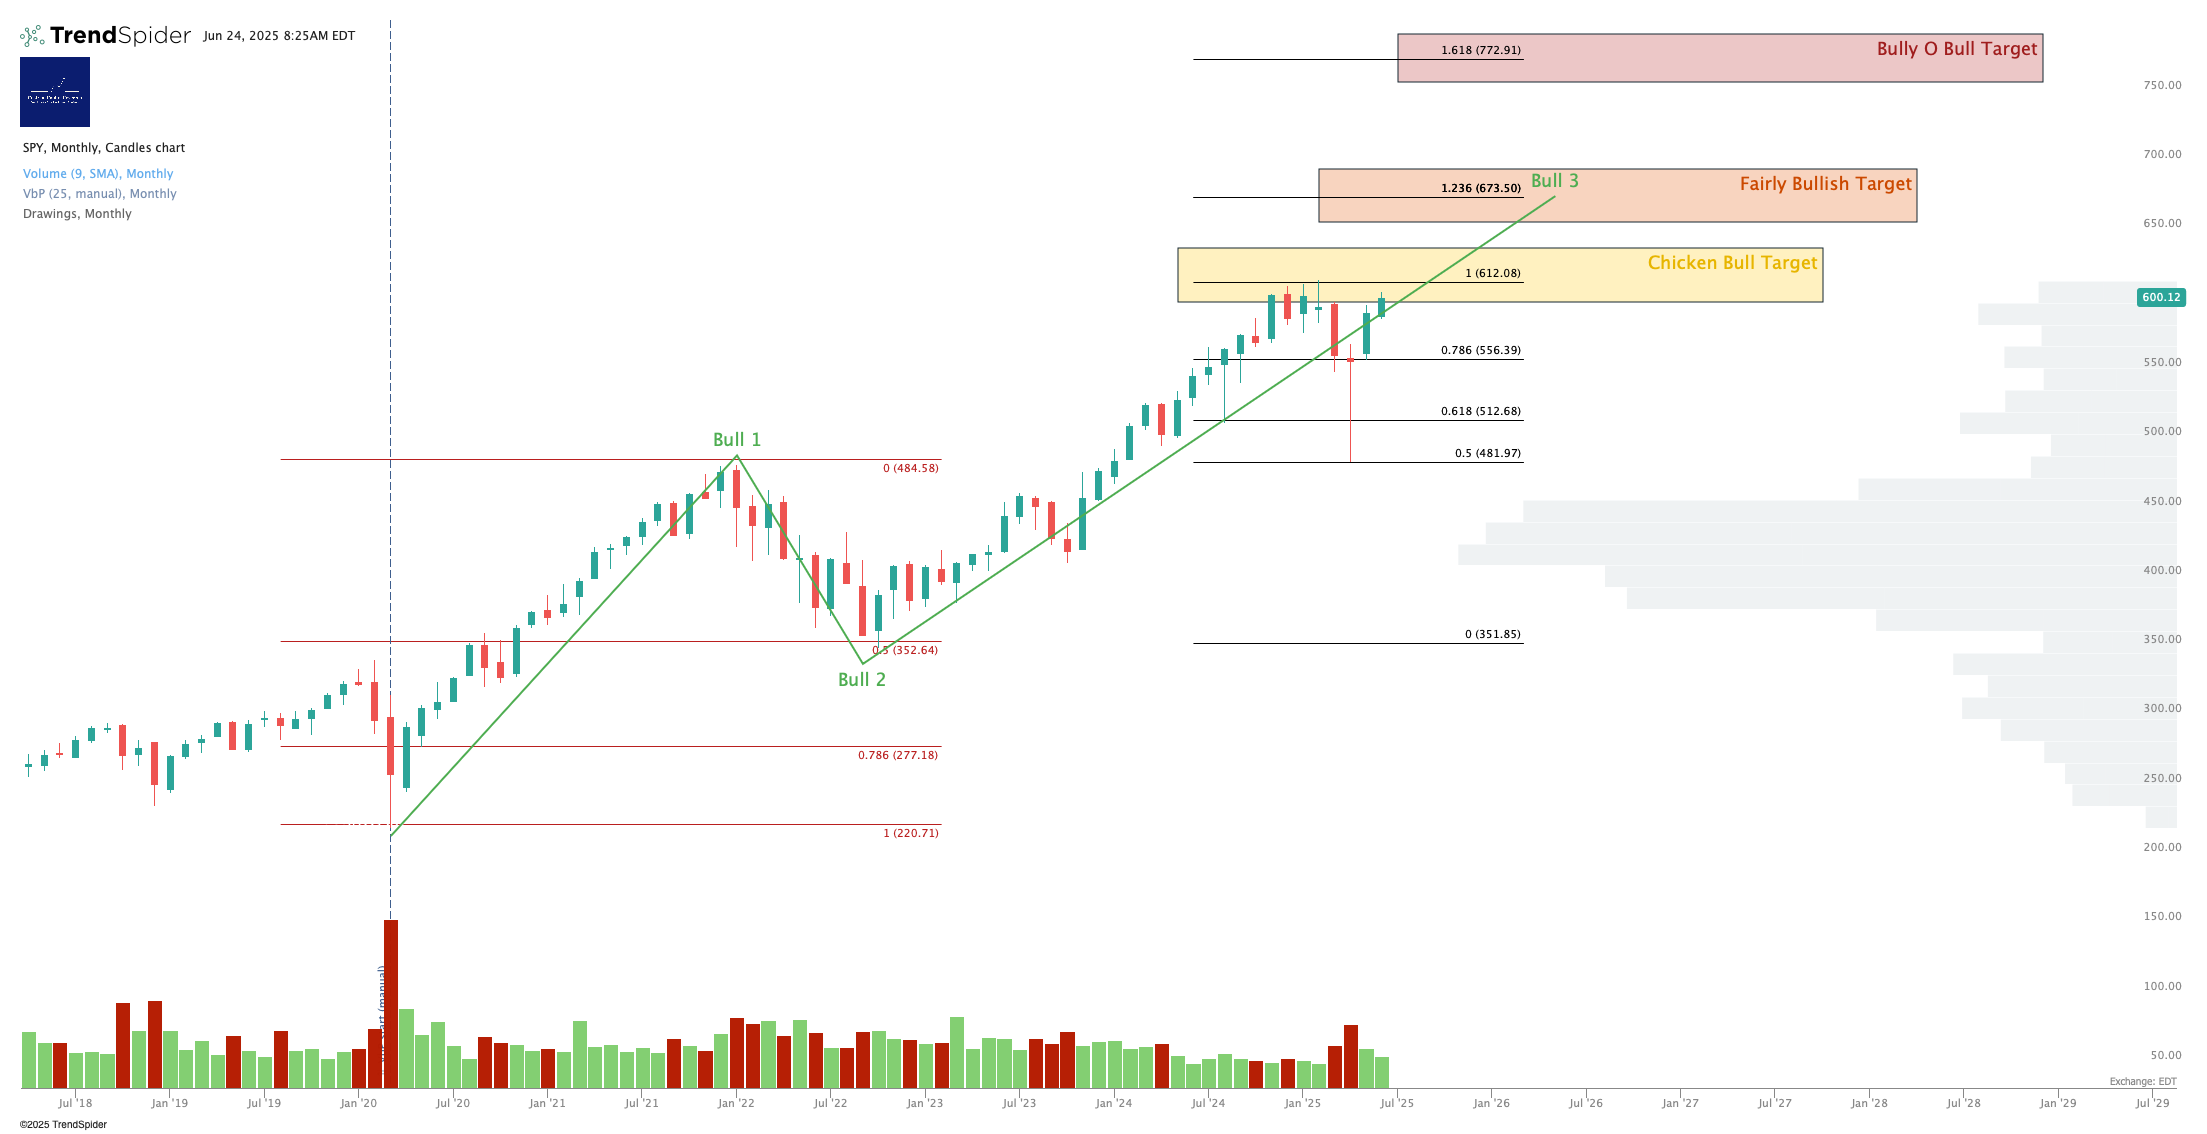
The downside arguments here I rehearsed yesterday - basically, a lot of volume up here at local highs plus (as of yesterday) declining price and momentum was signalling short-term weakness. Price then moved up; I think on balance still means some downside ahead but if wrong, we may see SPY hit $618 which curiously and reflexively is the 1.618 Wave 3 extension of the Wave 1 that started in the April lows placed at the Wave 2 low of that cycle.
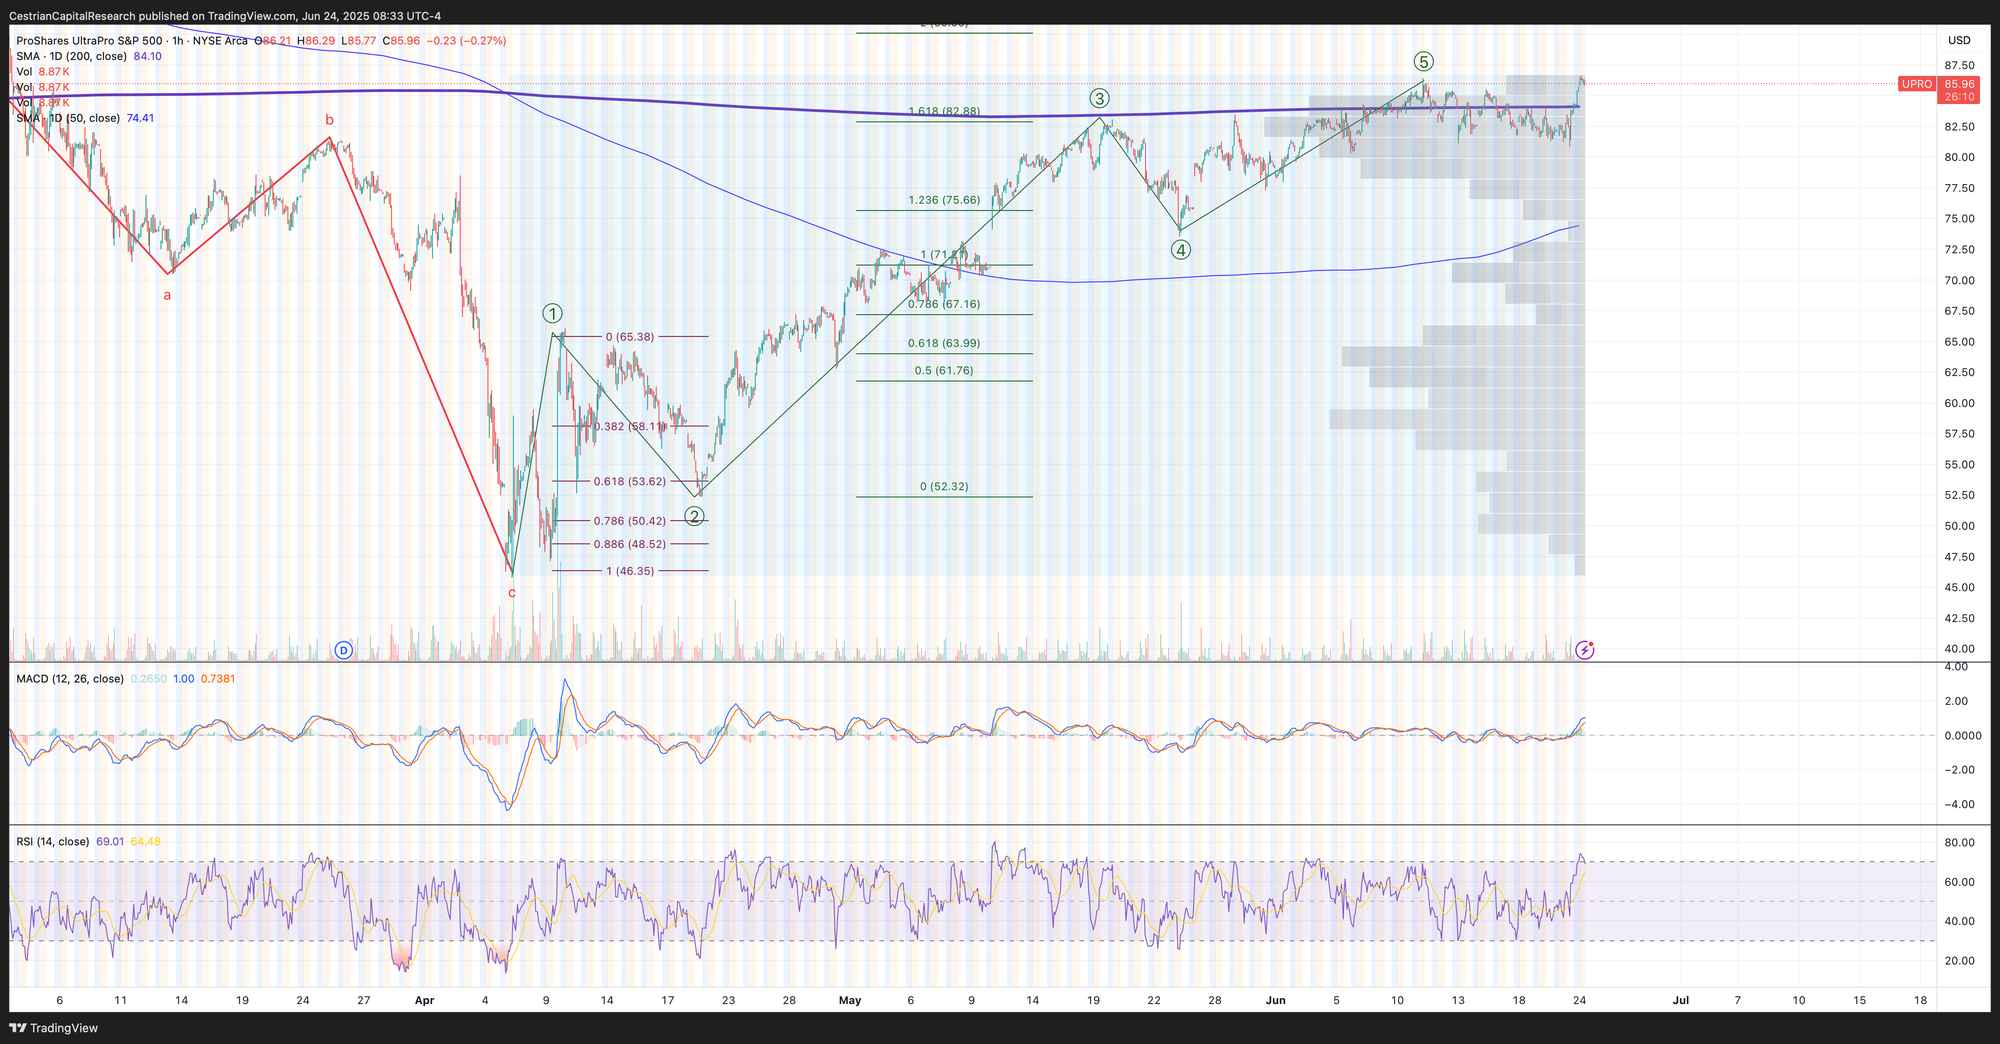
Note - Leveraged ETF. Read the fund documentation if you are considering using this instrument.
Will follow SPY.
Disclosure: I am unhedged long $IUSA (EU UCITS S&P500 ETF)
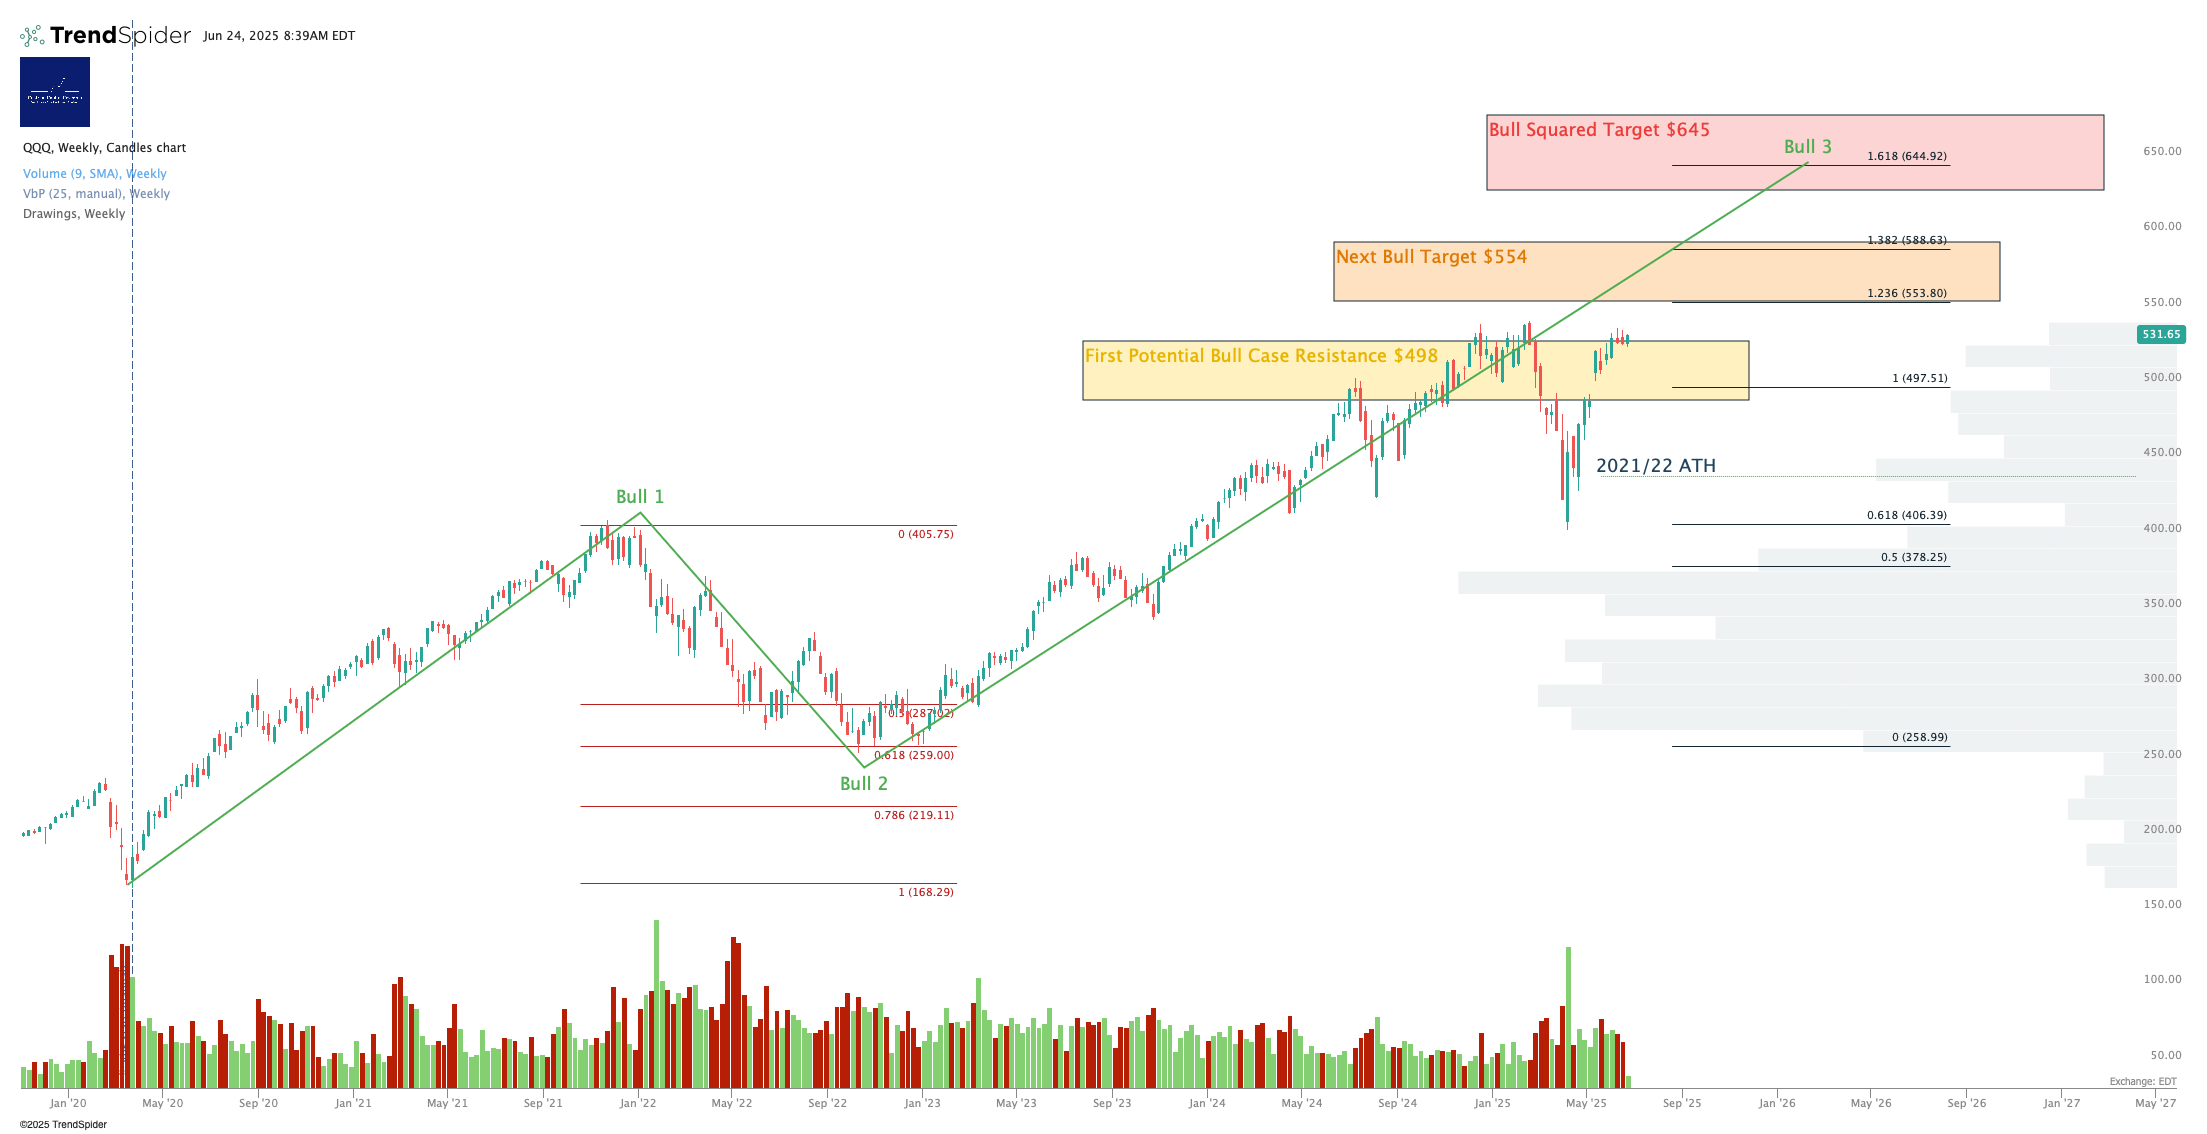
Nasdaq-100 / QQQ / NQ / TQQQ
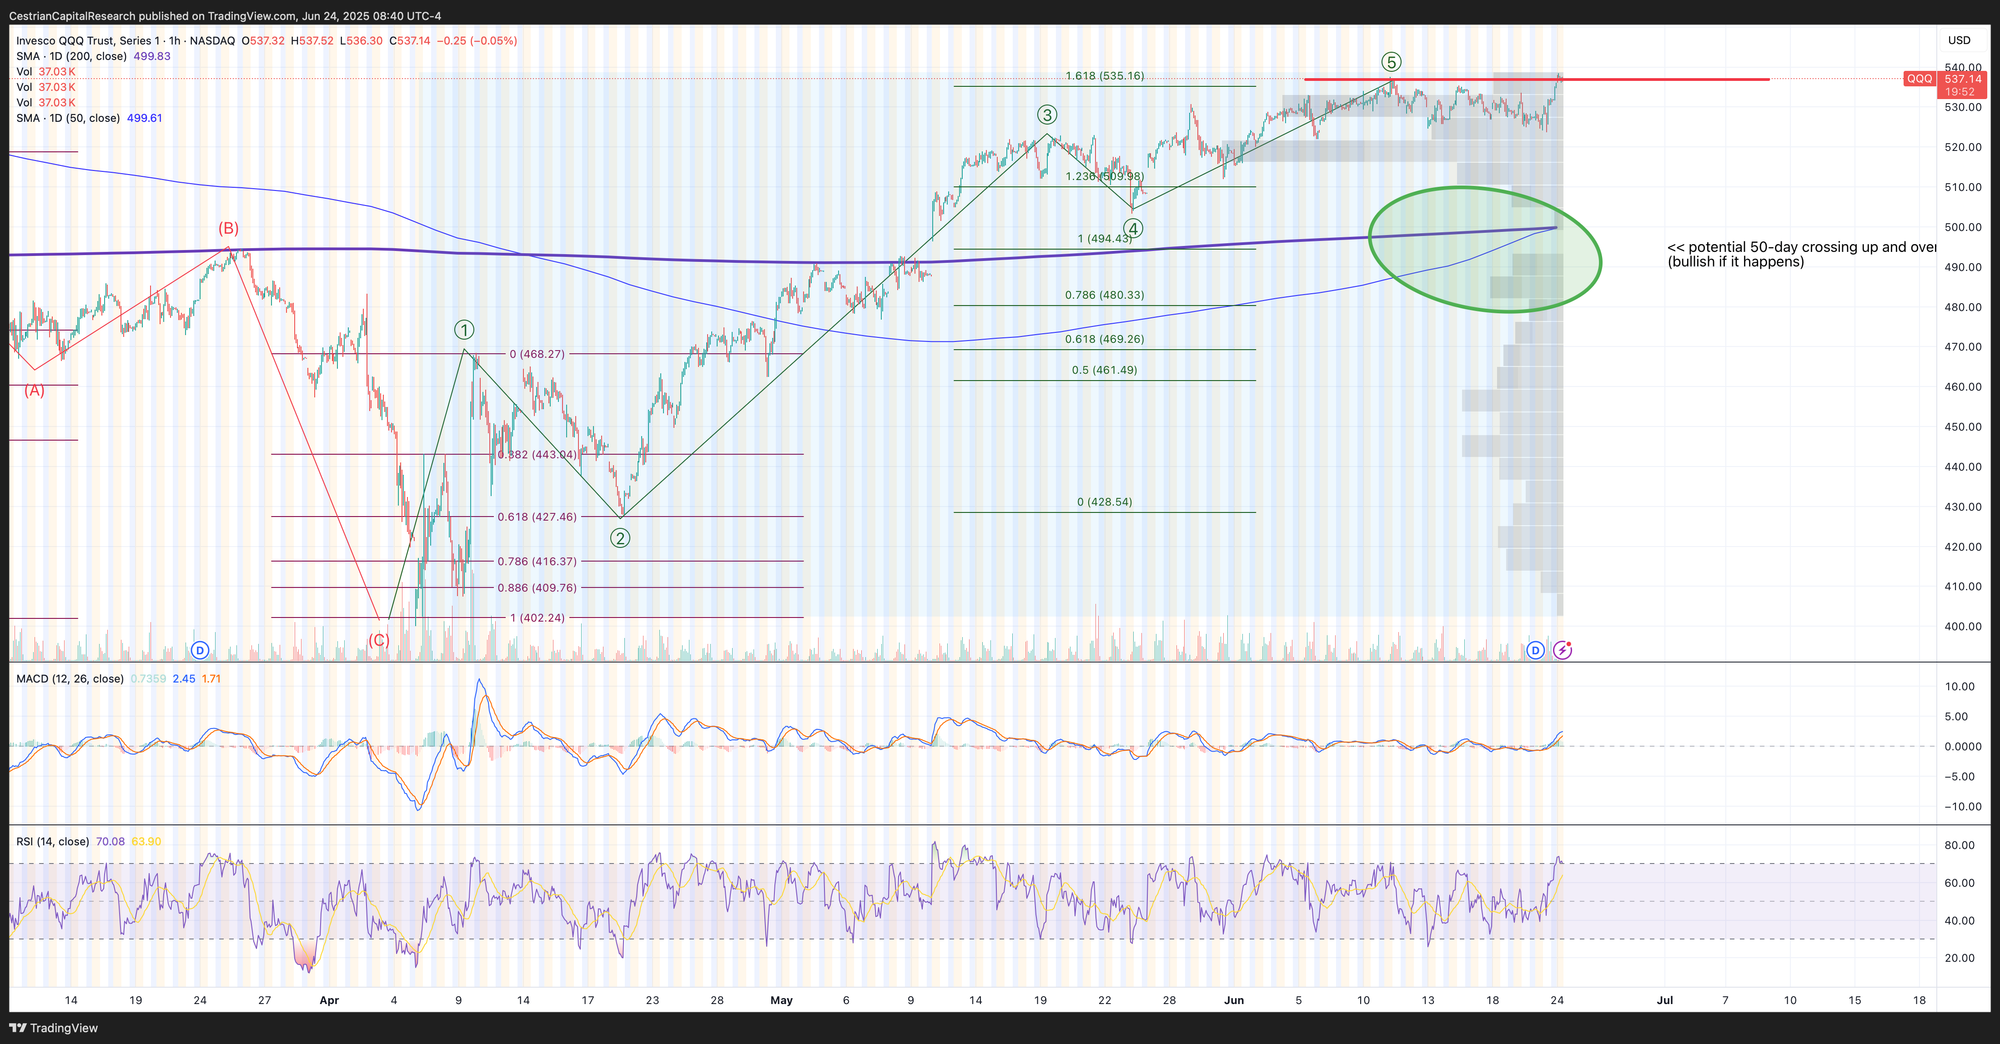
No change to my view here; probably resistance initially at the all-time-high level of around $540, a moderate correction, then a new and successful assault on making new highs.
One more green day today should deliver that golden cross of the 50-day moving up and over the 200-day. A rejection here is meaningful.
Note - Leveraged ETF. Read the fund documentation if you are considering using this instrument.
Still holding over its 200-day; hard to be bearish until it falls below it.
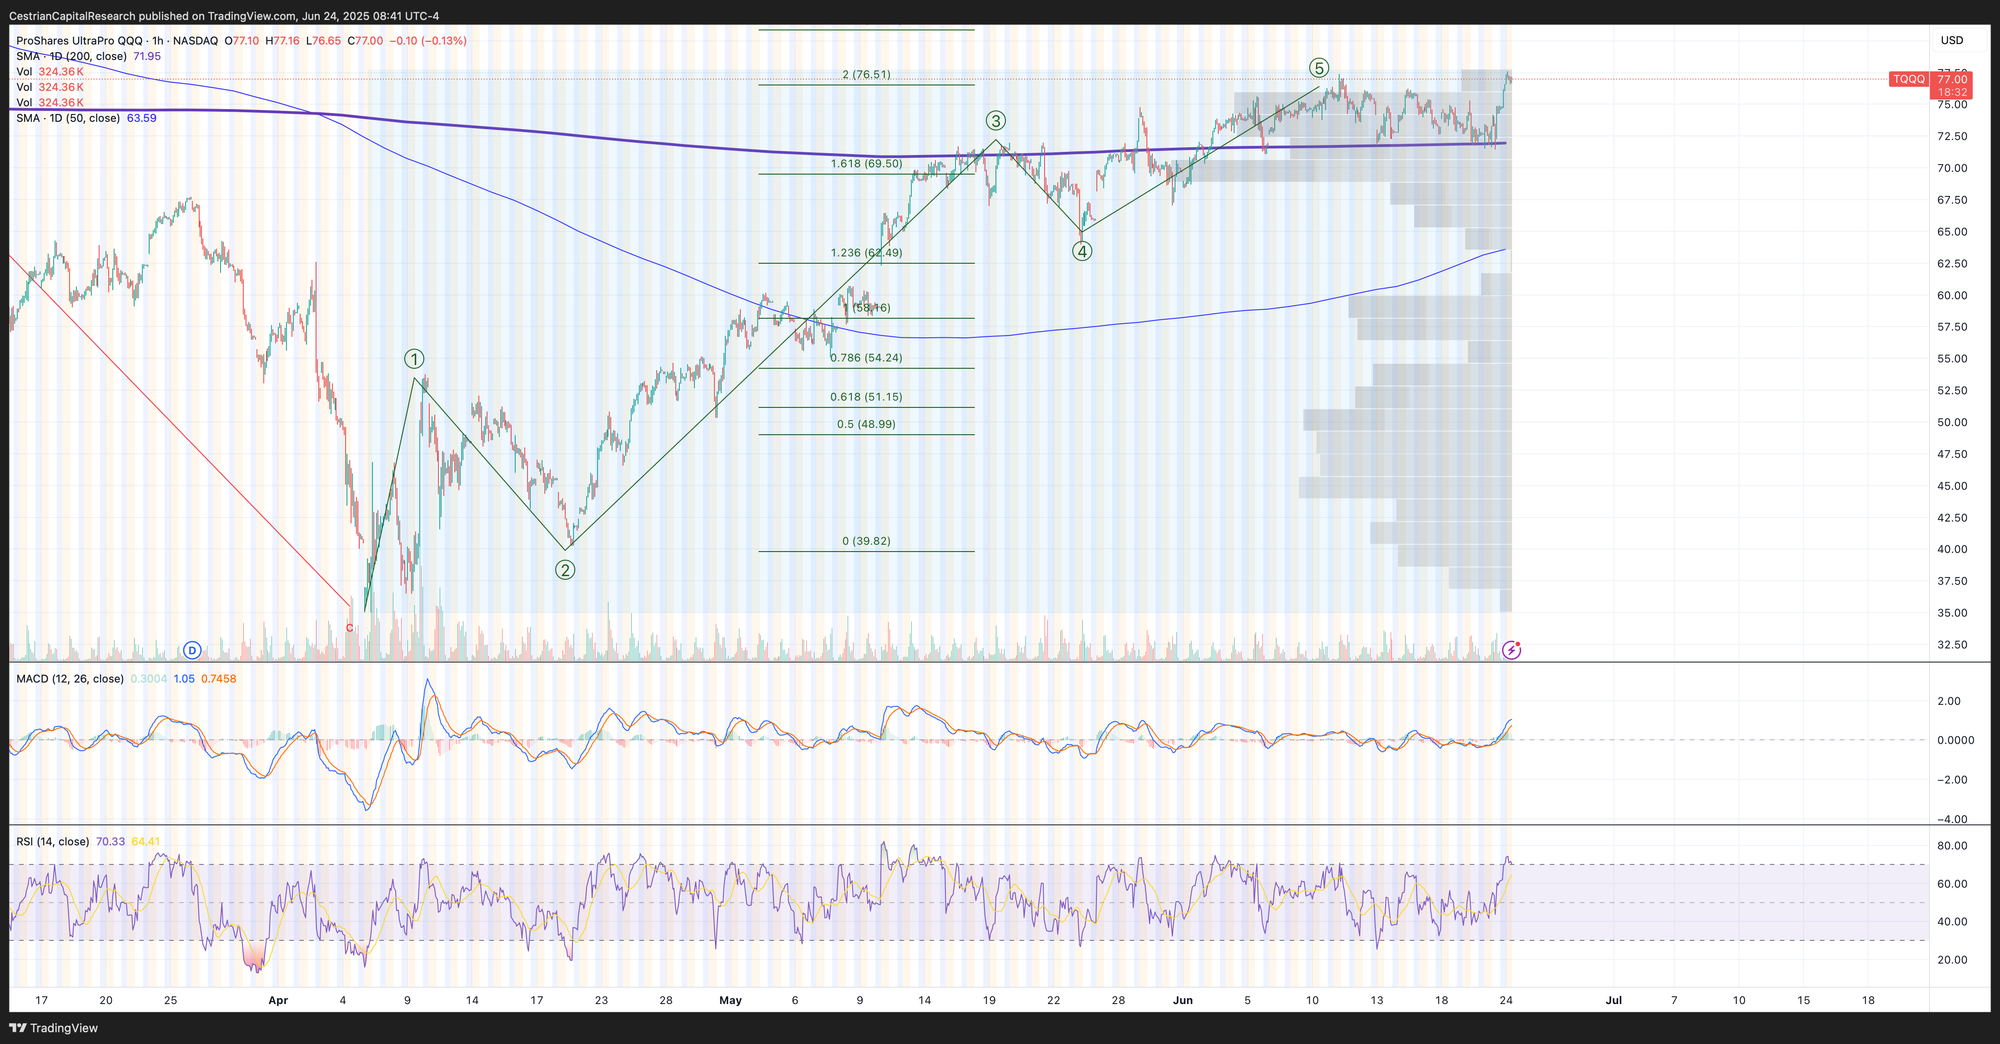
Disclosure: I am hedged 1:1 $TQQQ:$SQQQ
Alex King, Cestrian Capital Research, Inc - 24 June 2025.
DISCLOSURE - Cestrian Capital Research, Inc staff personal accounts hold long positions in, inter alia, TQQQ, SQQQ, IUSA, XLK, SOXL, SOXS, SMH, TLT, DTLA.