
Market On Open, Tuesday 1 July

DISCLAIMER: This note is intended for US recipients only and, in particular, is not directed at, nor intended to be relied upon by any UK recipients. Any information or analysis in this note is not an offer to sell or the solicitation of an offer to buy any securities. Nothing in this note is intended to be investment advice and nor should it be relied upon to make investment decisions. Cestrian Capital Research, Inc., its employees, agents or affiliates, including the author of this note, or related persons, may have a position in any stocks, security, or financial instrument referenced in this note. Any opinions, analyses, or probabilities expressed in this note are those of the author as of the note's date of publication and are subject to change without notice. Companies referenced in this note or their employees or affiliates may be customers of Cestrian Capital Research, Inc. Cestrian Capital Research, Inc. values both its independence and transparency and does not believe that this presents a material potential conflict of interest or impacts the content of its research or publications.
Q3
by Alex King, CEO, Cestrian Capital Research, Inc
The quarterly cadence is as real in securities markets as it is in corporate earnings. New quarters typically see new single-stock leaders and new single-stock laggards; new sector ETF leaders and new sector ETF laggards.
The reason for this may have something to do with moon phases, I certainly wouldn’t rule that out, but it’s more likely a result of large price-setting investors using rotation to generate and realize gains. If compounding is the Eighth Wonder Of The World, as Mr. Buffett will attest, rotation is the Ninth. Why? Because it uses money to generate money from absolutely nowhere. If, as we all know, there is no simple infinite-money-glitch in this world then the closest thing to it is rotation. Mr. Wyckoff had this all figured out a while back (here) but to recap: if you manage enough money, you can use that money to move the market in a security. The bigger and more liquid the security, the more money you need to move it. And in a simple schema you will follow four phases of moneymaking.
- Accumulation - as a large investor, when buying into a stock or ETF, you cannot simply YOLO your way to returns. You have to buy in piecemeal, slowly-slowly, using small volume orders broken up and distributed around the various trading venues so that your intent is harder to spot. You need to take time to do this to build a position which is meaningfully large. And you need the market to not move against you whilst you are doing so - so you will use all other legitimate tools available to you, such as trading options to apply exogenous pressure one way or another to the stock price. You will typically execute this accumulation during periods when the stock or ETF is out of favor with the masses; you’ll buy tech in 2022, energy in 2020-21, real estate in maybe 2027-28, etc.
- Markup - when you have a position of sufficient size you will sit back and do nothing, whilst “good news” stories of all kinds pop up all over the market. Bloomberg articles, X posts, Barron’s features, CNBC interviews, they will magically be talking up the very stuff you bought in the last year! - amazing. At this point, you can expect the price to start moving up and momentum buyers stepping in. Note, momentum buyers aren’t dumb money, they are just playing a different game to you. You have too much money to play momentum - if you start, the price will run away from you. But smaller funds, let’s say sub $10bn funds, advisors, retail, this group of investors, they can do well with this strategy. You, because of your size, have to buy low, sit back, sell high. Momentum buyers can buy high, sell higher. During this markup phase, everyone is happy.
- Distribution - as momentum starts to stall, because the wiser momentum investors are now taking profits and jumping off the train as it slows, you will have started selling. Again slowly-slowly to not spoil the price; again using all manner of options strategies to keep the price within your chosen guardrails; during this time you will sell carefully, using distributed orders broken up into small blocks to hide your intent from wily bots and the few remaining human analysts. Congratulations! You made bank.
- Markdown - now there are no buyers of the stock, and the name starts to fall. Late sellers run for the door, causing further collapse. You are at this point enjoying a well-earned sundowner / Big Cab / Dr. Pepper /
Think this is just a conceptual model? It’s not. I give you a complete Wyckoff Cycle here in $IRDM stock.
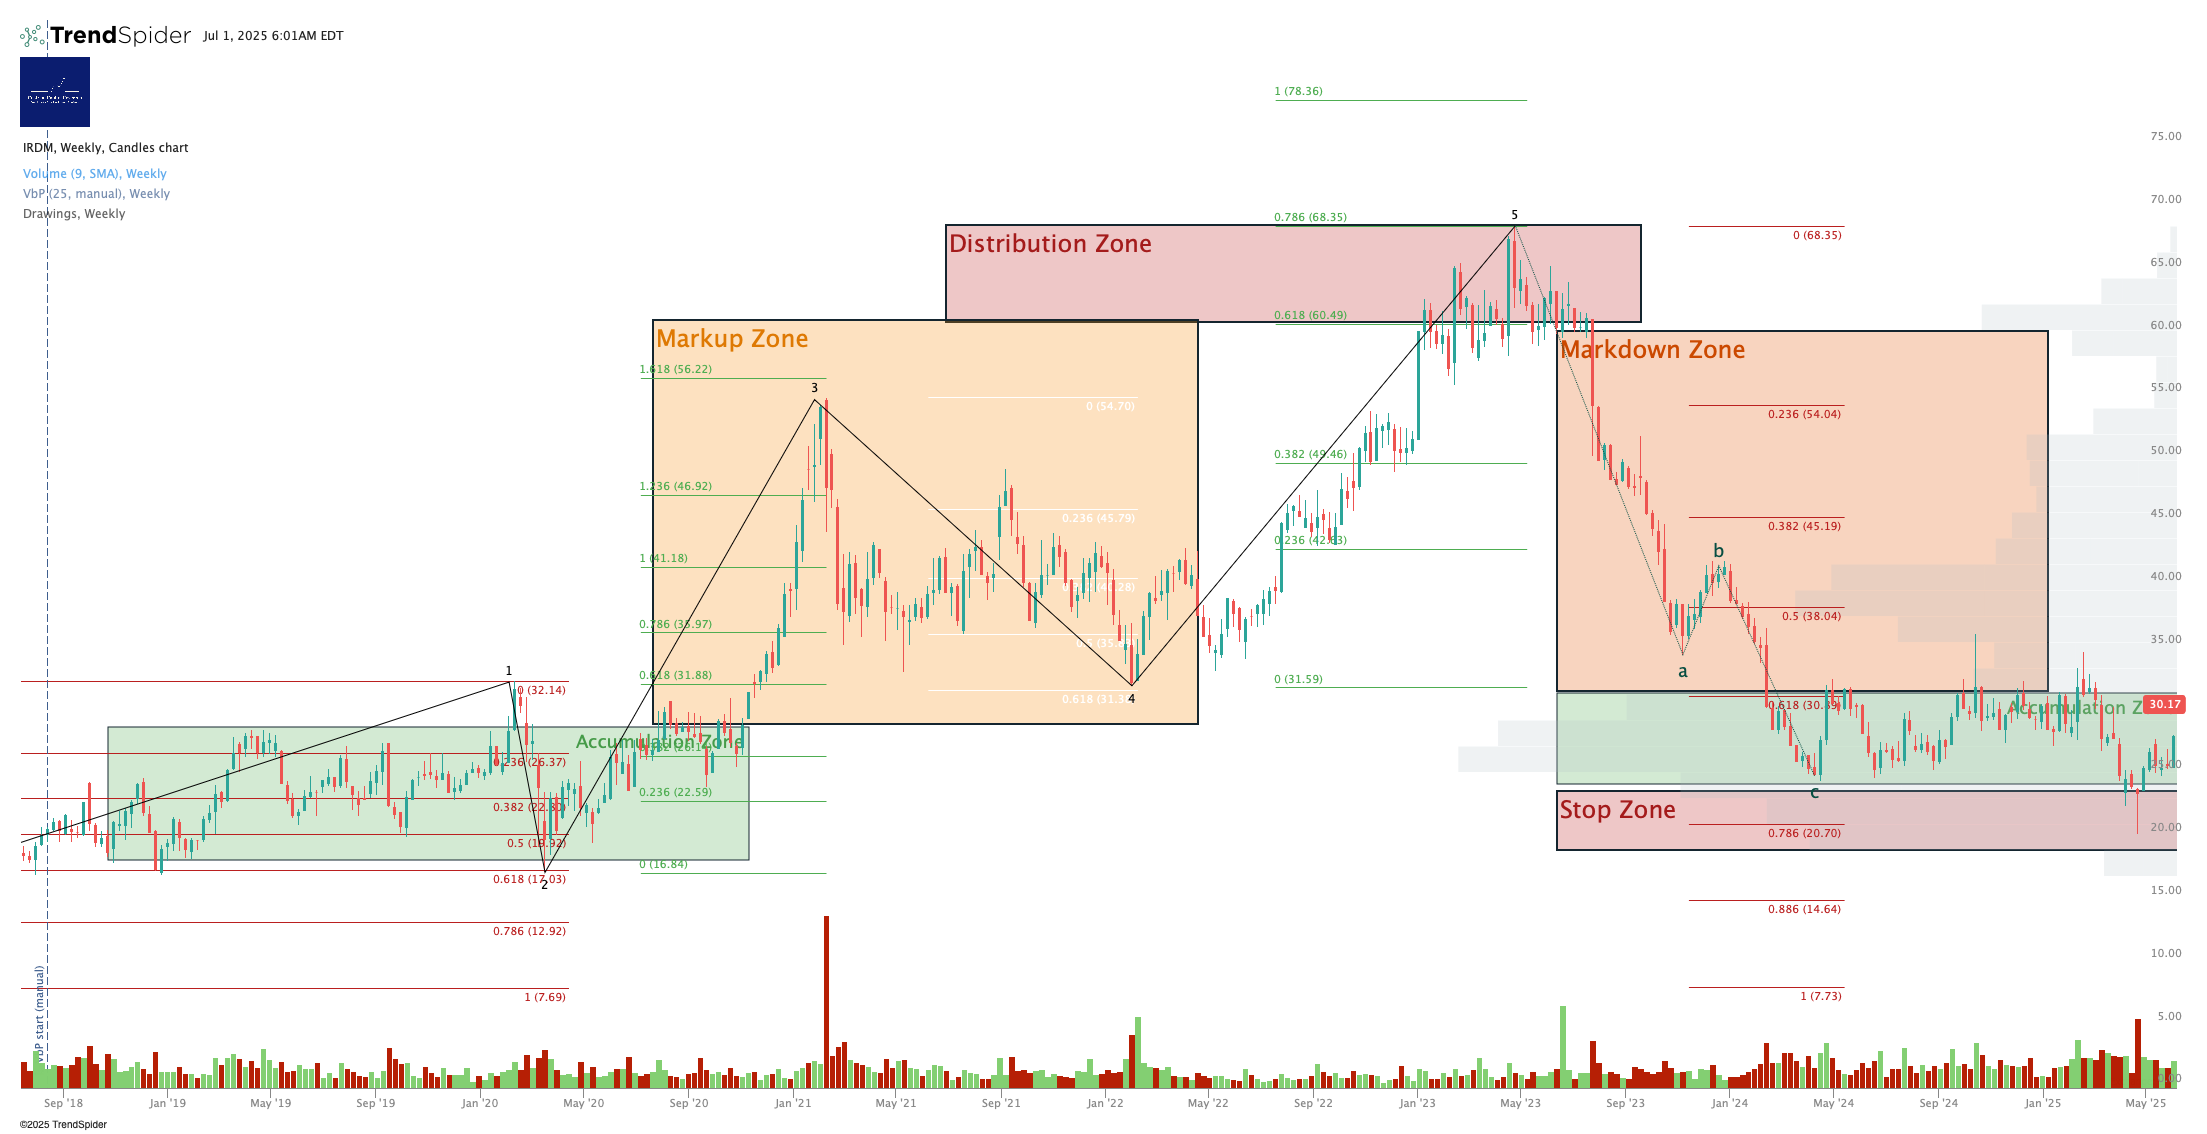
You see? Free money, if you are patient. And if you have a number of these wheezes playing out, all at different points in the cycle, you can see that you can be making money all year long, every year, whether the indices are rising or falling. Purely as a result of your heft. Kudos!
Now, fortunately, anyone who has less than $10bn on hand can play along, because try as you might, these pesky stock charts do reveal your intent - not perfectly, not blow by blow, but at a level of accuracy good enough to use. A breadcrumb trail that sub-Leviathan investors can use. We do this all the time in our ETF and single stock coverage in our Inner Circle service.
Let’s take a look at how Q3 is opening.
But first - don’t miss our Independence Day event.
Independence Day Sale
There’s never been a better time to sign up for our Inner Circle service. And until the close of Friday, you can do so at a reduced rate.
Inner Circle is our very best work - our highest-quality single-stock and ETF coverage, broadest set of trade alerts, professional-grade webinar presentations and discussions and more. Better yet, the investor & trader community in our enterprise-grade Slack workspace is superb - a wealth of experience and insight working together to help everyone raise their game.
Whether you manage your own capital, advise client capital, or invest limited partner capital, Inner Circle is for you.
We’re offering 30% off Annual and 6-Year Extended memberships. If you’ve been thinking about signing up, or you currently pay monthly and you’d like to reduce your total cost of membership, this offer is for you.
Pricing with the Independence Day discount:
- Annual Independent - falls from $4999/yr to $3499/yr (here)
- Annual Investment Professional - falls from $9999/yr to $6999/yr (here)
- 6-Year Extended Independent - falls from $19,999 to $13,999, equivalent to just $233/mo (here)
- 6-Year Extended Investment Professional - falls from $39,999 to $27,999 (here).
Please note, for those of you who signed up for any of these Inner Circle membership tiers in the month of June, we’ll offer you a store credit equal to the discounts above, which you can use against any Cestrian purchases within the next 6 months.
OK. Let’s get to work!
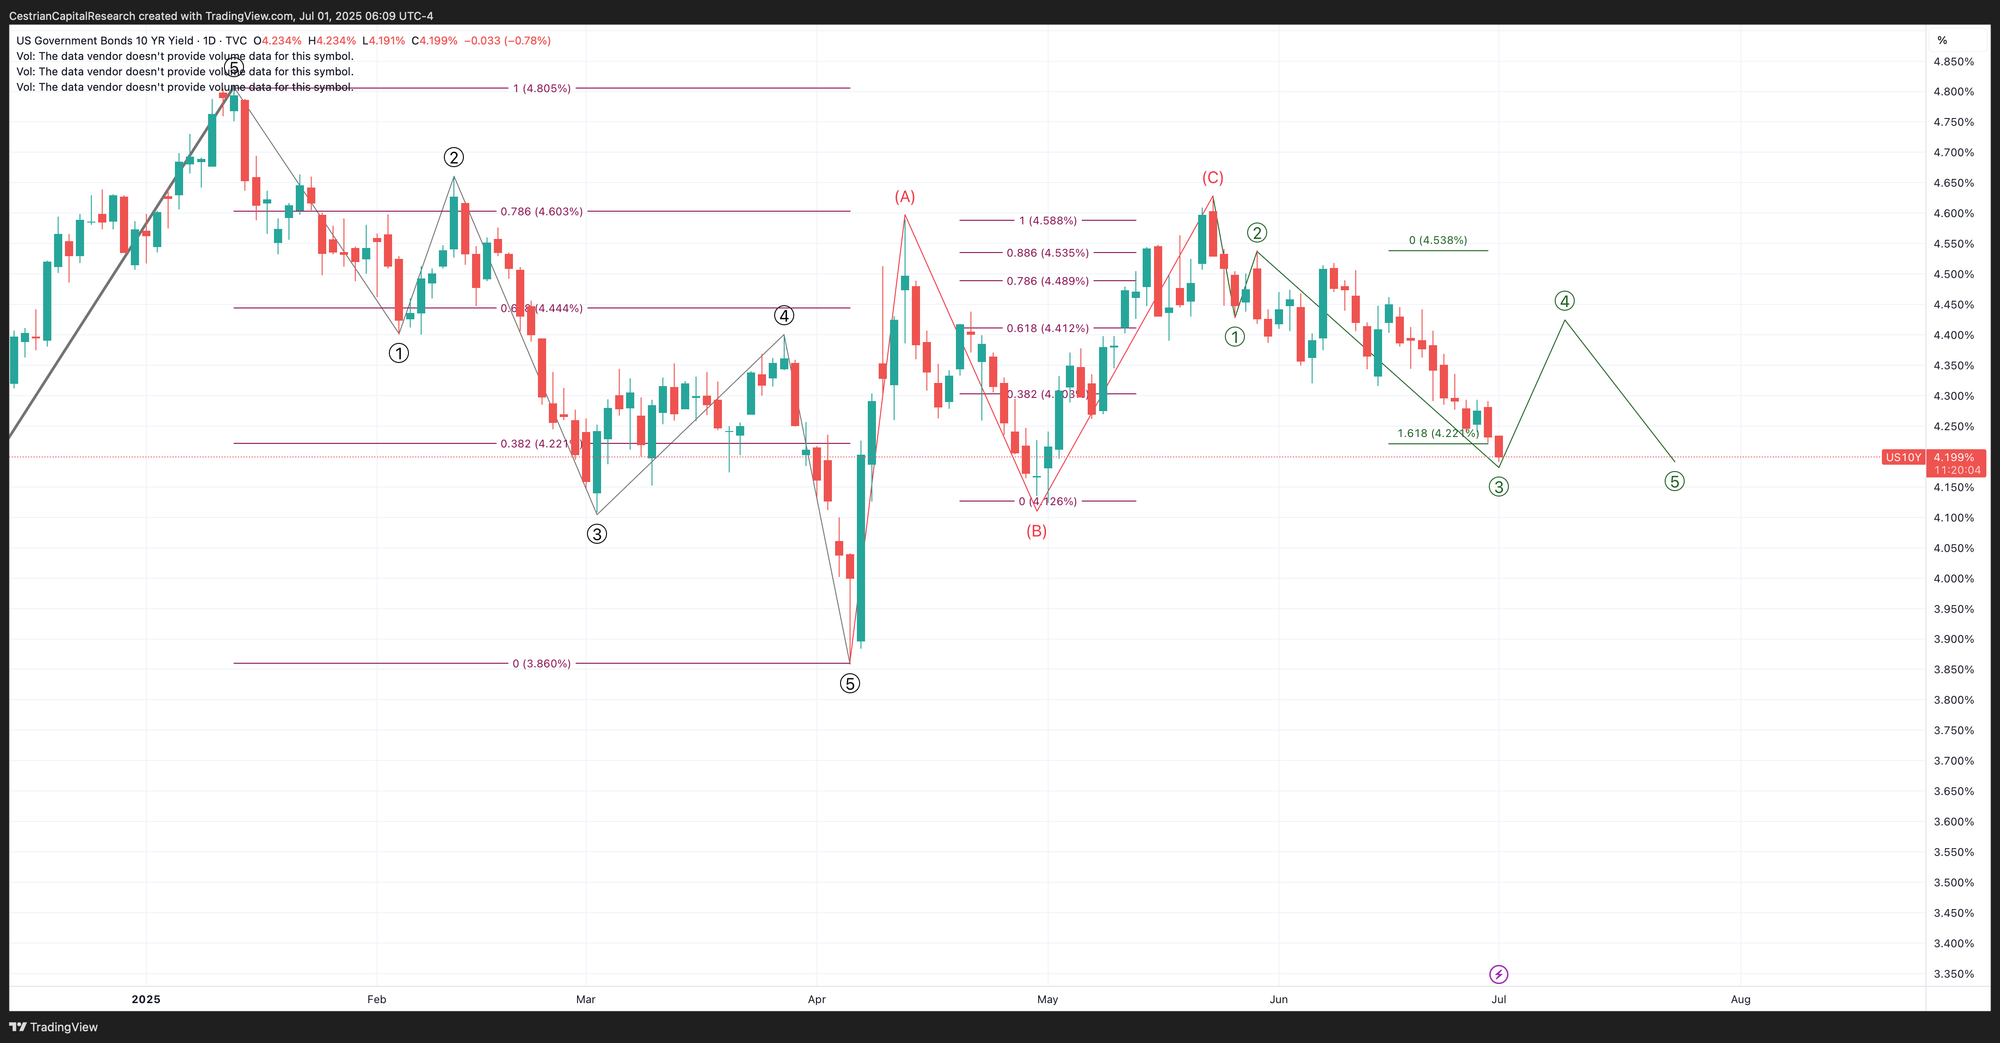
US 10-Year Yield
A push deeper than the 1.618 extension shown - that’s bullish for Treasuries.
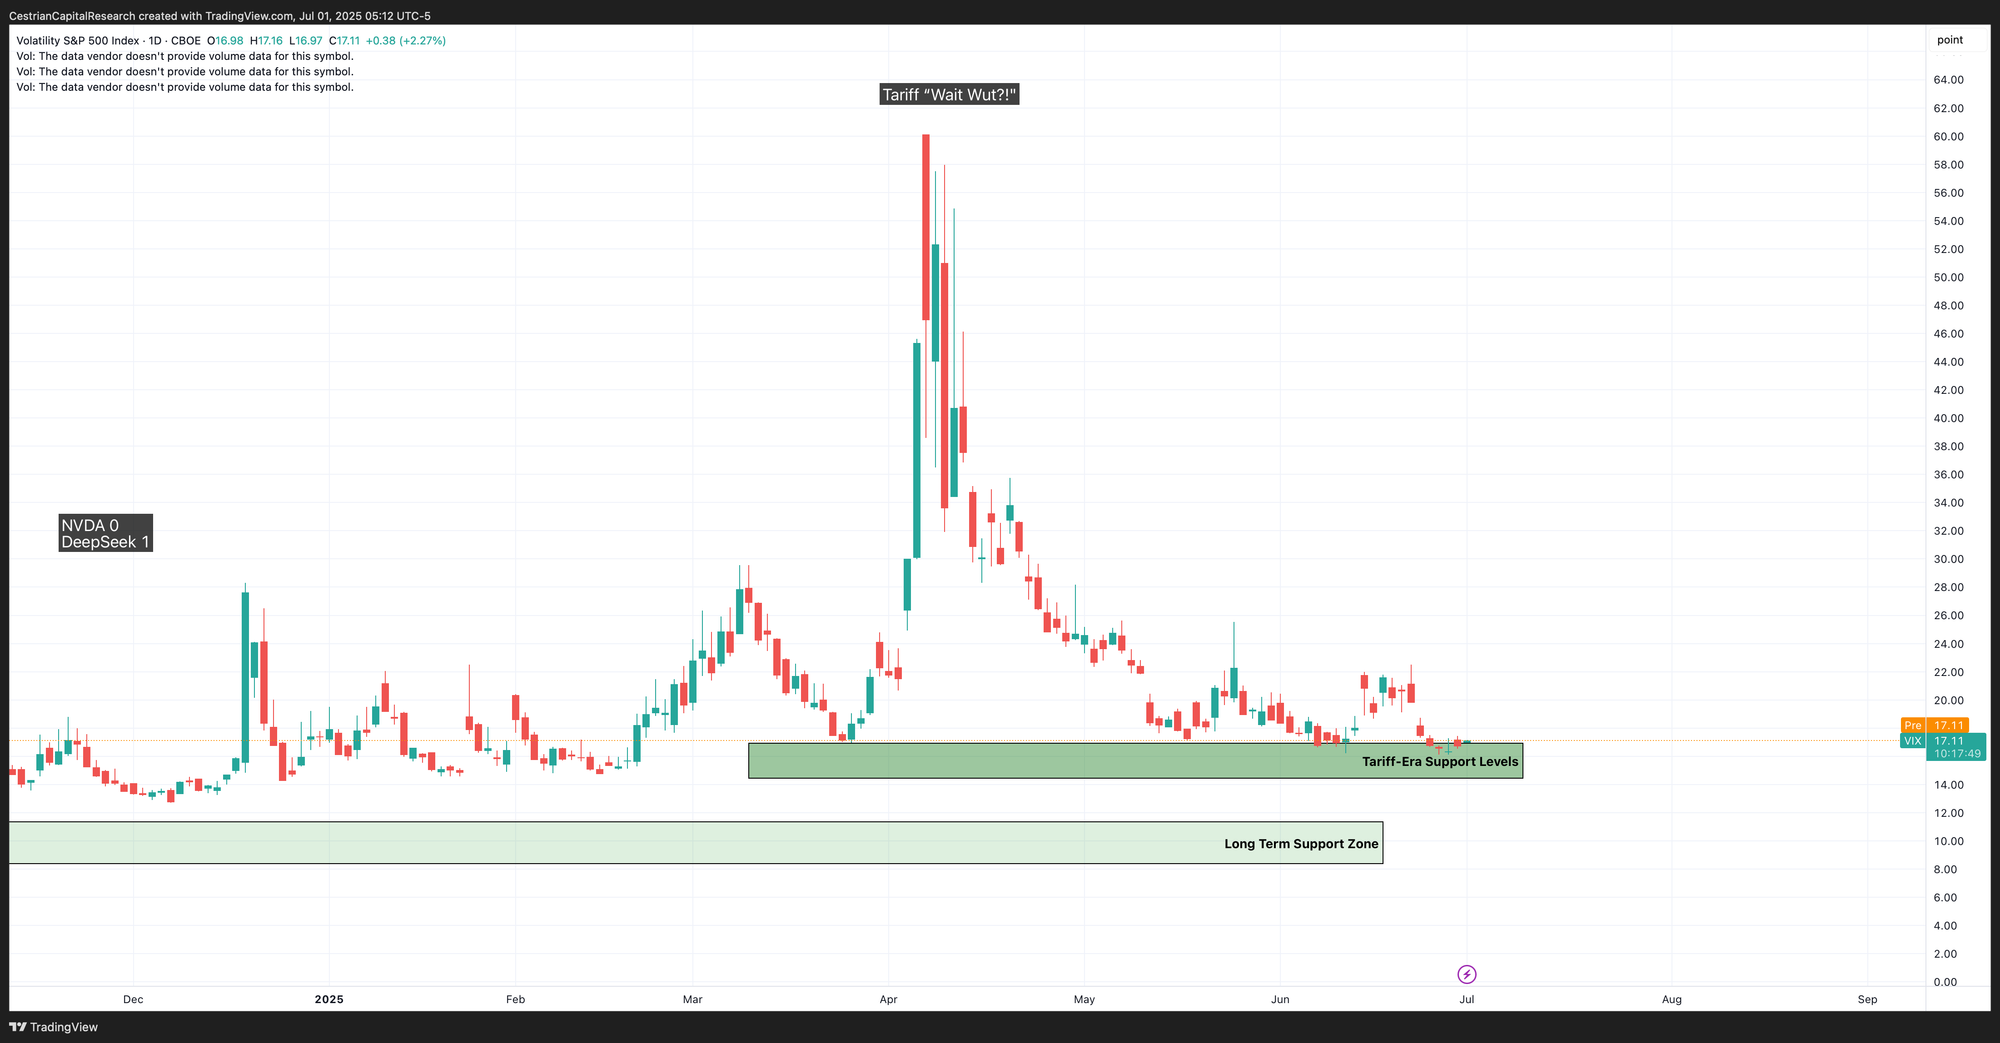
Equity Volatility
What happens to the Vix in the next couple of days will, I think, be quite instructive for the quarter. If we are going to see defensiveness build amongst bigs, the put-buying will begin to ramp up. The Vix, as you know, measures >30DTE S&P500 put buying; so if the Vix stays subdued we can perhaps expect a call-heavy Q3 options expiry which itself can trigger a selloff after the event. (We’ll explain why during our next Inner Circle webinar). For now, the Vix remains at the lows.
Disclosure: No position in any Vix-based securities.
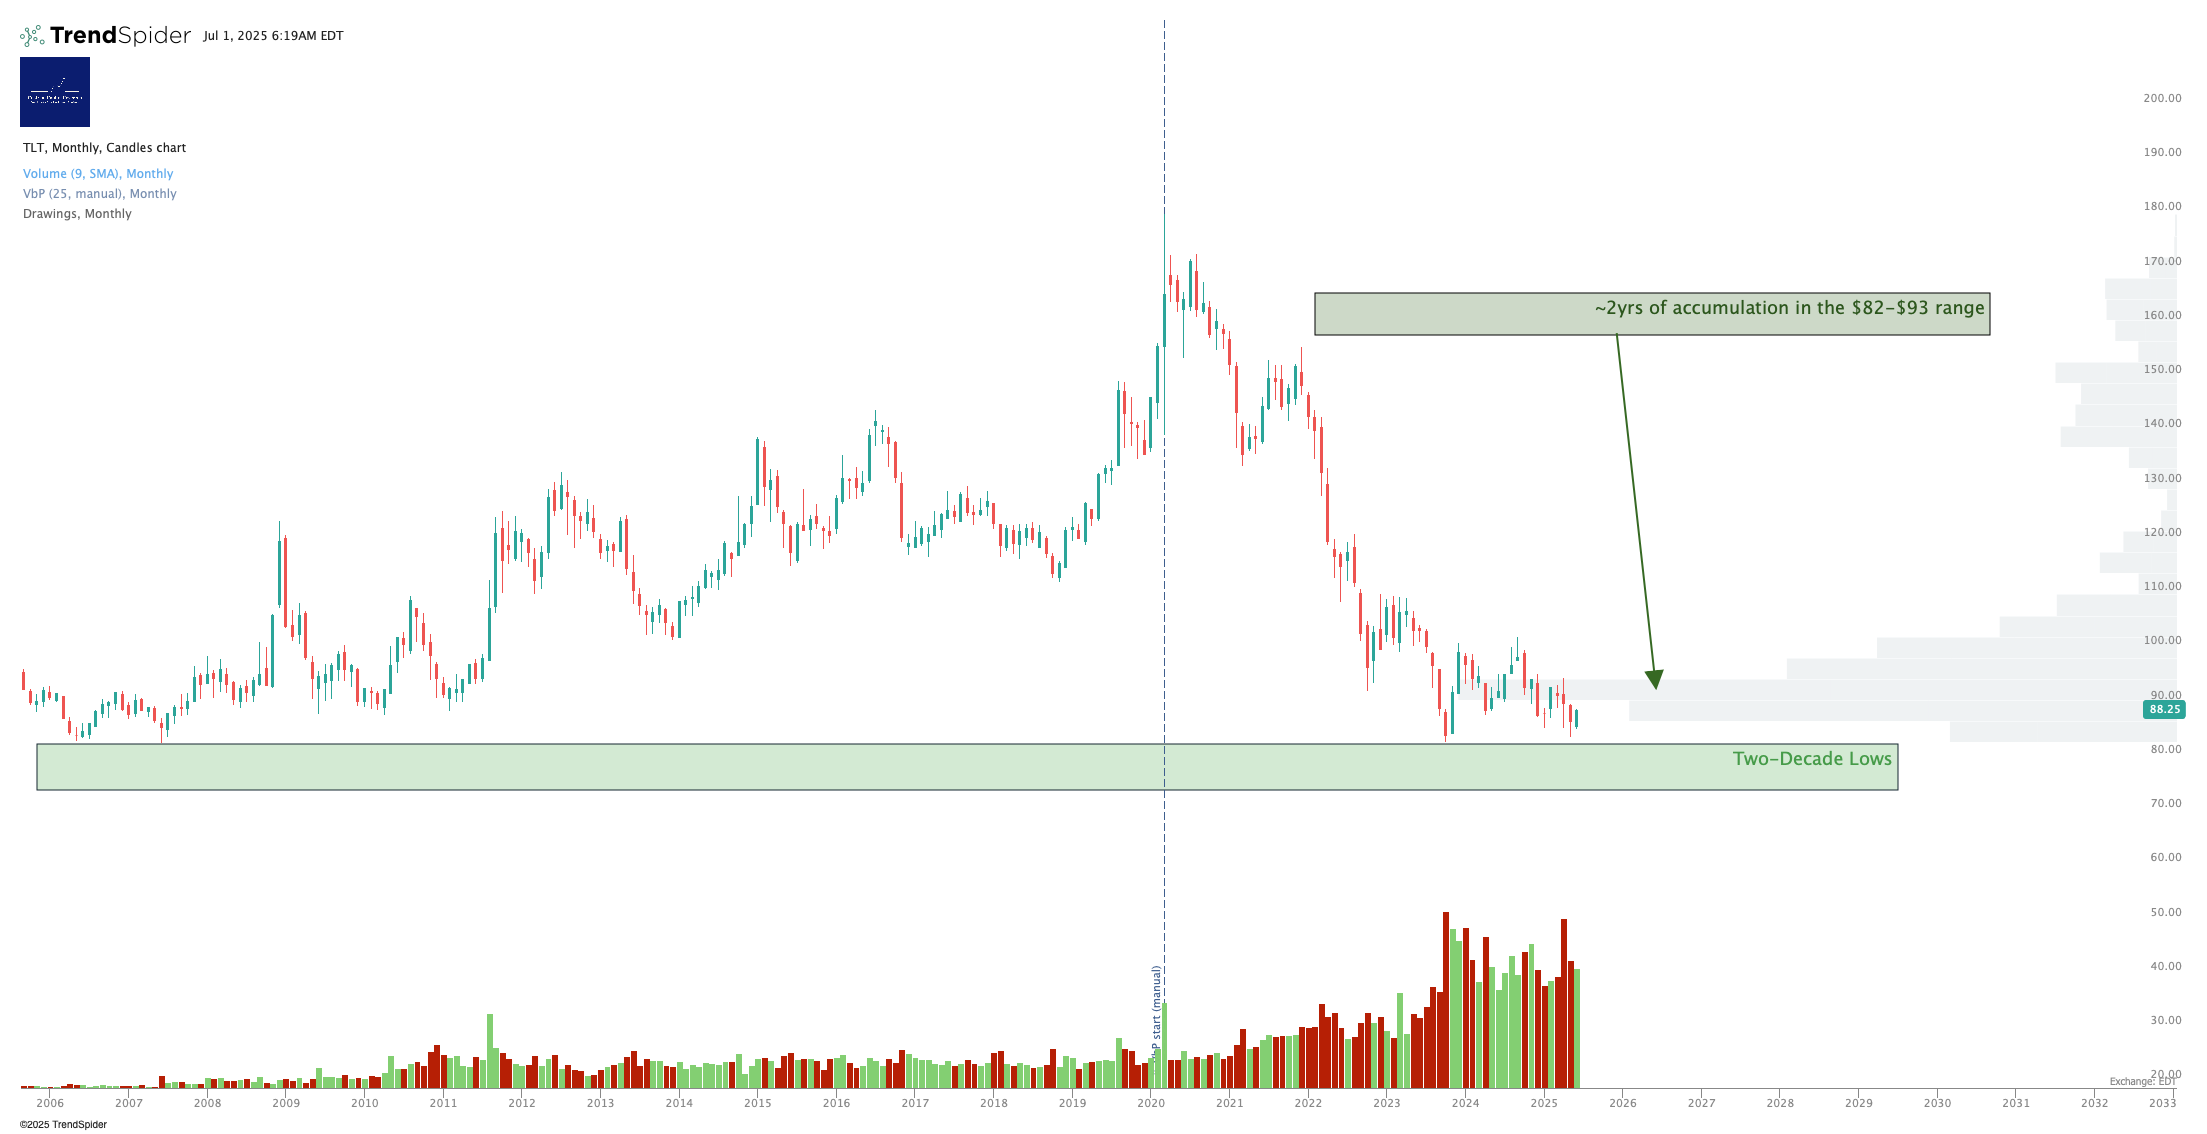
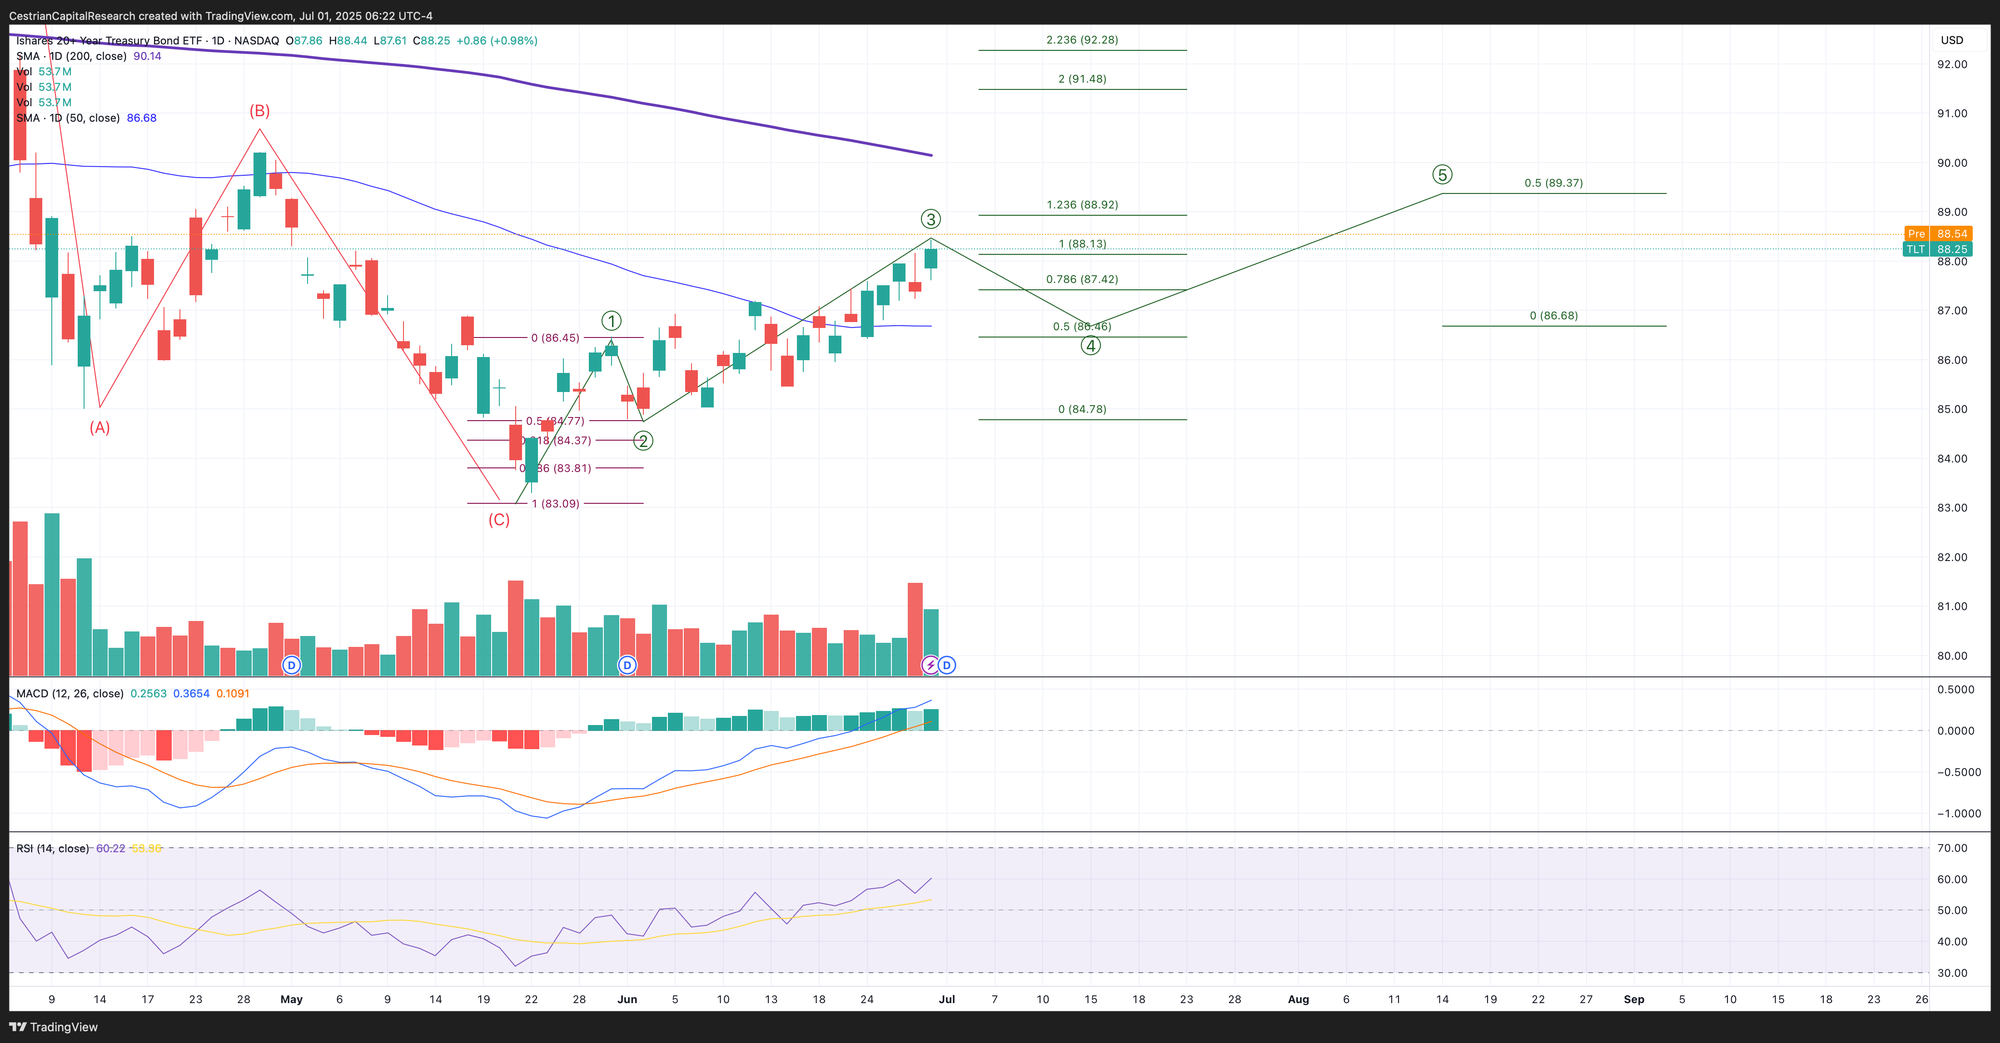
Longer-Term Treasury Bonds (TLT / TMF)
I don’t know, but based on the breadcrumb trail I suspect, that a two-year long accumulation campaign in US government bonds is going to pay off in the next couple years.
Seems on a solid uptrend in this smaller timeframe. If I had to guess I would say support at the 50-day and resistance at the 200-day - the Fibonacci levels seem to broadly support that thesis. (In the end all technical analysis methods converge!).
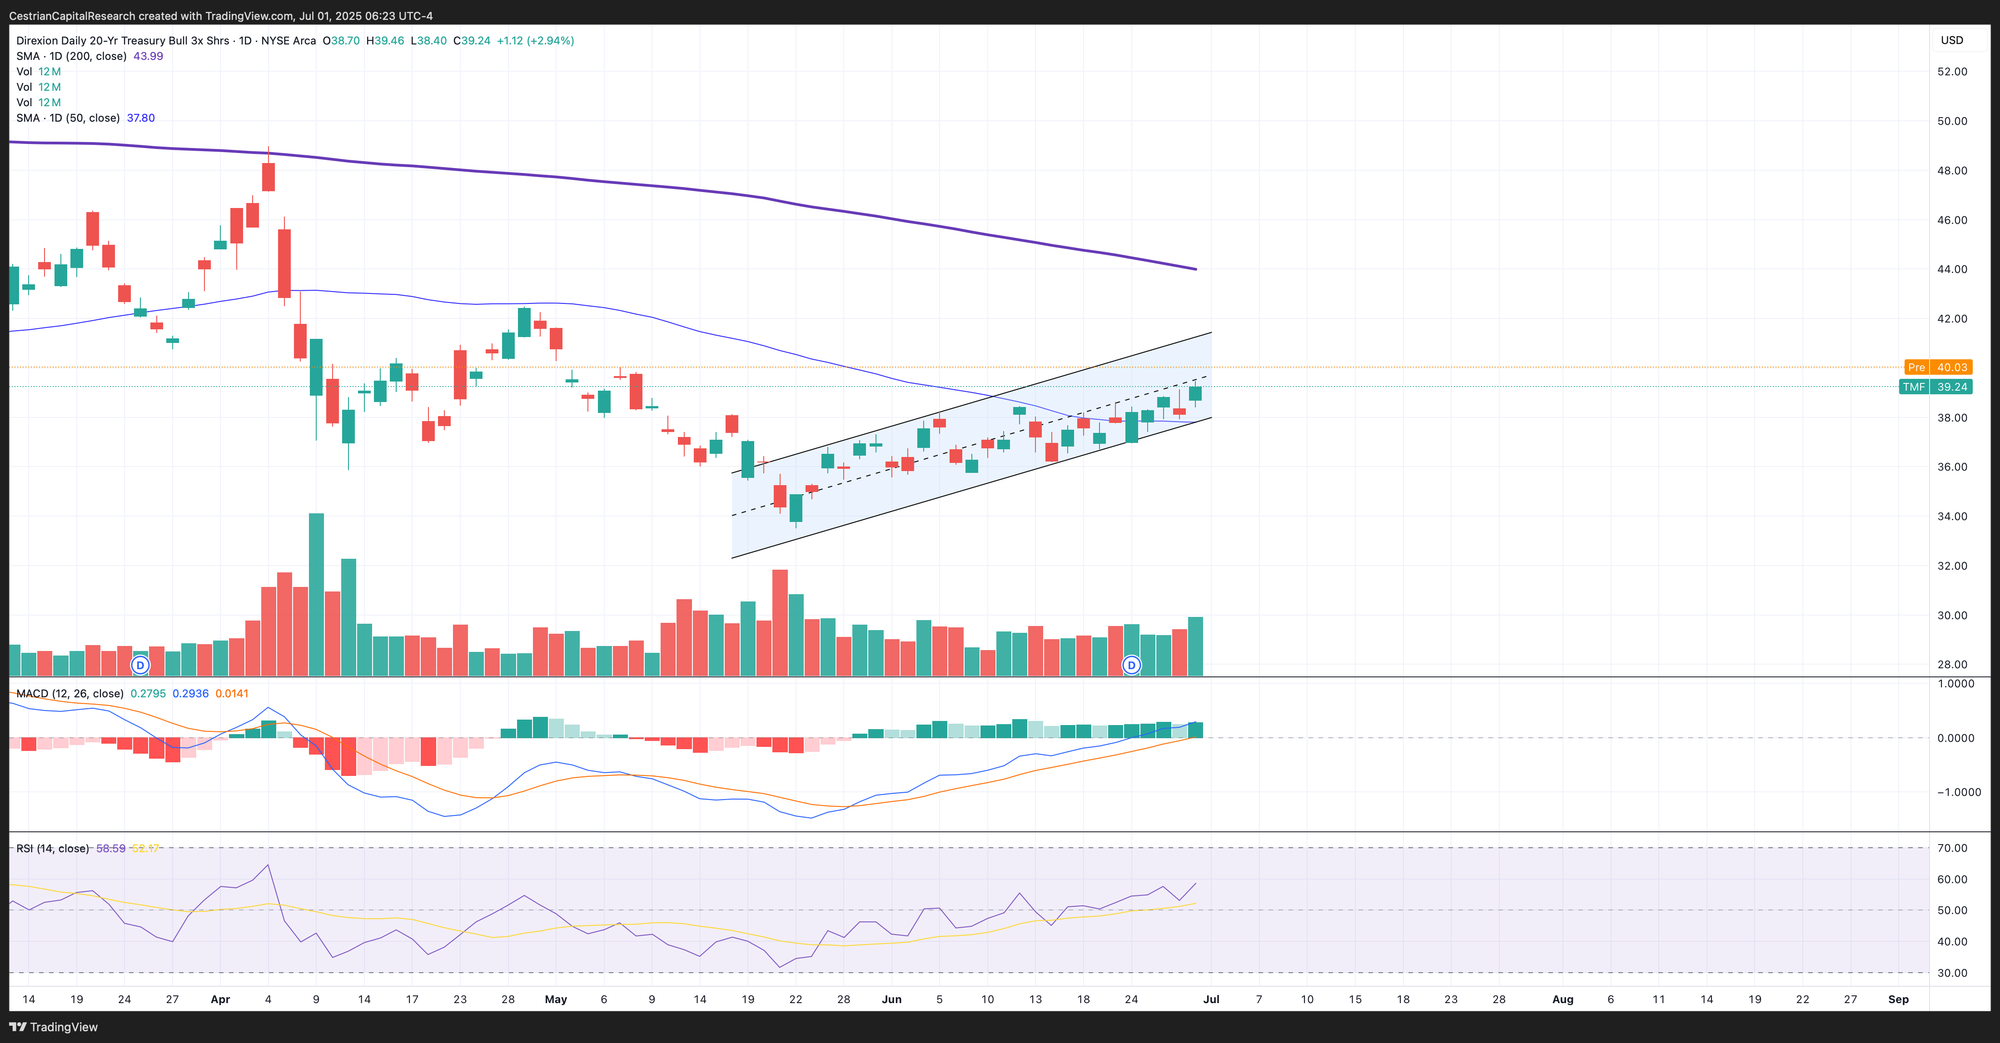
Note - Leveraged ETF. Read the fund documentation if you are considering using this instrument.
Nicely up off the lows and still climbing; momentum has yet to peak; bullish I think.
Disclosure: I am long $TLT and similar EU UCITS ETFs, and long $TMV by way of a small hedge (overall net long bonds).
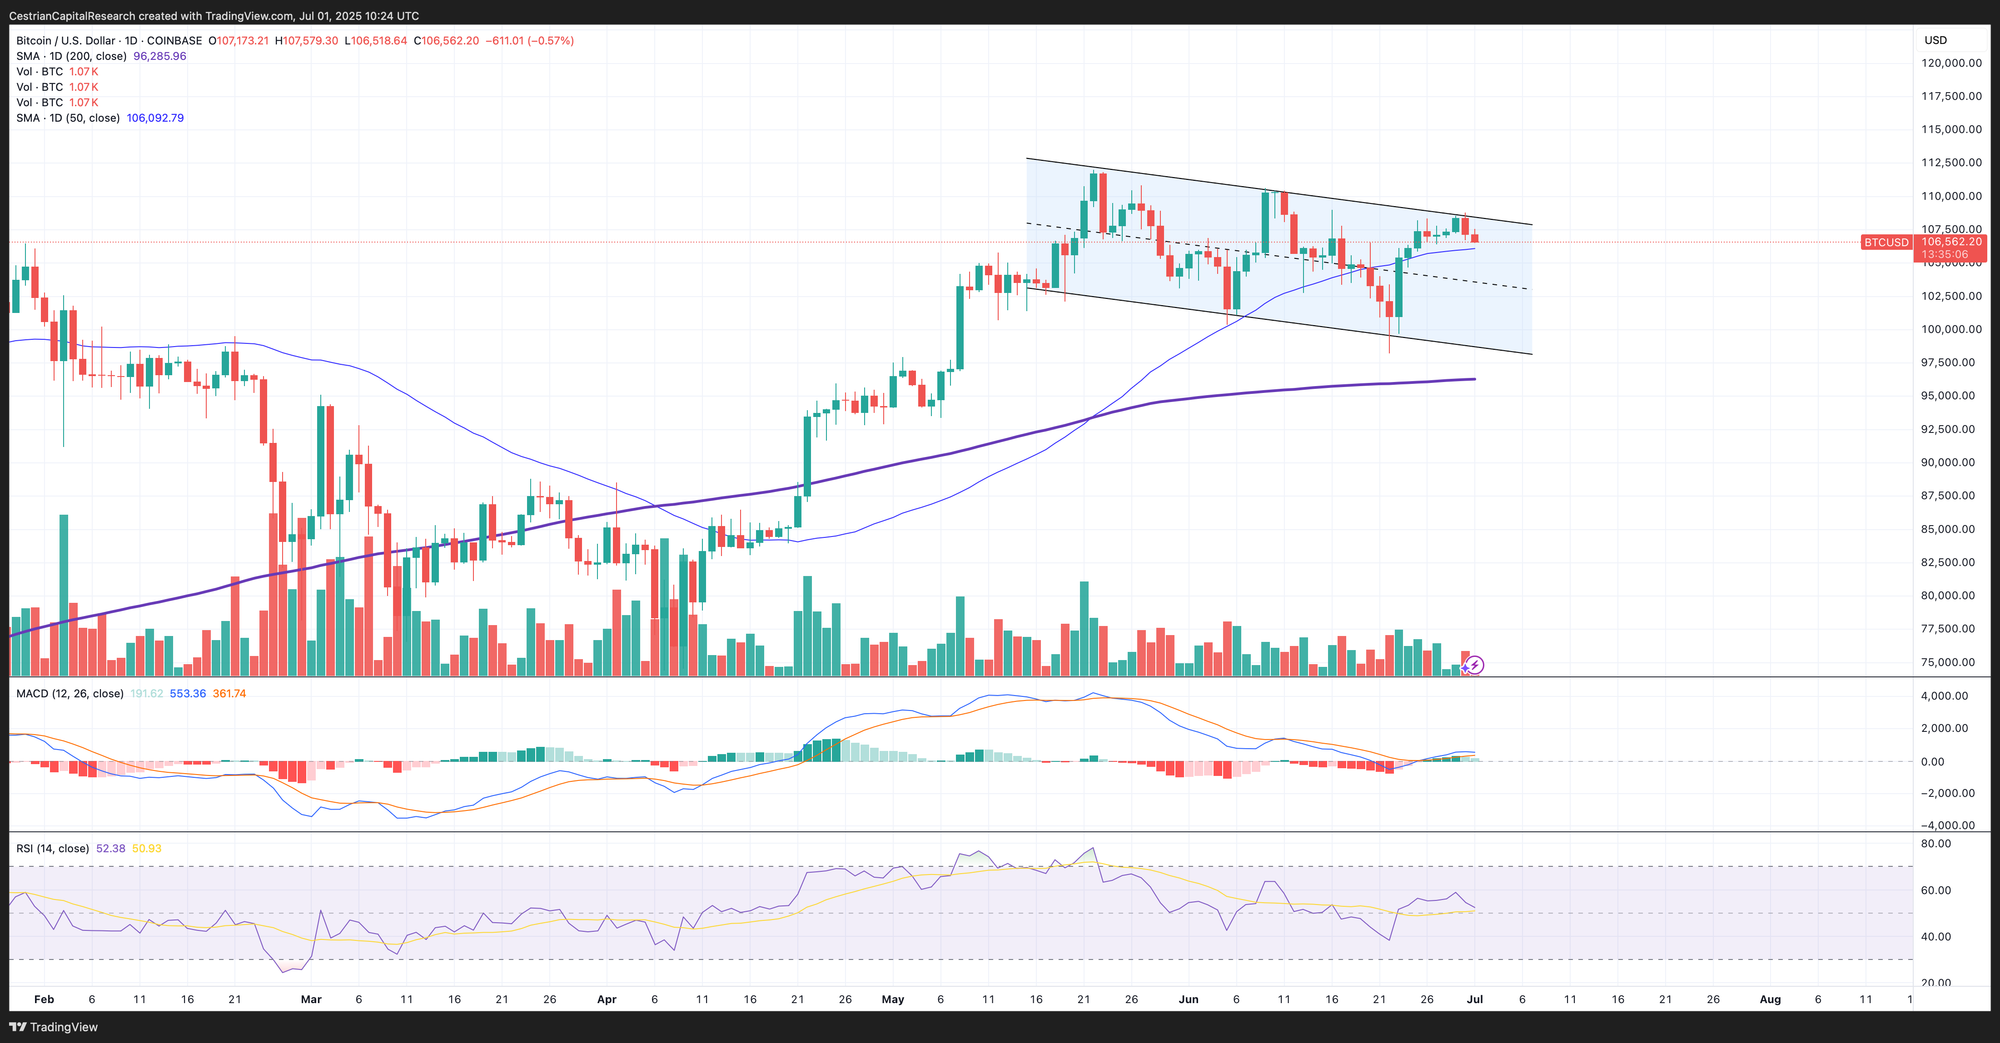
Bitcoin
No change. Short-term downtrend continues; I would be surprised if the 50-day moving average at around $106k didn’t hold. I confess I am slightly puzzled by Bitcoin’s weakness here and I would interpret it two ways. Firstly, a lack of new volume buyers after the run-up fueled by Strategy ($MSTR) and other “Bitcoin Treasury Companies (!)”; secondly it may portend some weakness in equities - I would not hang my hat on that latter point. A break of the 50-day would be meaningful I think; until then probably safest to treat this as just a modest pullback.
Bitcoin risk signals, here (independent investors) or here (investment professionals).
Disclosure - No position in Bitcoin.
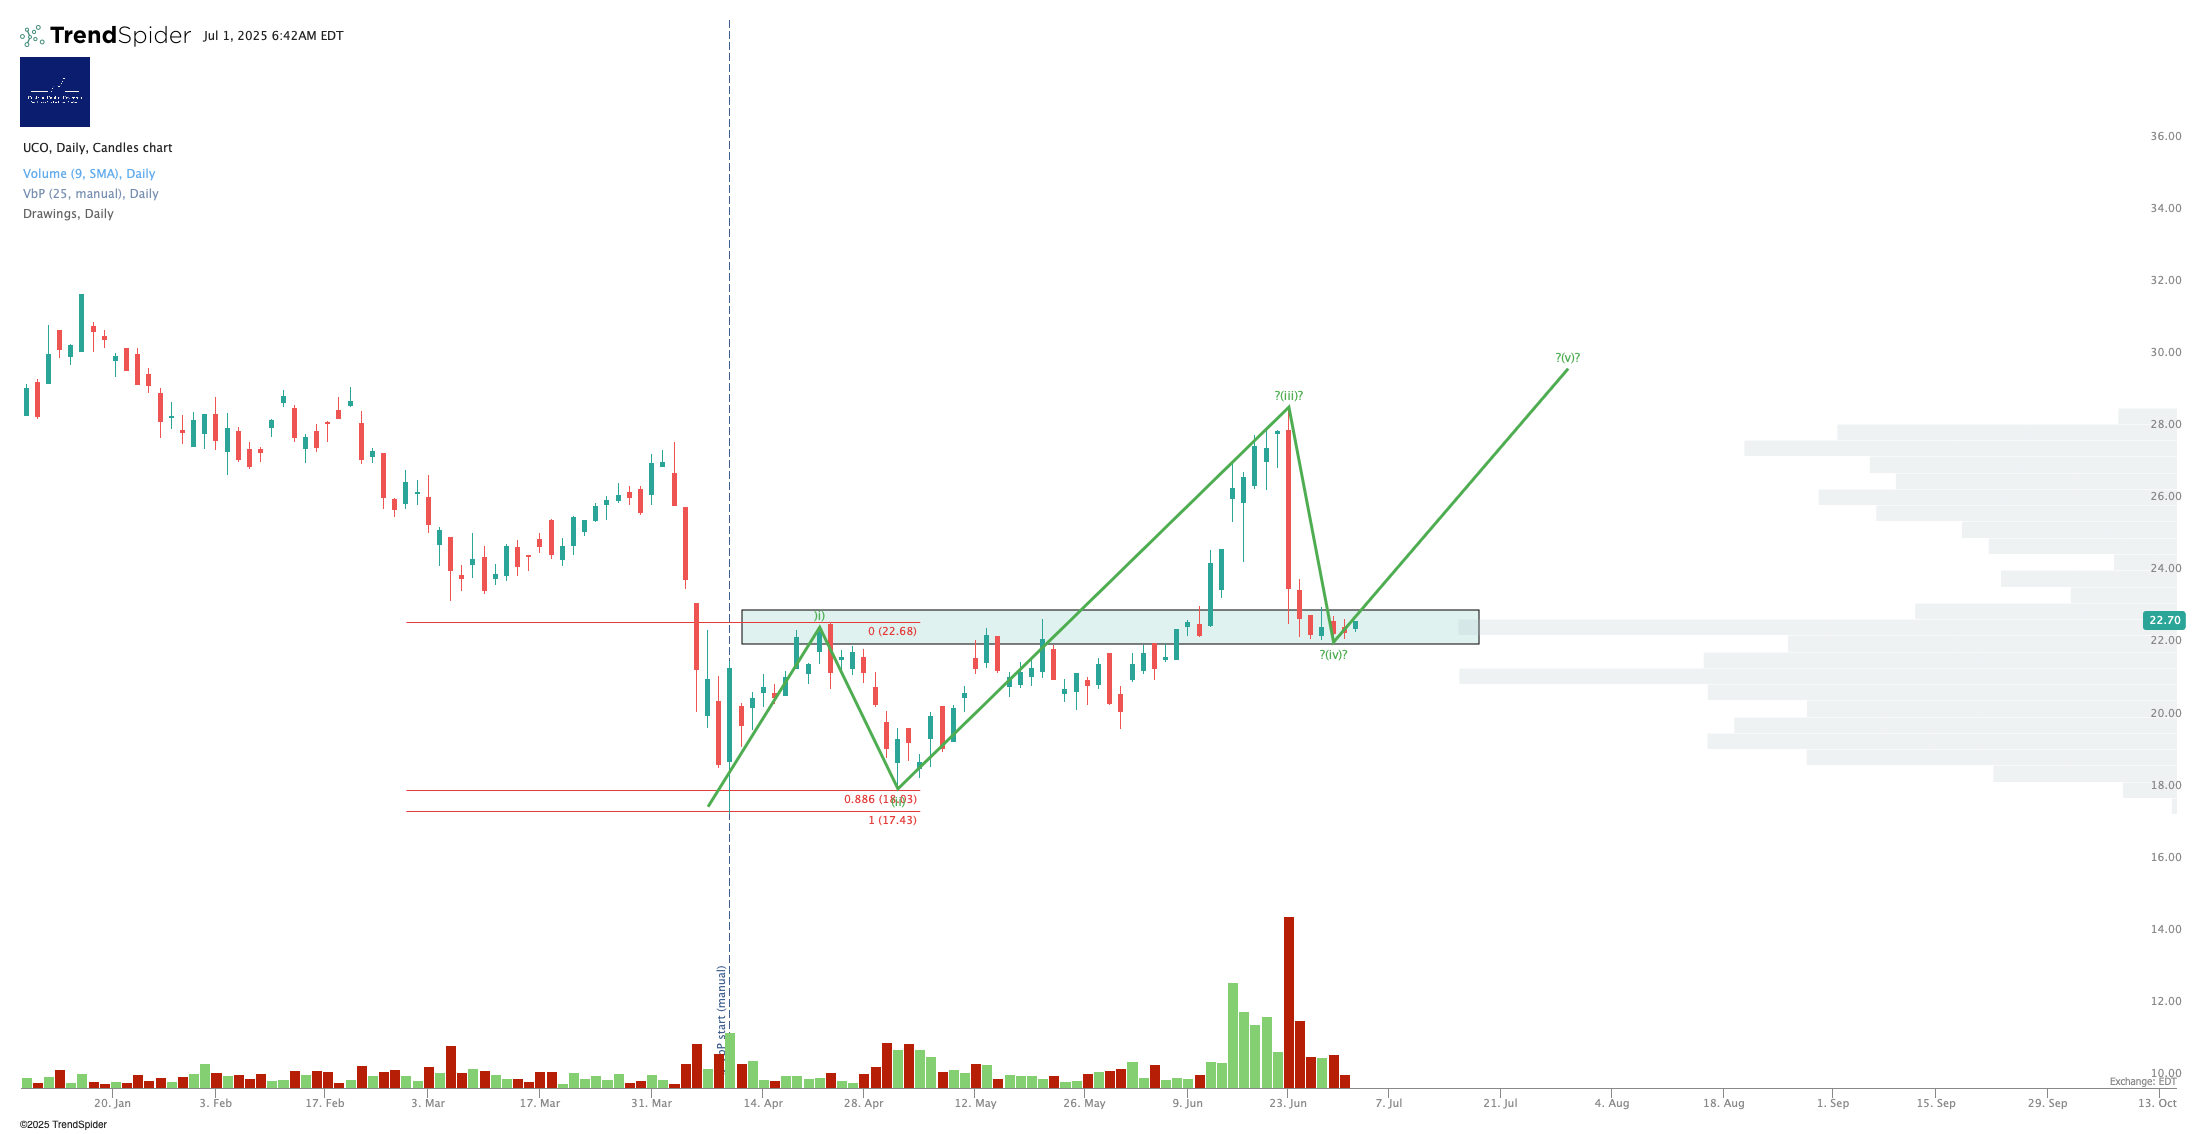
Oil (USO / WTI / UCO)
I think we may see USO climb towards the top of this wedge once more.
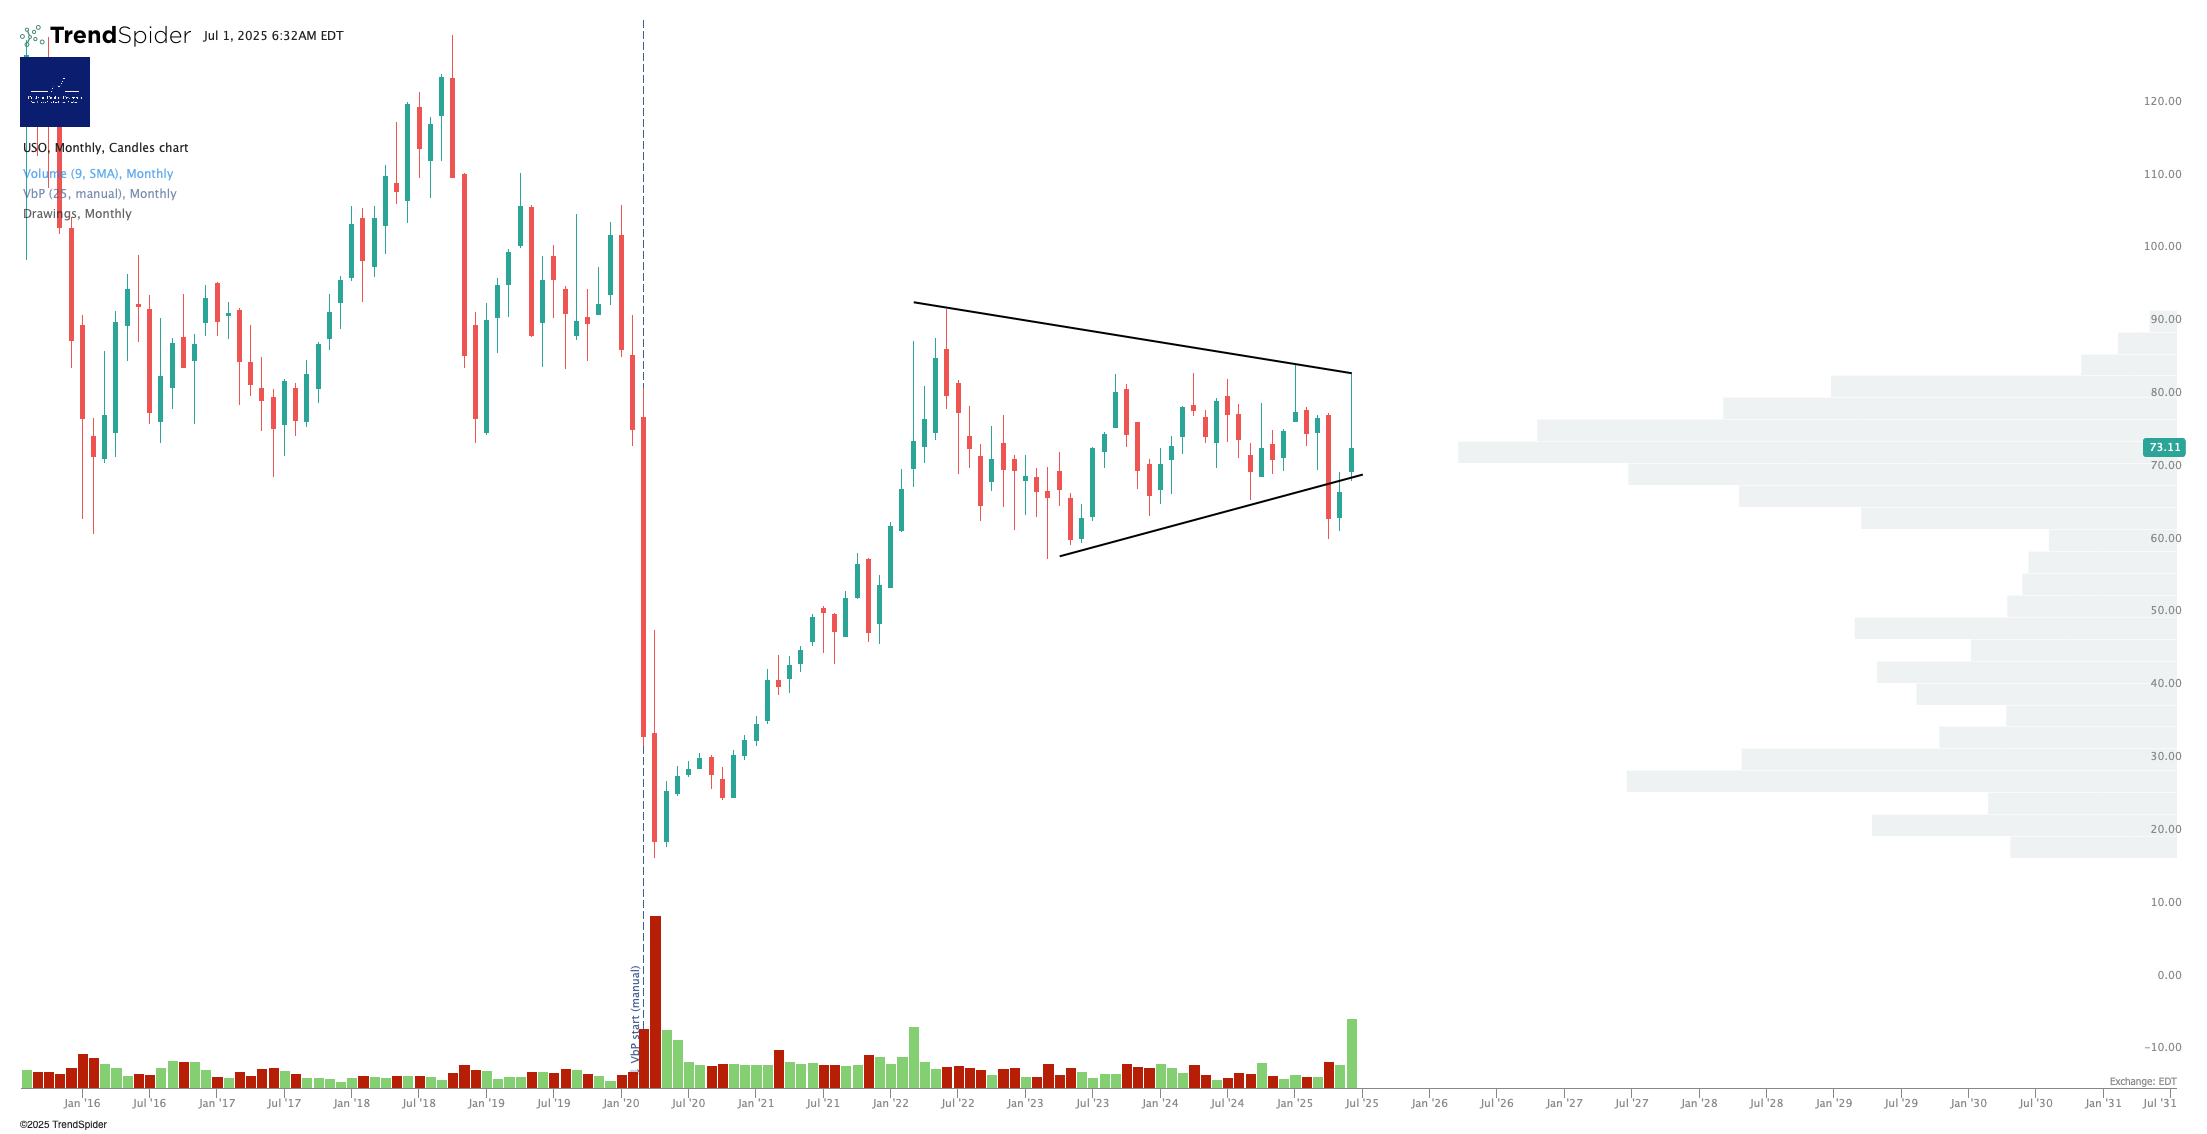
Continues to hold the line over that .618 retrace.
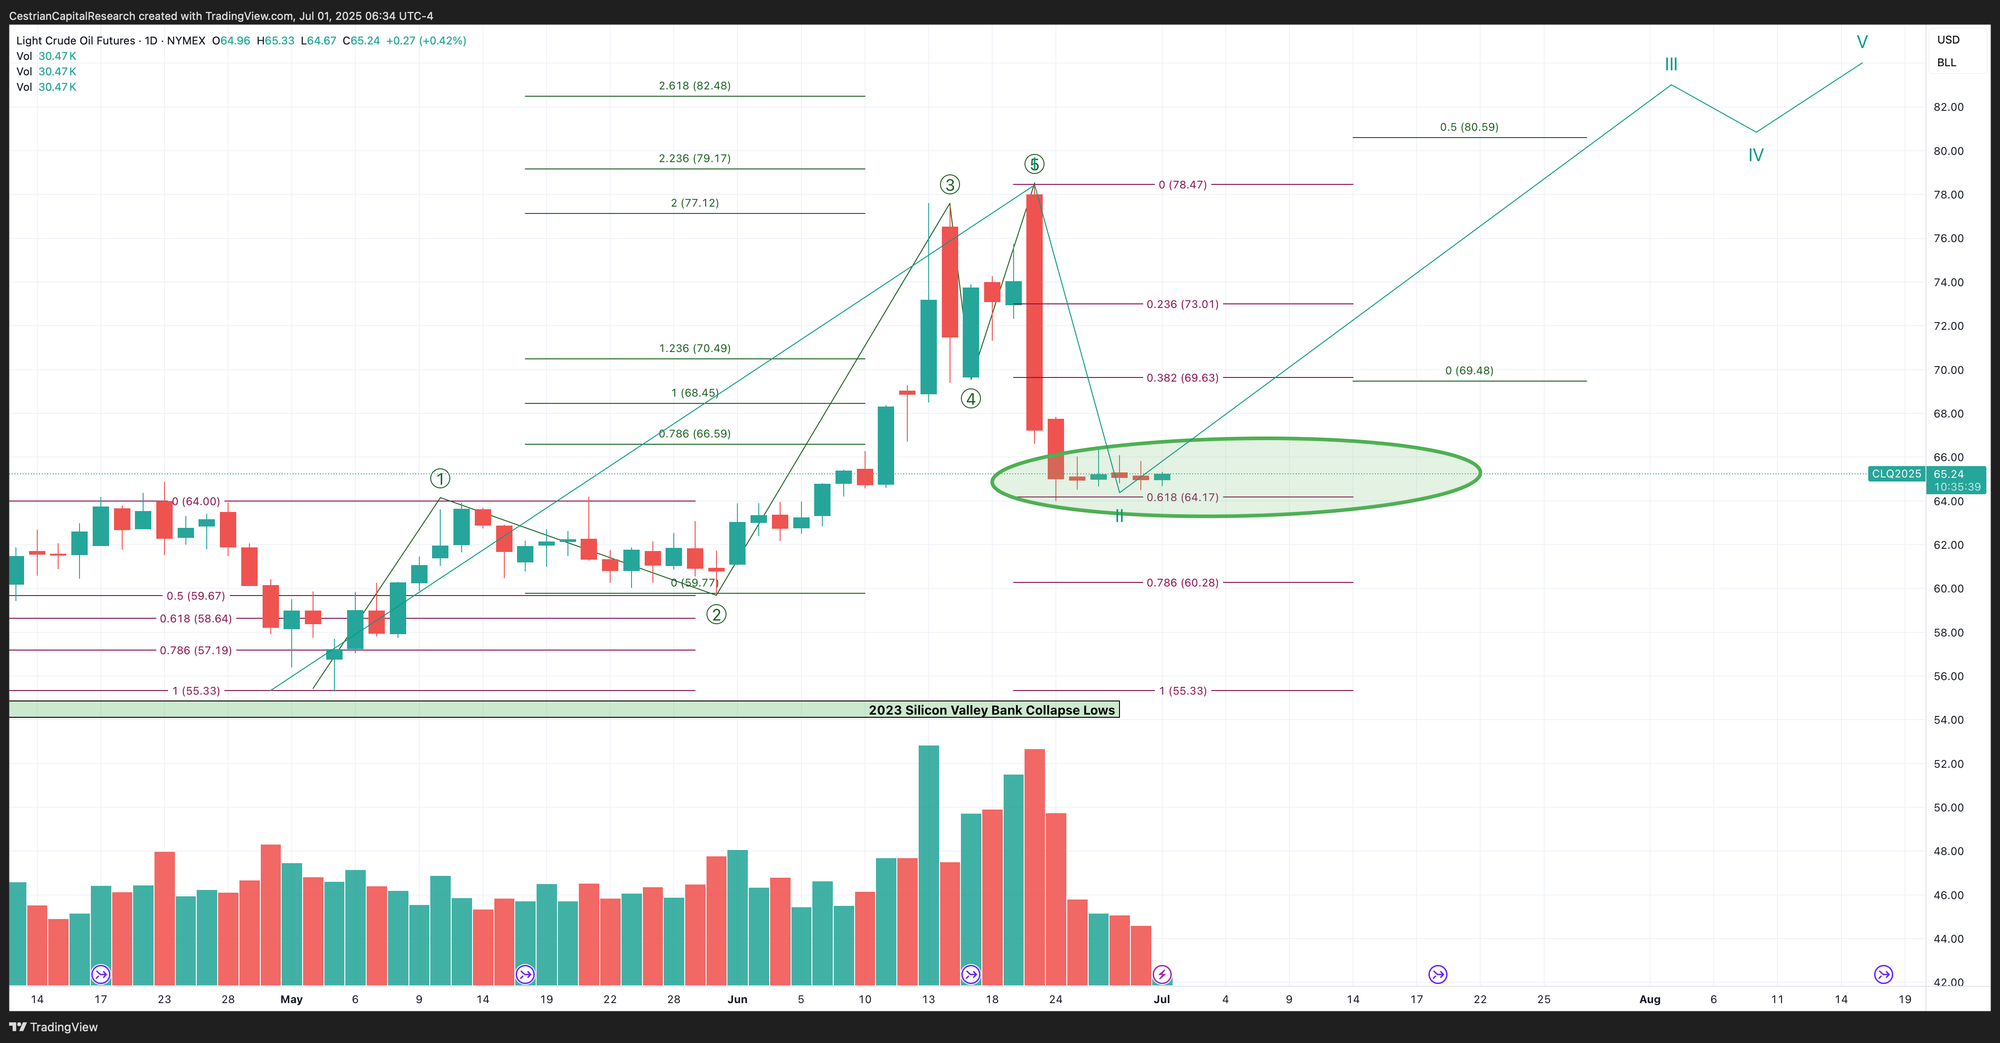
Note - Leveraged ETF. Read the fund documentation if you are considering using this instrument.
No change from yesterday, which is news in itself.
An unusually clear read from a leveraged ETF. Doesn’t mean that oil is definitely going to go up, but it does set some clear risk/reward parameters with upside potential ahead and stop or hedging potential a little below that Wave 4 low.
Disclosure: No position in oil.
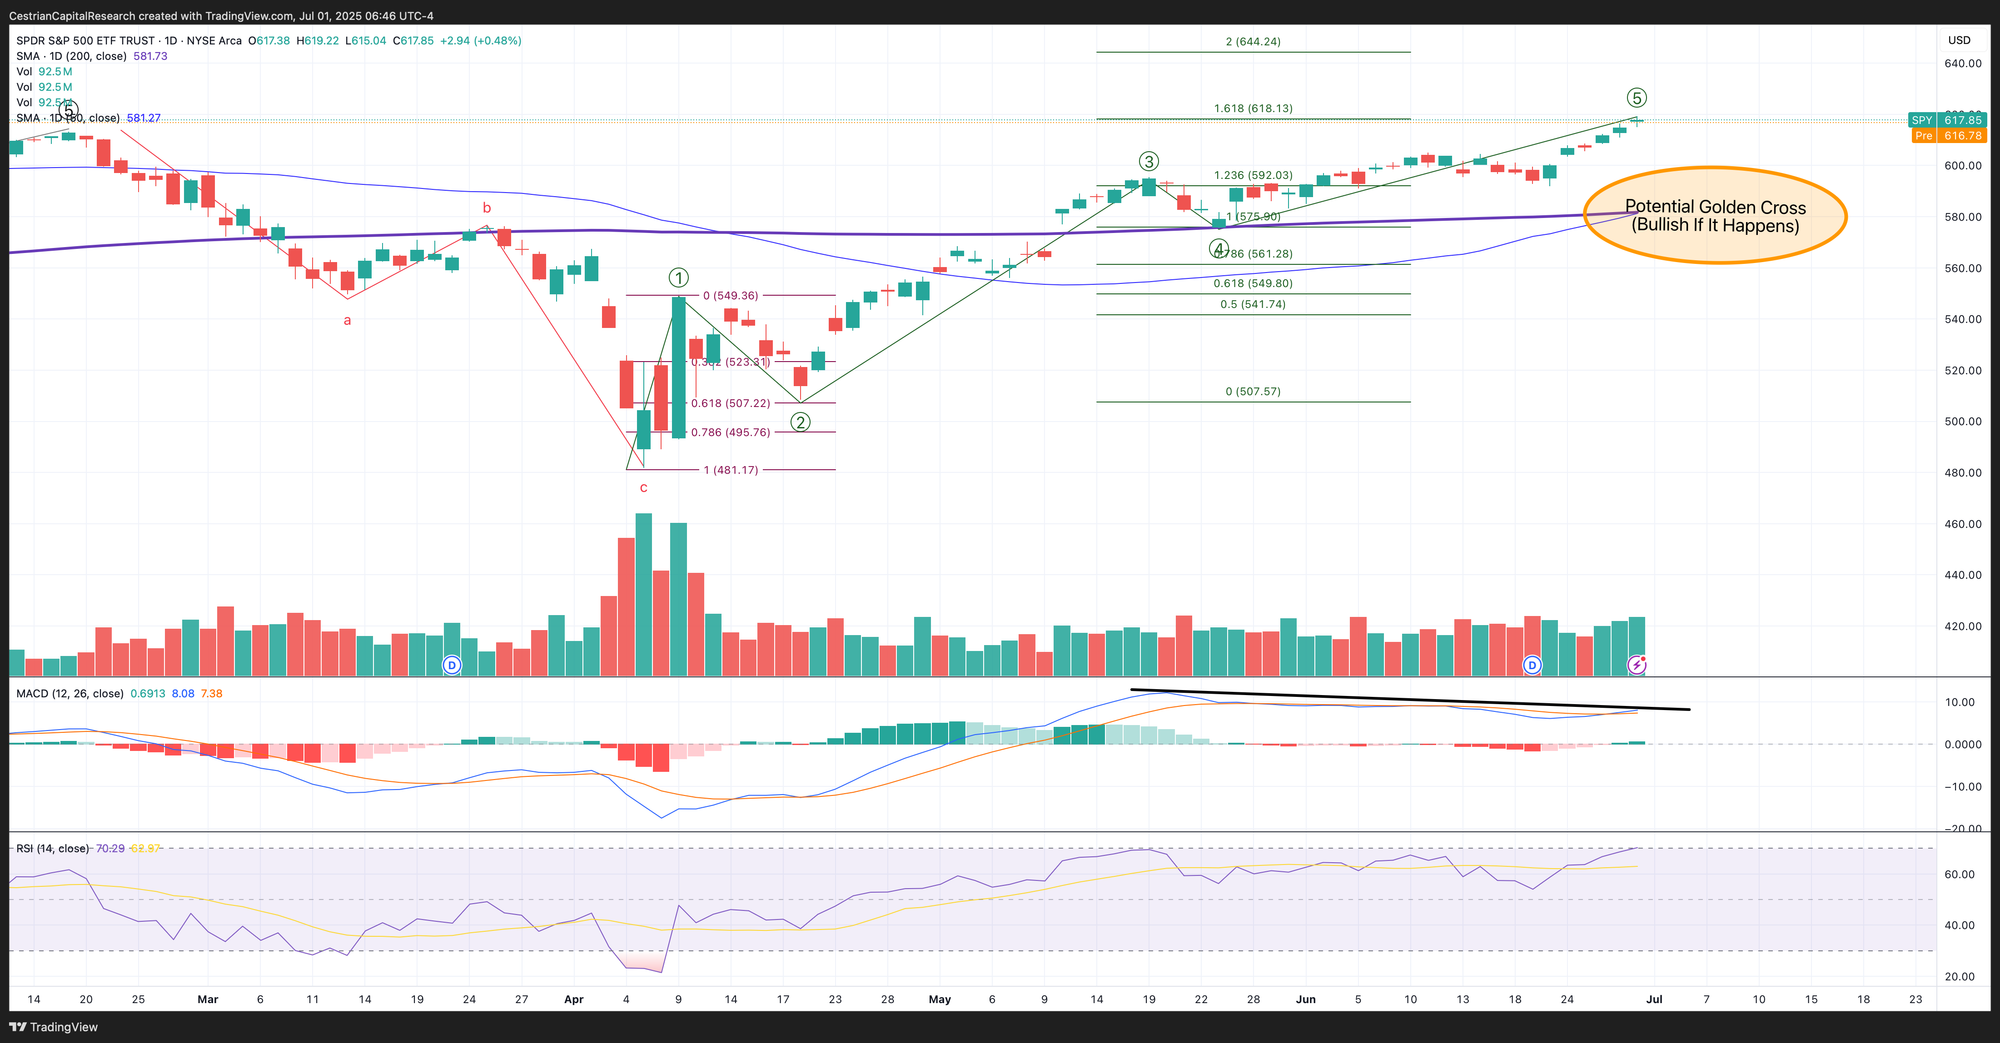
S&P500 / SPY / ES / UPRO
Remains a bullish look for the medium term.
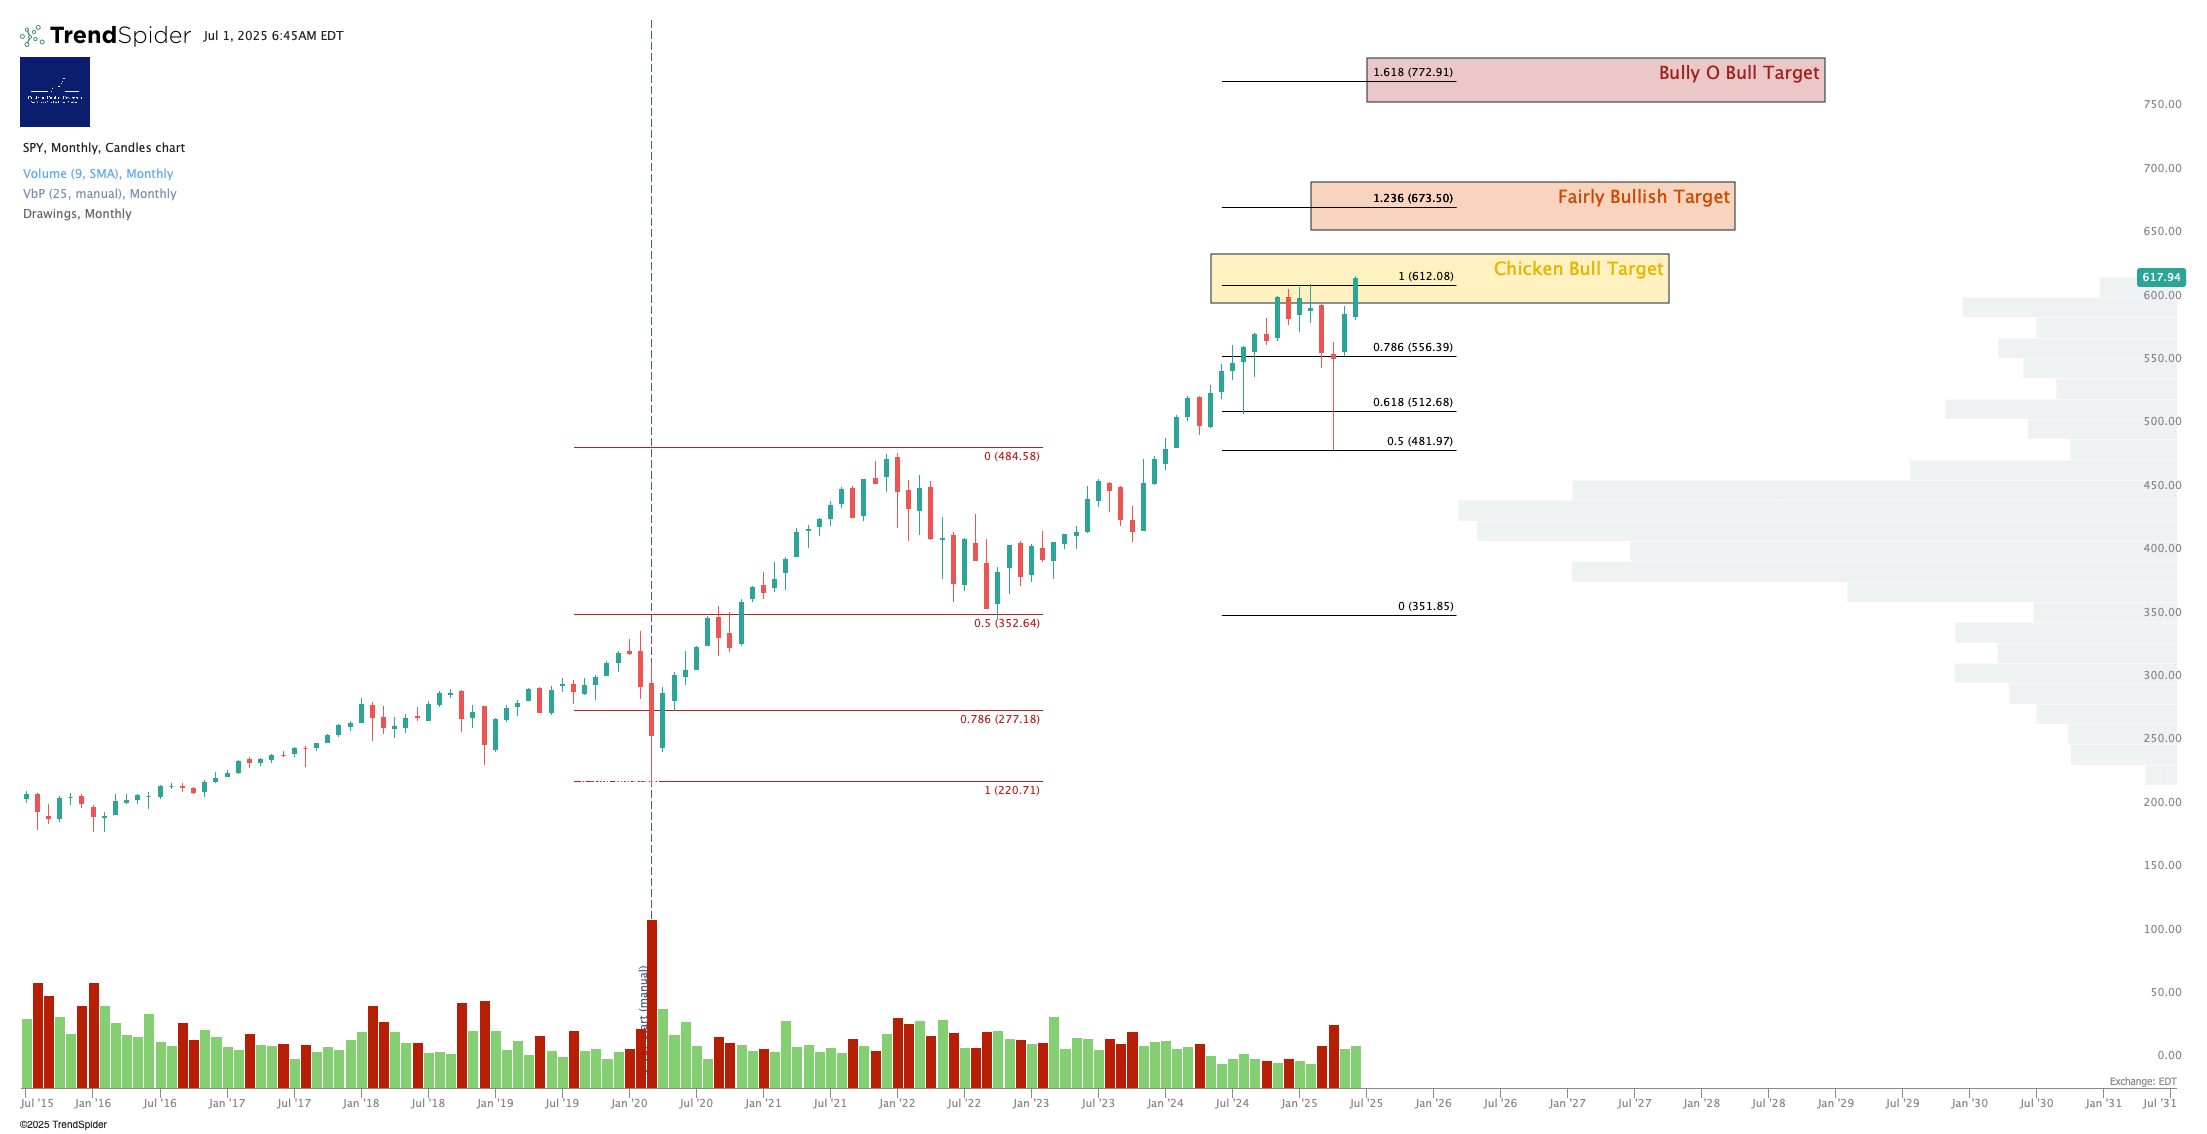
A long discussion amongst the Inner Circle community during yesterday’s webinar about what is happening near-term in the S&P and the Nasdaq. Long term bullish is fairly clear to me; short term all charts point to a correction …. which has yet to actually happen! We talked extensively about what to do in investing and trading when wrong, and how to course-correct accordingly. The recording is available now to all Inner Circle members in our Slack environment right now.

Here's my take on the short-term chart.
Note - Leveraged ETF. Read the fund documentation if you are considering using this instrument.
Another bearish-looking chart … with price continuing to rise!
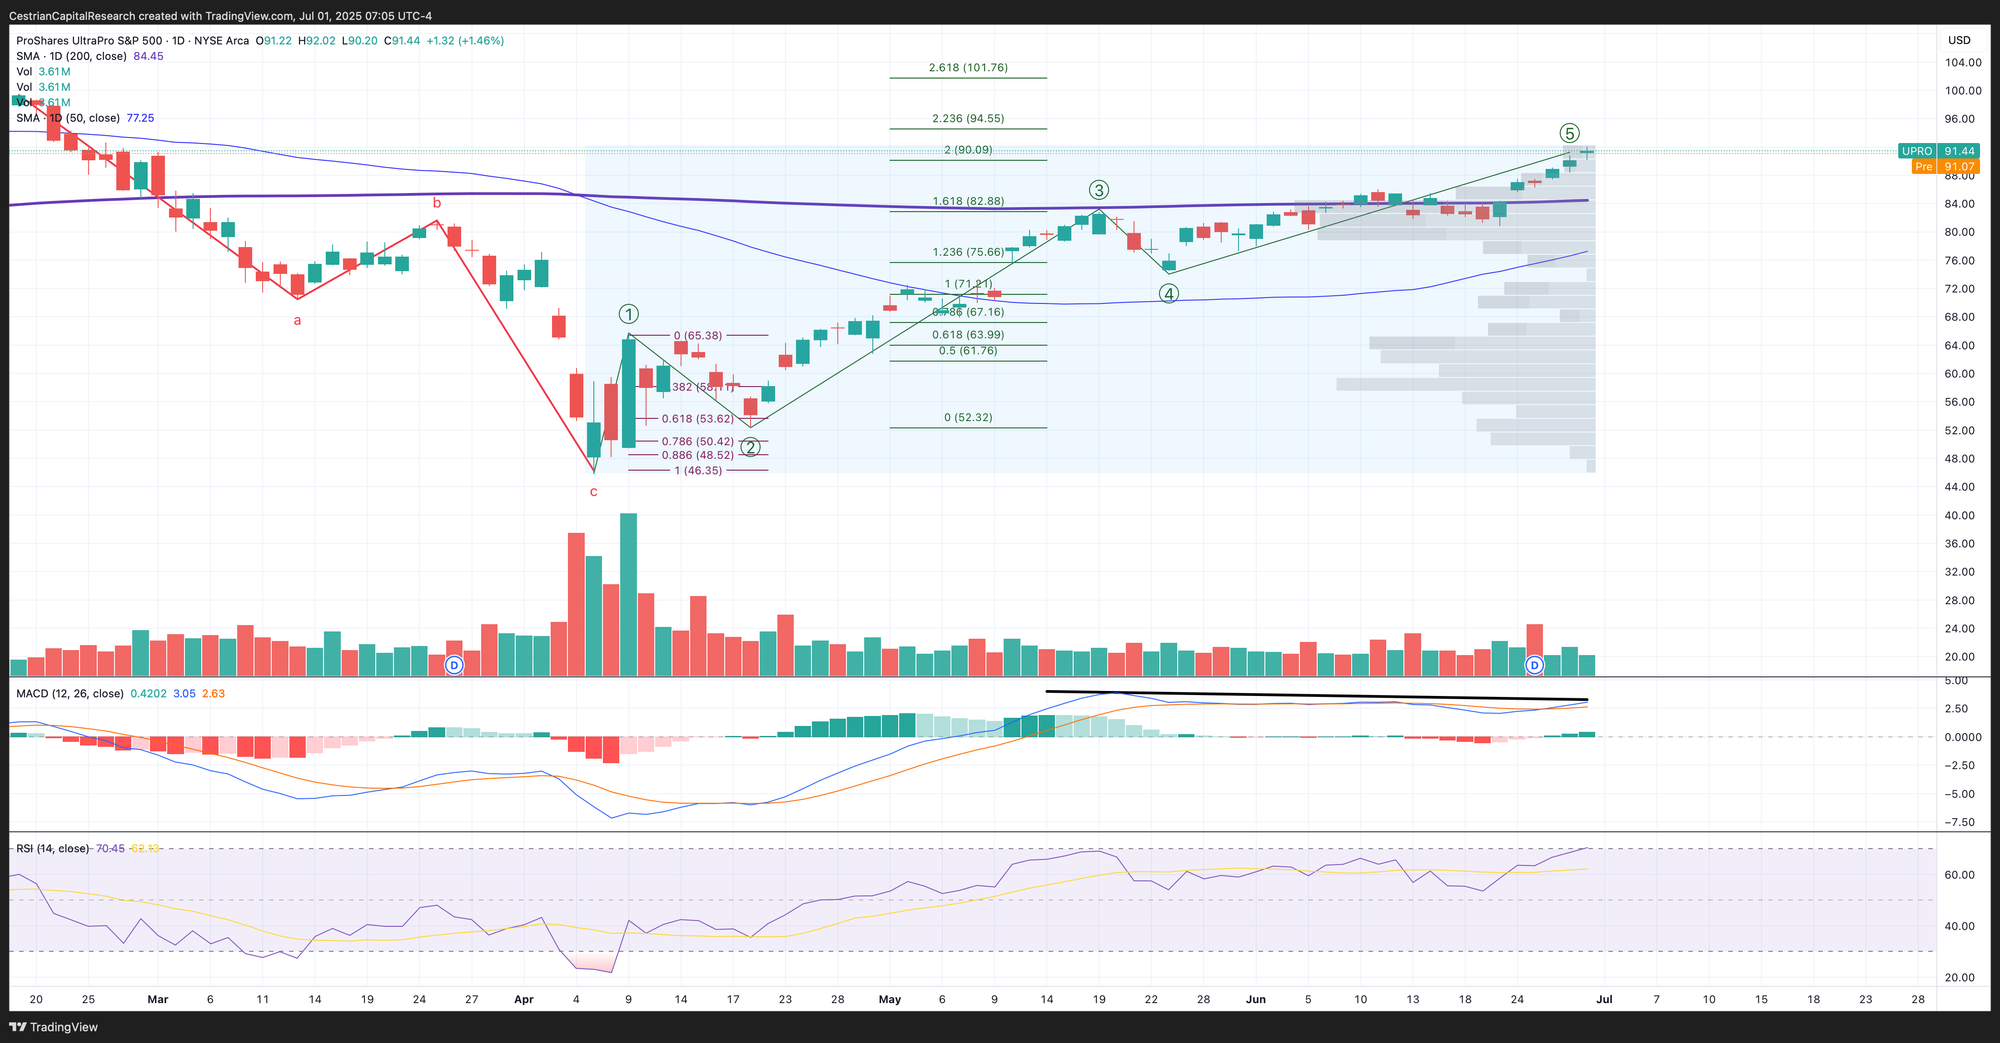
Disclosure: I am long $IUSA (EU UCITS S&P500 ETF), and long SPY puts for September expiry.
Nasdaq-100 / QQQ / NQ / TQQQ
Bullish long term …
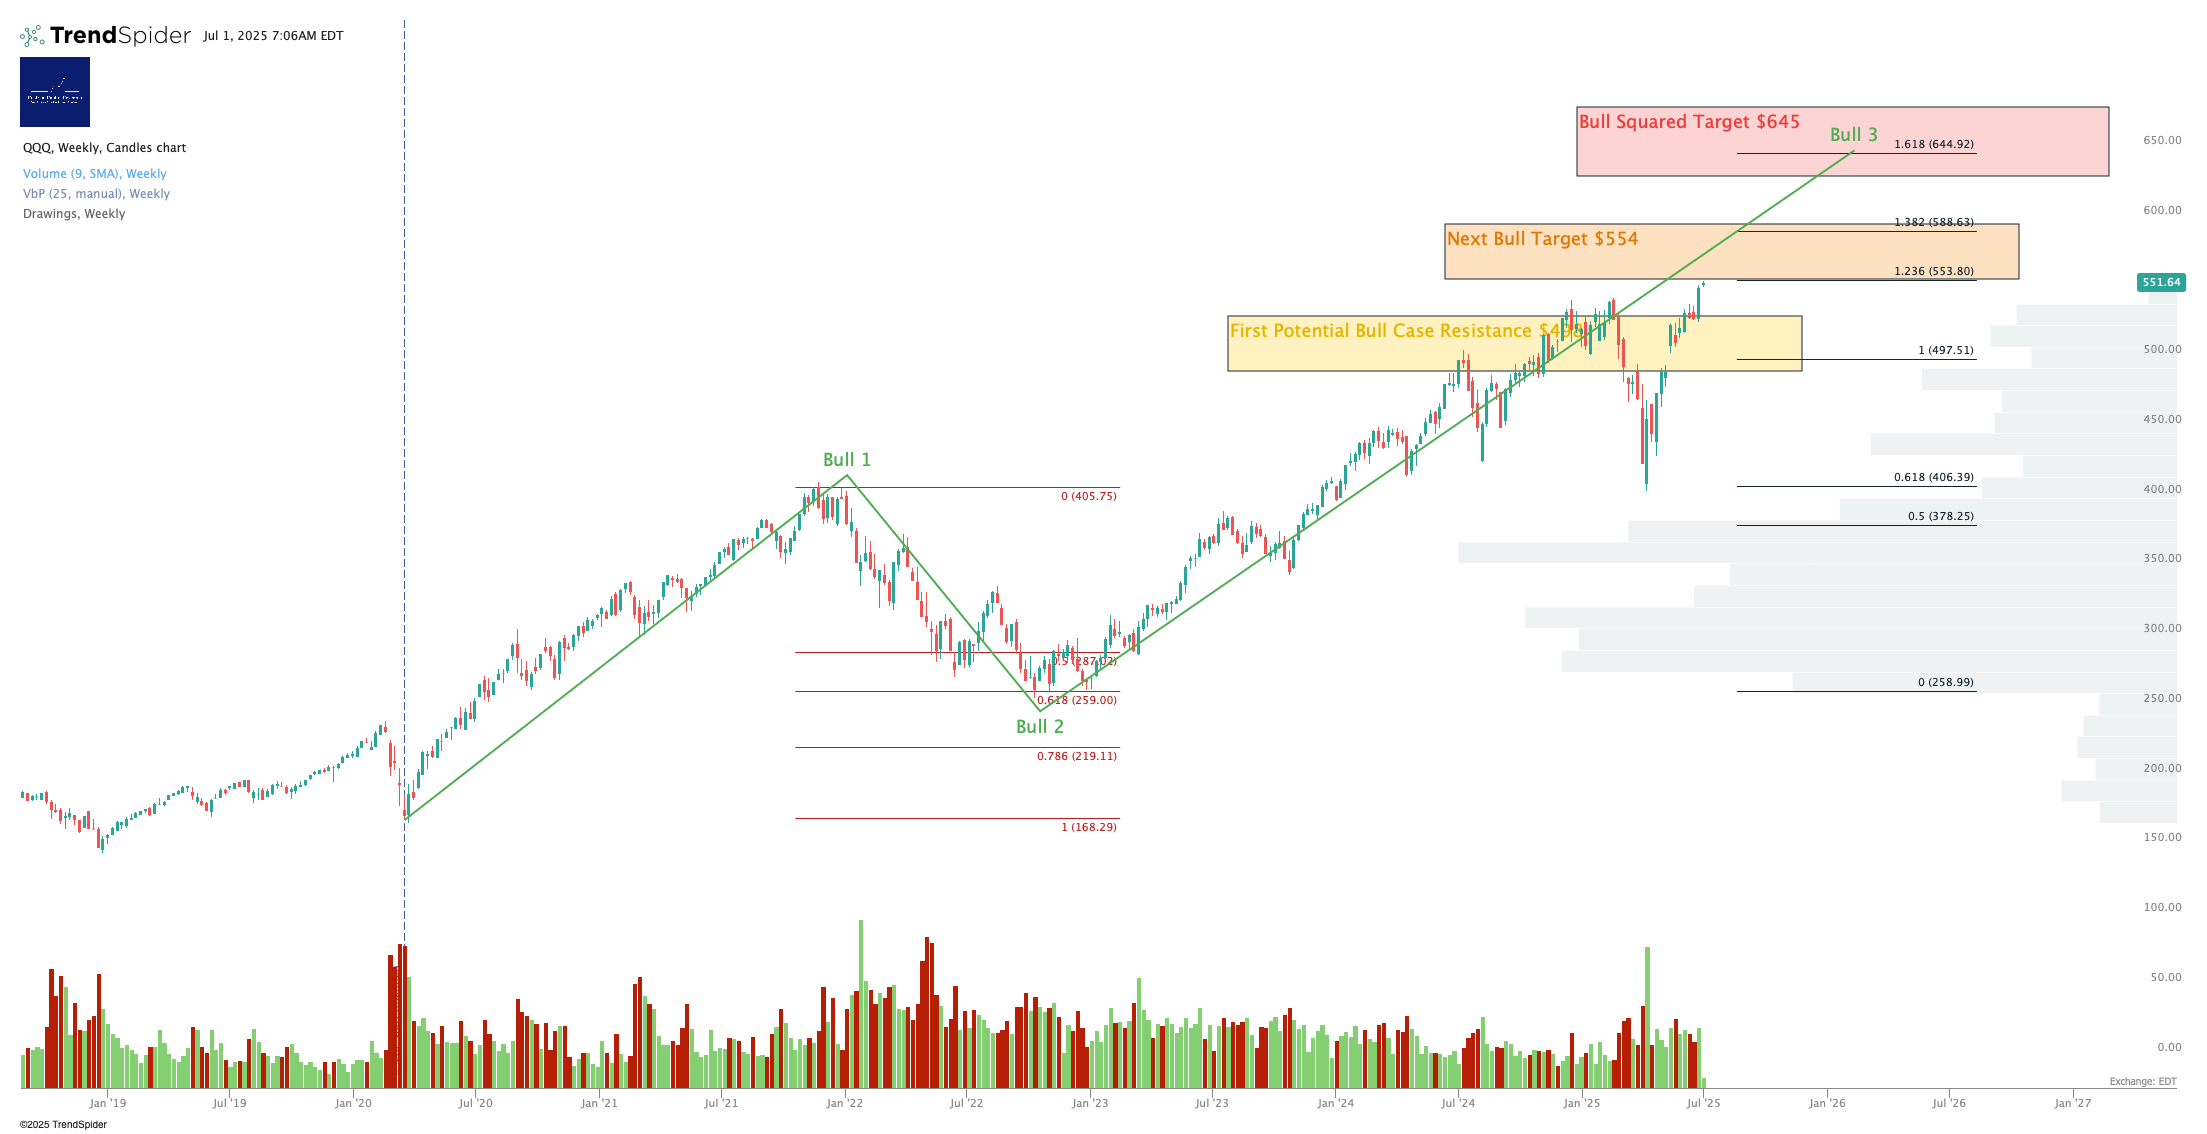
… bearish chart short term ...
… price continuing to rise.
It’s almost like this stuff is difficult.
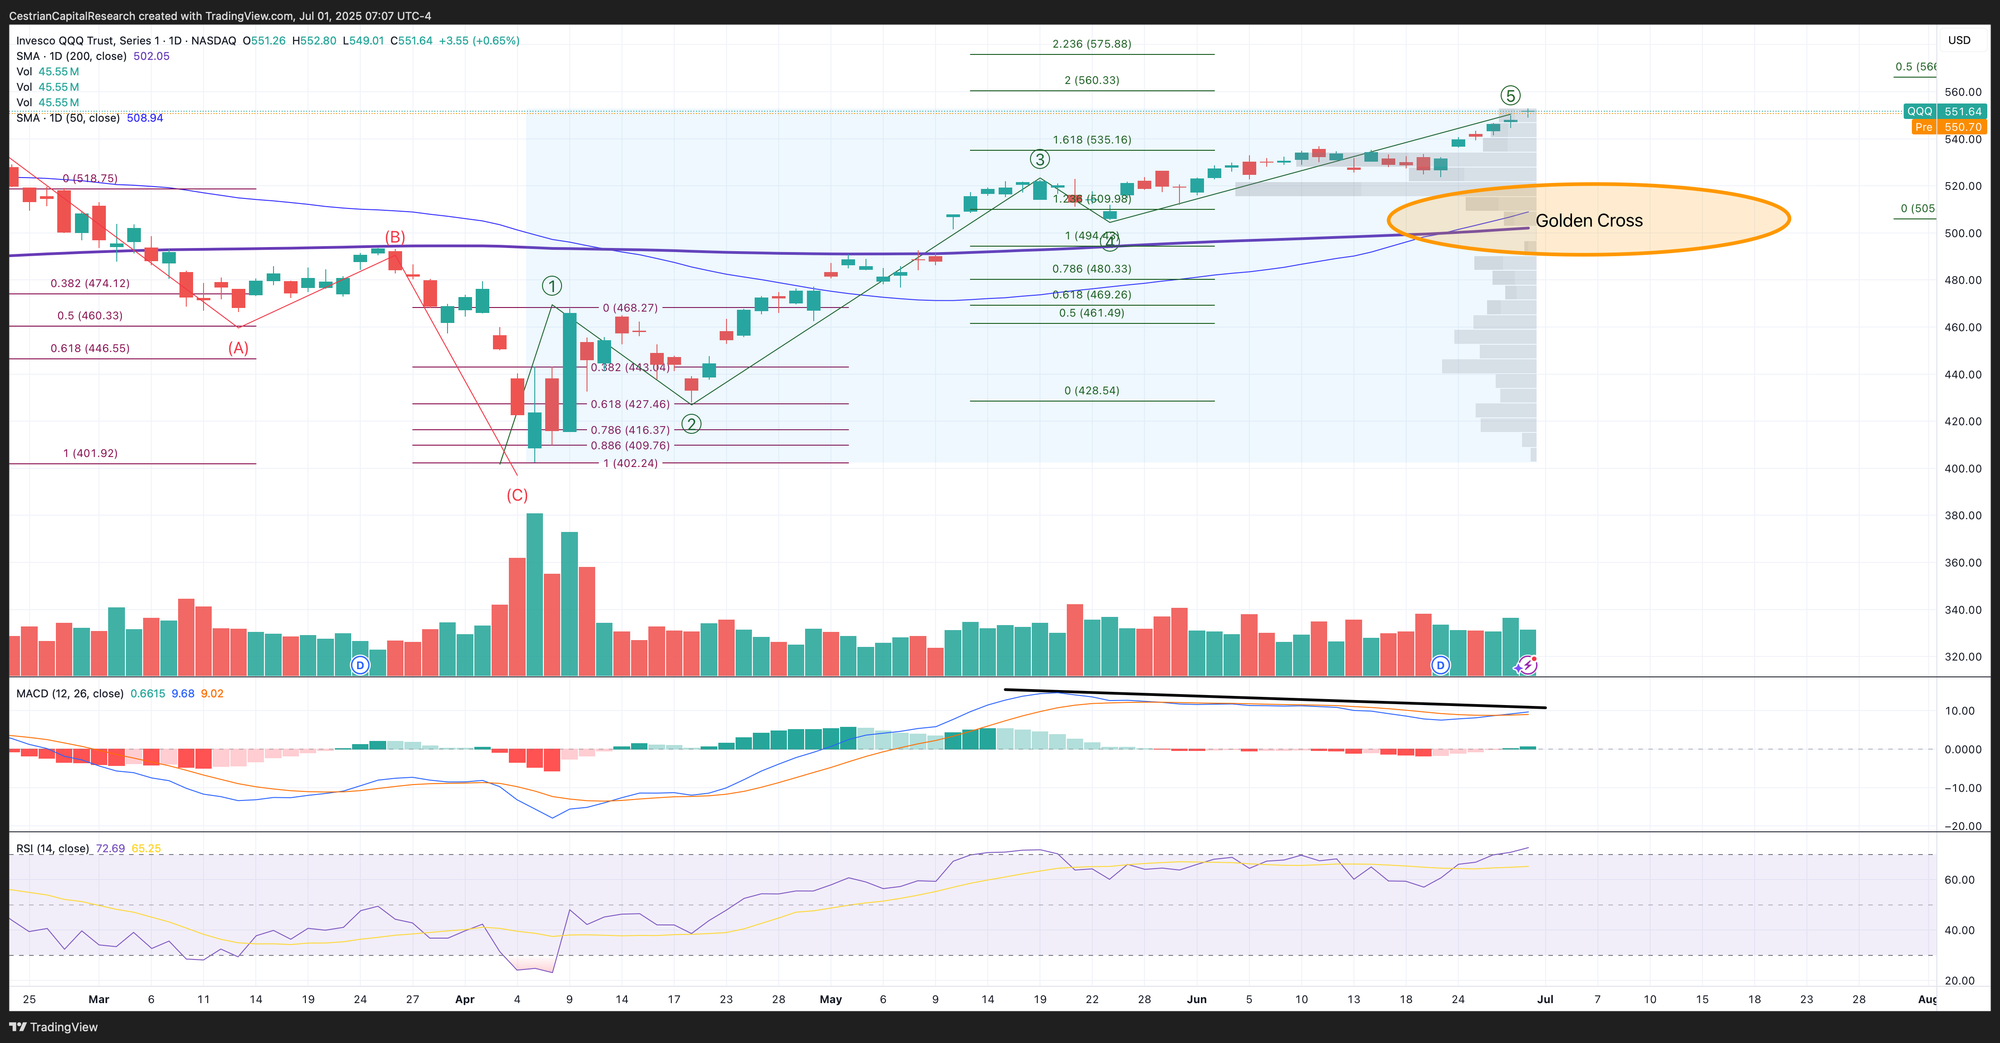
Note - Leveraged ETF. Read the fund documentation if you are considering using this instrument.
Any selloff will, I think, be provided hard support by the 50-day and maybe by the 200-day.
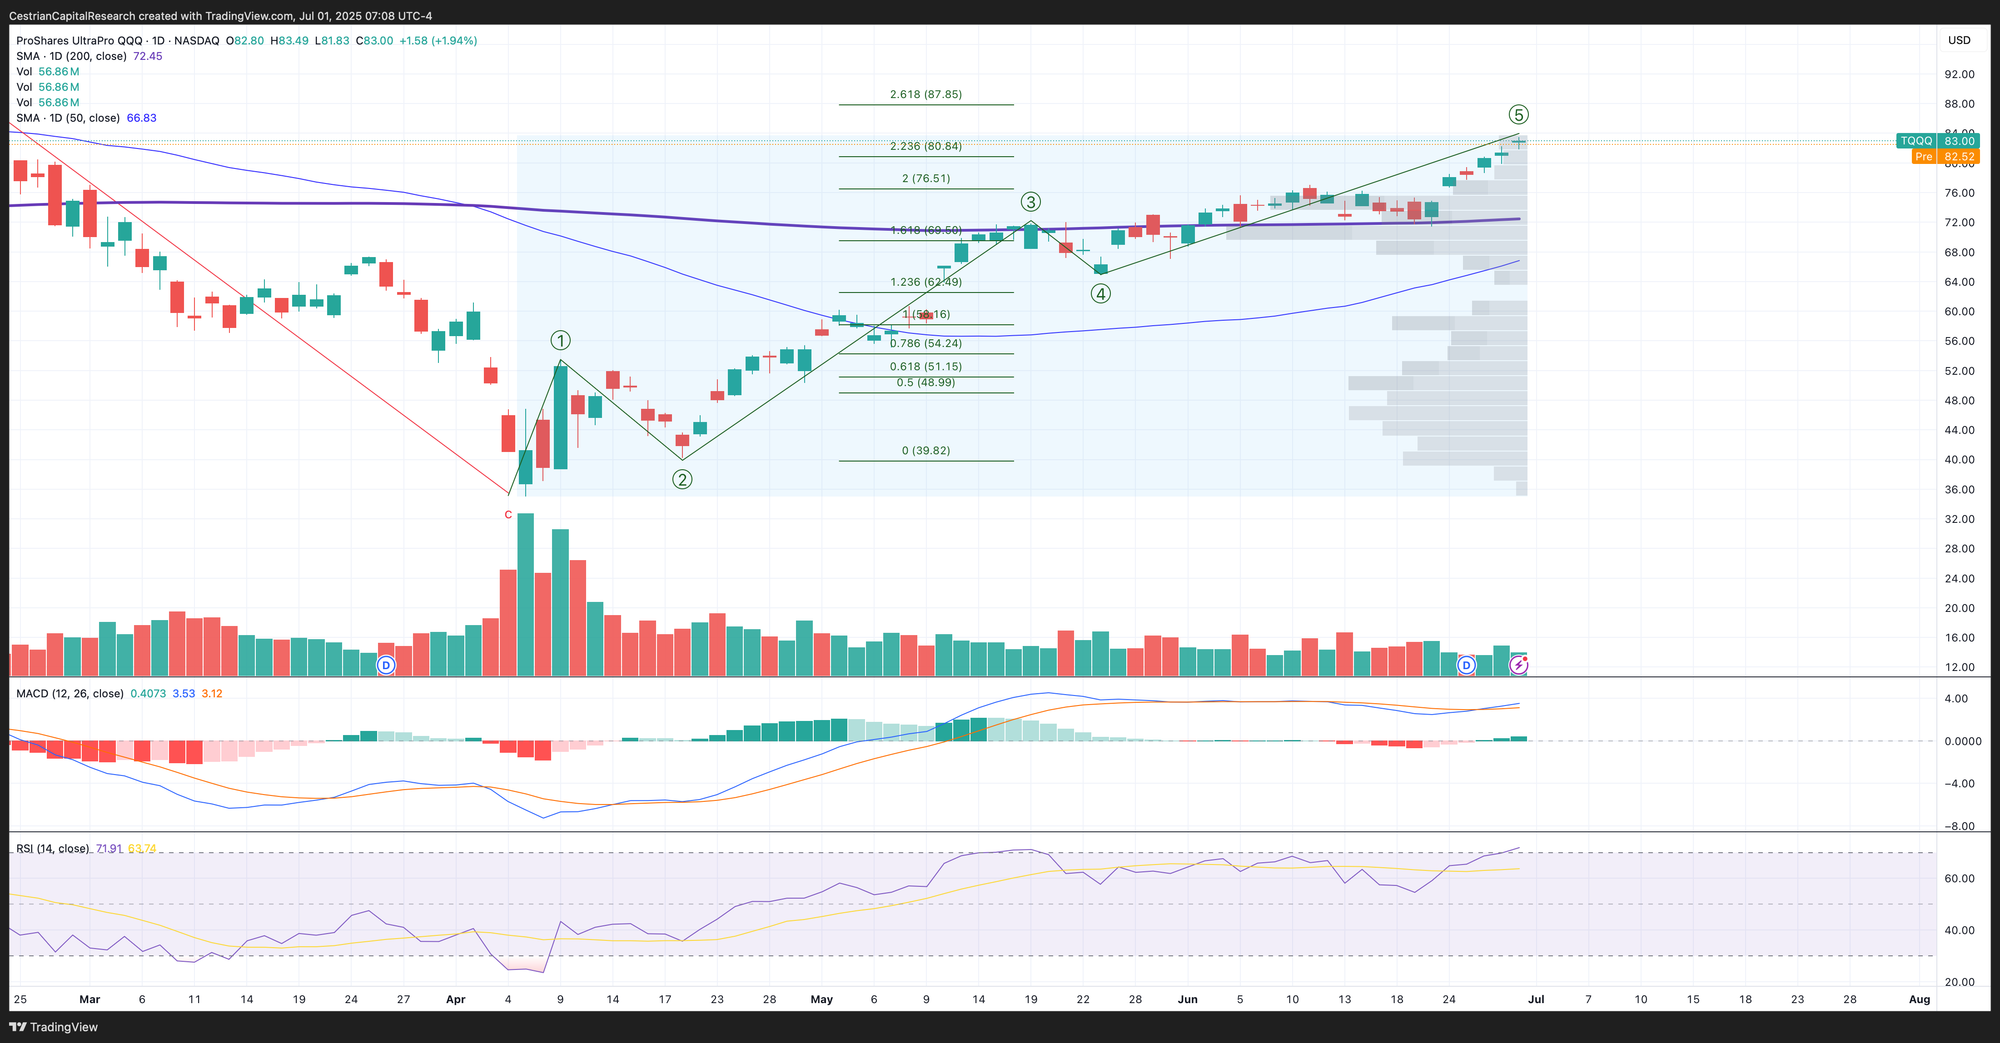
Disclosure: I am hedged 1:1 $TQQQ:$SQQQ
The full morning note, available to Inner Circle members, also includes coverage of: DIA, UDOW, XLK, TECL, SOXX, and SOXL.
Alex King, Cestrian Capital Research, Inc - 1 July 2025.
DISCLOSURE - Cestrian Capital Research, Inc staff personal accounts hold long positions in, inter alia, TQQQ, SQQQ, IUSA, TMV, SOXL, SOXS, TLT, DTLA; also long September QQQ and SPY puts.