
How We Approach US Equity Index Investing.
DISCLAIMER: This note is intended for US recipients only and, in particular, is not directed at, nor intended to be relied upon by any UK recipients. Any information or analysis in this note is not an offer to sell or the solicitation of an offer to buy any securities. Nothing in this note is intended to be investment advice and nor should it be relied upon to make investment decisions. Cestrian Capital Research, Inc., its employees, agents or affiliates, including the author of this note, or related persons, may have a position in any stocks, security, or financial instrument referenced in this note. Any opinions, analyses, or probabilities expressed in this note are those of the author as of the note's date of publication and are subject to change without notice. Companies referenced in this note or their employees or affiliates may be customers of Cestrian Capital Research, Inc. Cestrian Capital Research, Inc. values both its independence and transparency and does not believe that this presents a material potential conflict of interest or impacts the content of its research or publications.
Equity Index Trading - Your Choice Of Timeframe, Your Choice Of Risk Level.
For all our subscribers, free and paying, we set out here the method by which we approach US equity indices in staff personal accounts. As regards putting this strategy into practice? Paying subscribers receive (i) daily notes that detail live trading opportunities and (ii) real-time trade disclosure alerts whenever Cestrian staff personal accounts are about to place trades in US index positions.
This method can be used by anyone who has the ability to trade US equity index ETFs. You can use our charts to assist should you wish to trade the indices using options or futures, but we take no account of expiry dates, contract types and so forth. That will be for you to calculate.
Our index trading method assumes that:
- The very-long-term direction of US equity indices is up; that is based on the entire history of the indices. Each new high is in the end made redundant as another all-time new high is struck.
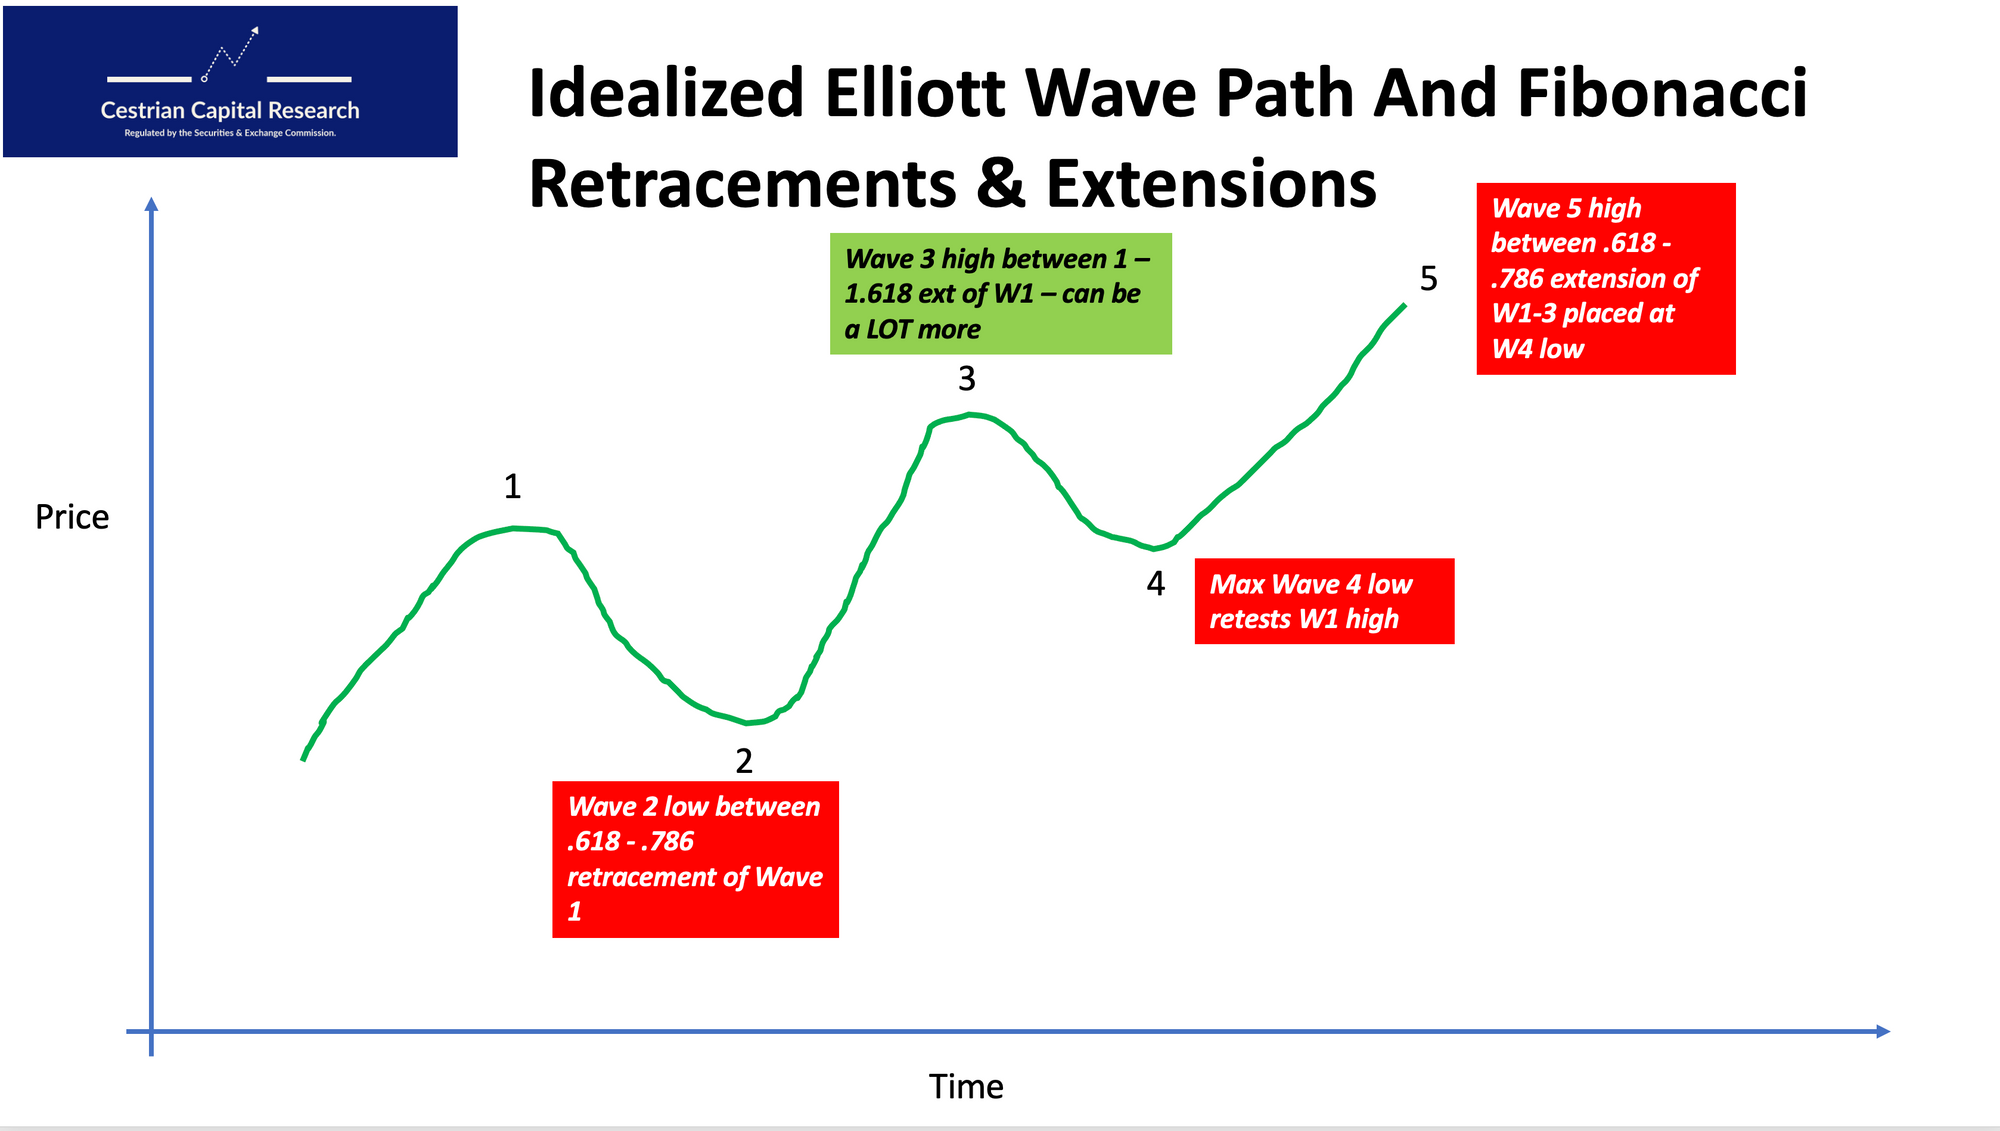
- The medium-term direction of US equity indices changes course every 1-3 years by and large. We use Elliott Wave analysis to help us predict and track reversals, and we use Fibonacci extensions and retracements to measure the amplitude of those waves and therefore the probability of pending reversal.
- The short-term direction of US equity indices is chaotic although its twists and turns can be measured and predicted to a degree.
- And finally our key assumption is - very often all equity index analysis is wrong, and the market moves in a direction that the analyst and/or trader was simply not expecting.
We use this method for all four principal US equity indices - the S&P500, the Nasdaq-100, the Dow Jones 30, and the Russell 2000. The method can be used for leveraged (2x daily, 3x daily) or unlevered (simple index tracker) ETFs. Such instruments include:
- S&P500: Unlevered - SPY (long), SH (short); 2x - SSO (long), SDS (short); 3x - UPRO (long), SPXU (short).
- Nasdaq-100: Unlevered - QQQ (long), PSQ (short); 2x - QLD (long), QID (short); 3x - TQQQ (long), SQQQ (short).
- Dow Jones: Unlevered - DIA (long), DOG (short); 2x - DDM (long), DXD (short); 3x - UDOW (long), SDOW (short).
- Russell 2000: Unlevered - IWM (long), RWM (short); 2x - UWM (long), TWM (short); 3x - TNA (long), TZA (short).
Whether you use unlevered, 2x or 3x instruments comes down to your own risk appetite.
Here's how we work.
First, we track the evolution of Elliott Waves in the market path; the example below is a bullish move up).
Next we try to identify and time opportunities to enter a long position (the example below is a 3x Nasdaq ETF trading plan), and when a short-term move down happens, to enter a short position to be held at the same time as the long; then to sell the short position and to re-invest realized short gains into additional long positions.
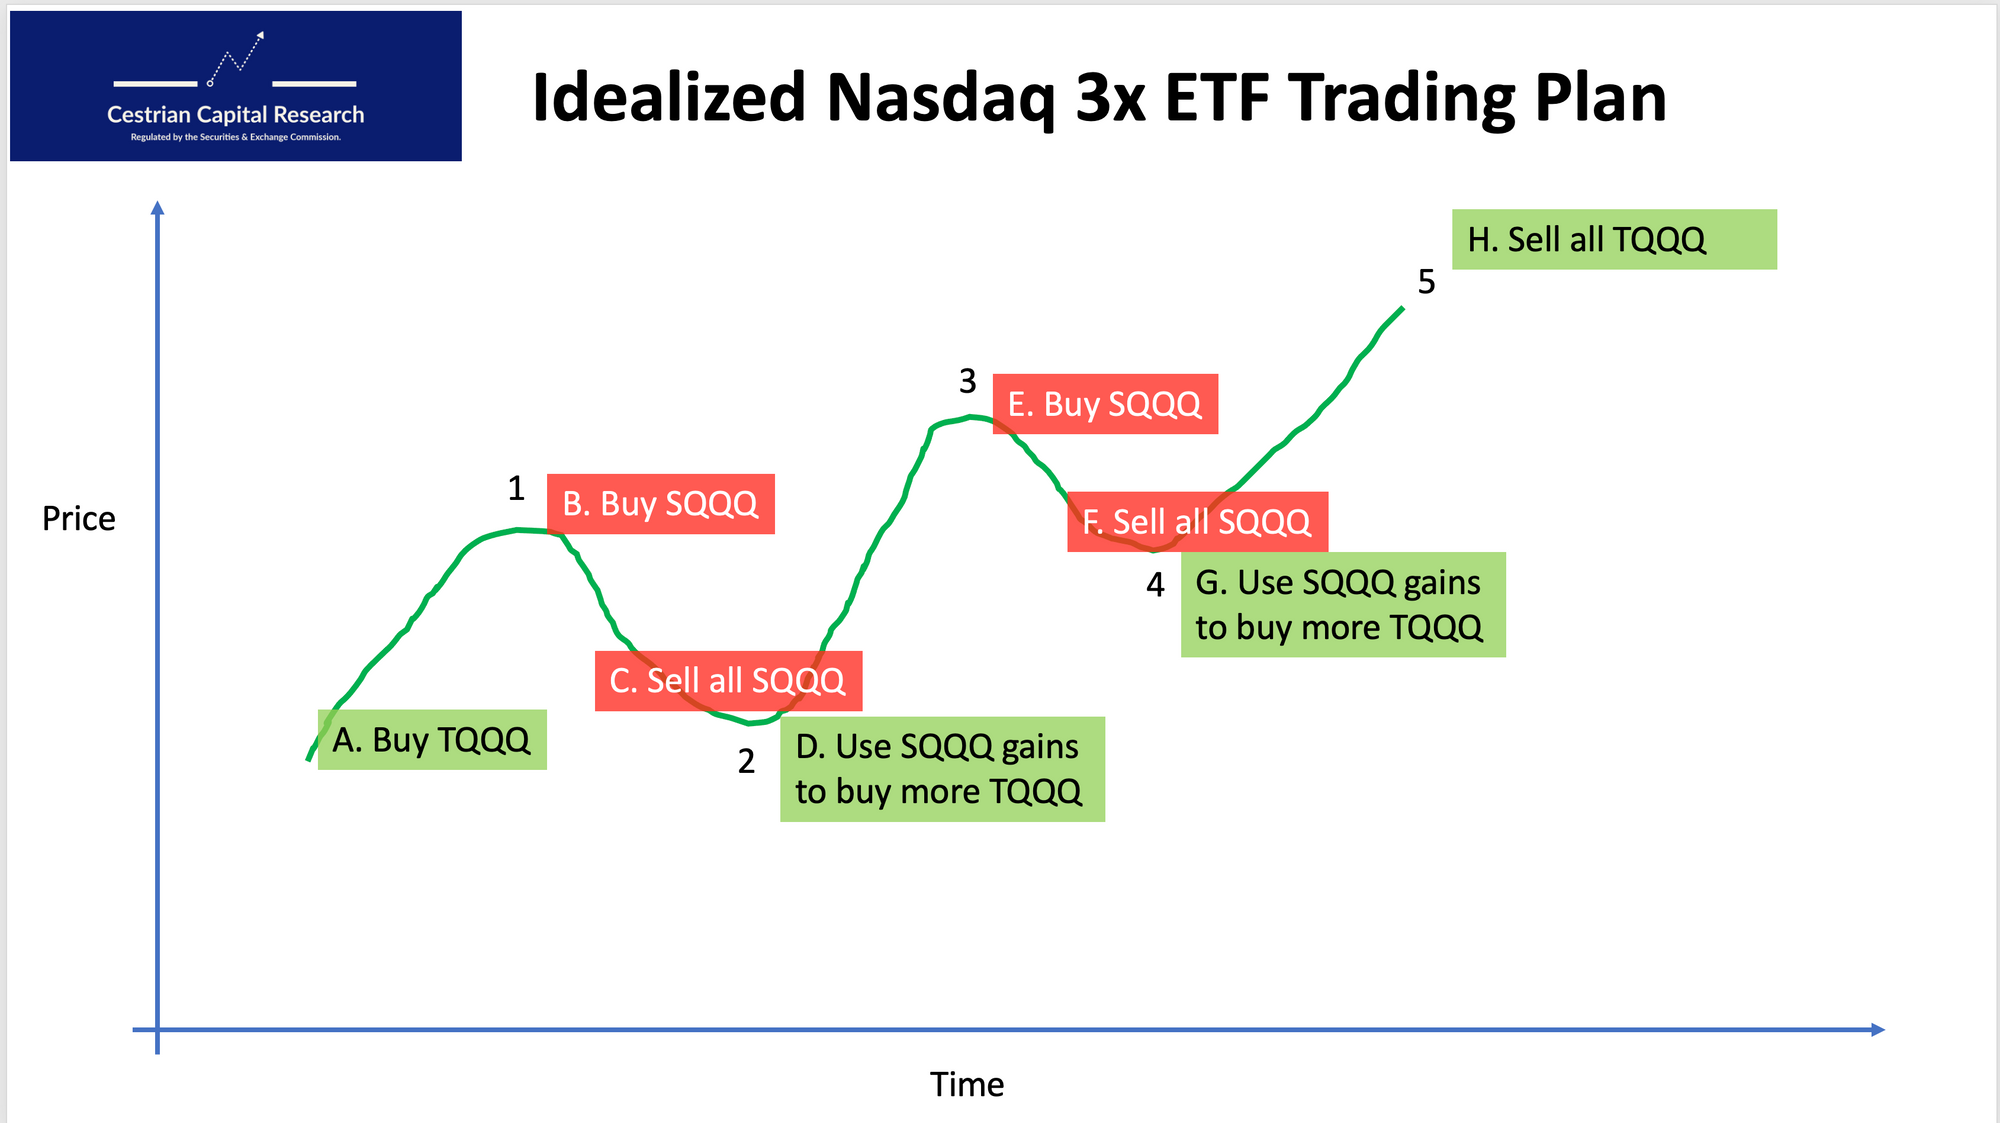
Our charts - published at least daily - help our subscribers to time their entries and exits in US equity index positions. Subscribers can either:
- Just try to invest in the longer term trend - in the example above, buy $TQQQ at the start of the cycle and sell it at the end, or
- Use the inverse ETFs to try to achieve additional gains from the down moves in order to generate profits than be used to buy additional long positions within an overall longer-term up move.
We discuss this method all the time in our live weekly webinars, in our real-time 24/7 members-only chatroom, and in our daily market update notes.
Become a paying Inner Circle member today if you'd like to join us as we continue to use this strategy in each of the four US equity indices. The method can be used profitably whether you have a full time job and are only available for short periods through the week when the markets are closed; or whether you spend all your time at your brokerage screen.
Alex King - CEO, Cestrian Capital Research, Inc - 17 September 2023.