
Iridium Q4 FY12/23 Earnings Review

DISCLAIMER: This note is intended for US recipients only and, in particular, is not directed at, nor intended to be relied upon by any UK recipients. Any information or analysis in this note is not an offer to sell or the solicitation of an offer to buy any securities. Nothing in this note is intended to be investment advice and nor should it be relied upon to make investment decisions. Cestrian Capital Research, Inc., its employees, agents or affiliates, including the author of this note, or related persons, may have a position in any stocks, security, or financial instrument referenced in this note. Any opinions, analyses, or probabilities expressed in this note are those of the author as of the note's date of publication and are subject to change without notice. Companies referenced in this note or their employees or affiliates may be customers of Cestrian Capital Research, Inc. Cestrian Capital Research, Inc. values both its independence and transparency and does not believe that this presents a material potential conflict of interest or impacts the content of its research or publications.
Larger Degree .786 In View
by Alex King
Iridium Communications ($IRDM) is an admirably simple business. It operates a constellation of low-earth-orbit communication satellites, which predates the Starlink or Kuiper systems. The constellation can support voice and low-bit-rate broadband. Customer segments include remote workers (think research scientists at McMurdo Station) and maritime (be that commercial freight or large leisure yacht).
We became bullish on Iridium around 2019 when the company passed peak capex and peak leverage (both driven by deployment of a then-new generation of satellites). The stock has been very good to me personally over a number of holding periods. Most recently I accumulated a position in 2021 which I then sold in 2022. This predates this Inner Circle service but here are the trade disclosures from our Growth Investor Pro service.
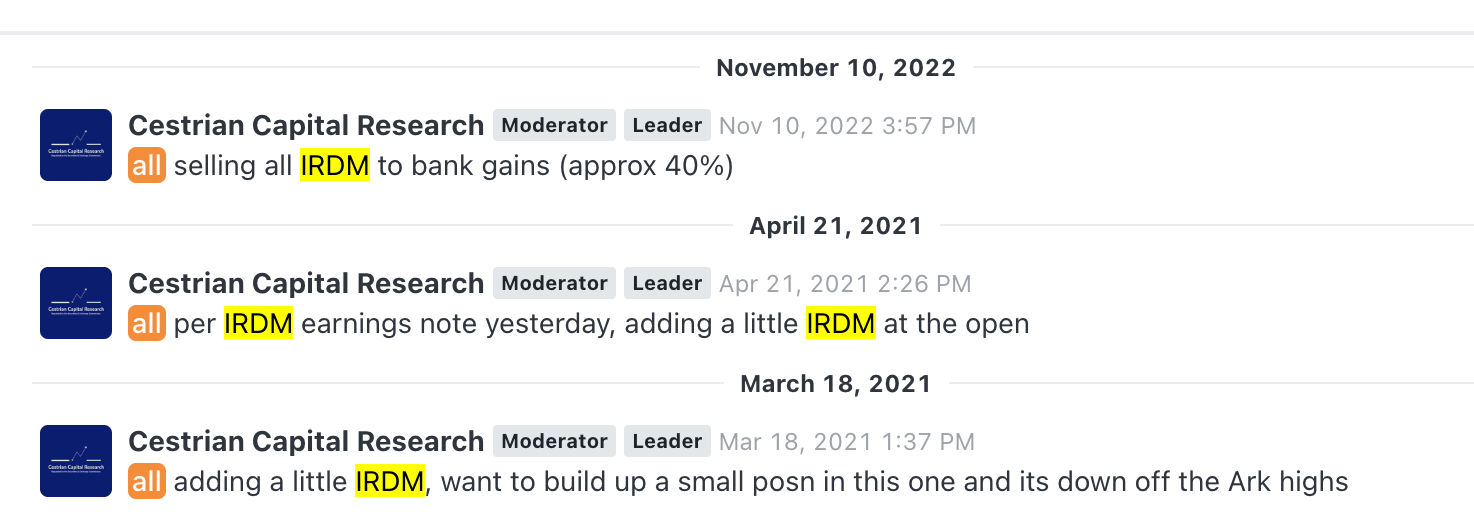
We moved to rate IRDM at 'Distribute' in the $60-68/share range during 2022/23 and then as the stock fell below that range, we moved to 'Do Nothing' rating. The stock closed Friday at $29.70. We remain at 'Do Nothing', as the lows don't yet seem to be in.
We'll get to those charts below, where we speculate where support may lie, but for now, here’s the headline numbers as of this quarter.
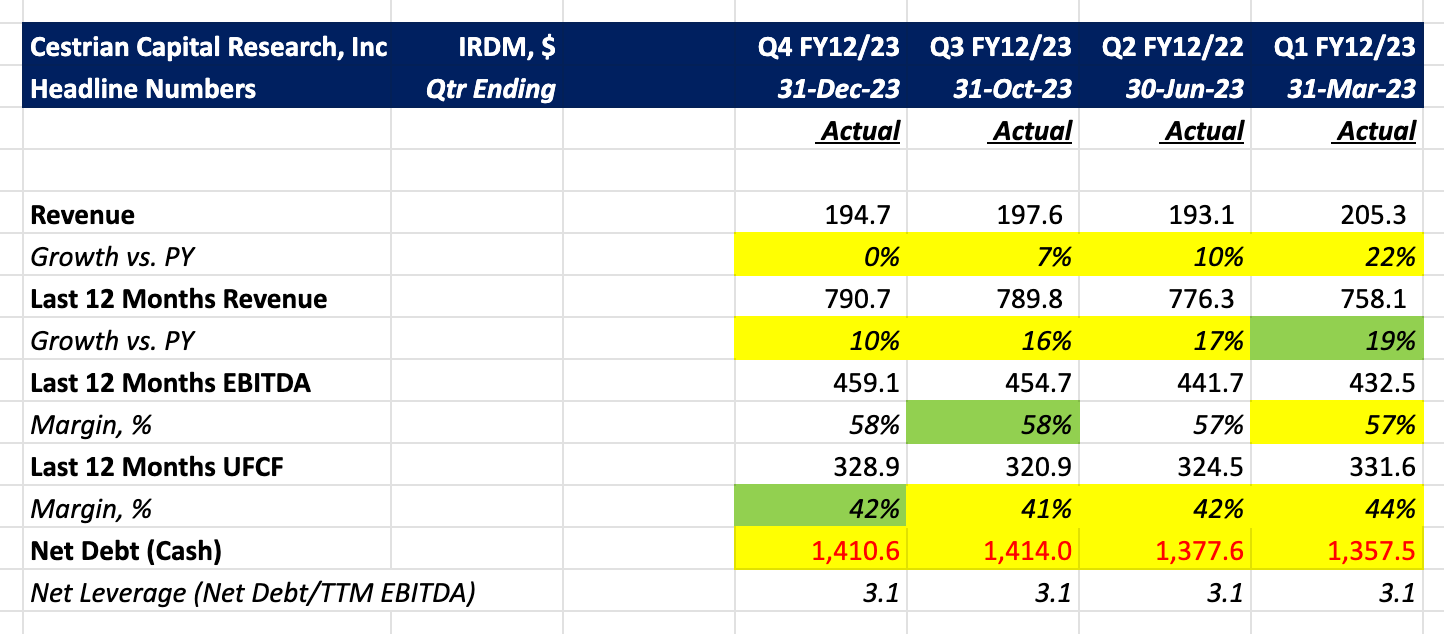
In short, on fundamentals, the company looks challenged.
- Revenue growth is decelerating at some pace; now flat vs the same quarter last year.
- TTM EBITDA margins and TTM UFCF margins (ask if you don't know what these are or why they matter) are both flat for the last four quarters.
- Net debt is worsening a little despite the significant unlevered pretax free cashflow generation; that's because the company is using leverage to pay for dividends and share buybacks.
- Net leverage is flat at 3.1x TTM EBITDA, though the company is guiding to this falling in the coming year. Again, if levered buybacks and so forth is unfamiliar to you, ask us.
Let's turn to the stock price outlook, more detailed financials, valuation analysis, and our rating.
Read on!
Technical Analysis
Here's how I see the stock longer term. You can open a full page version of this chart, here.
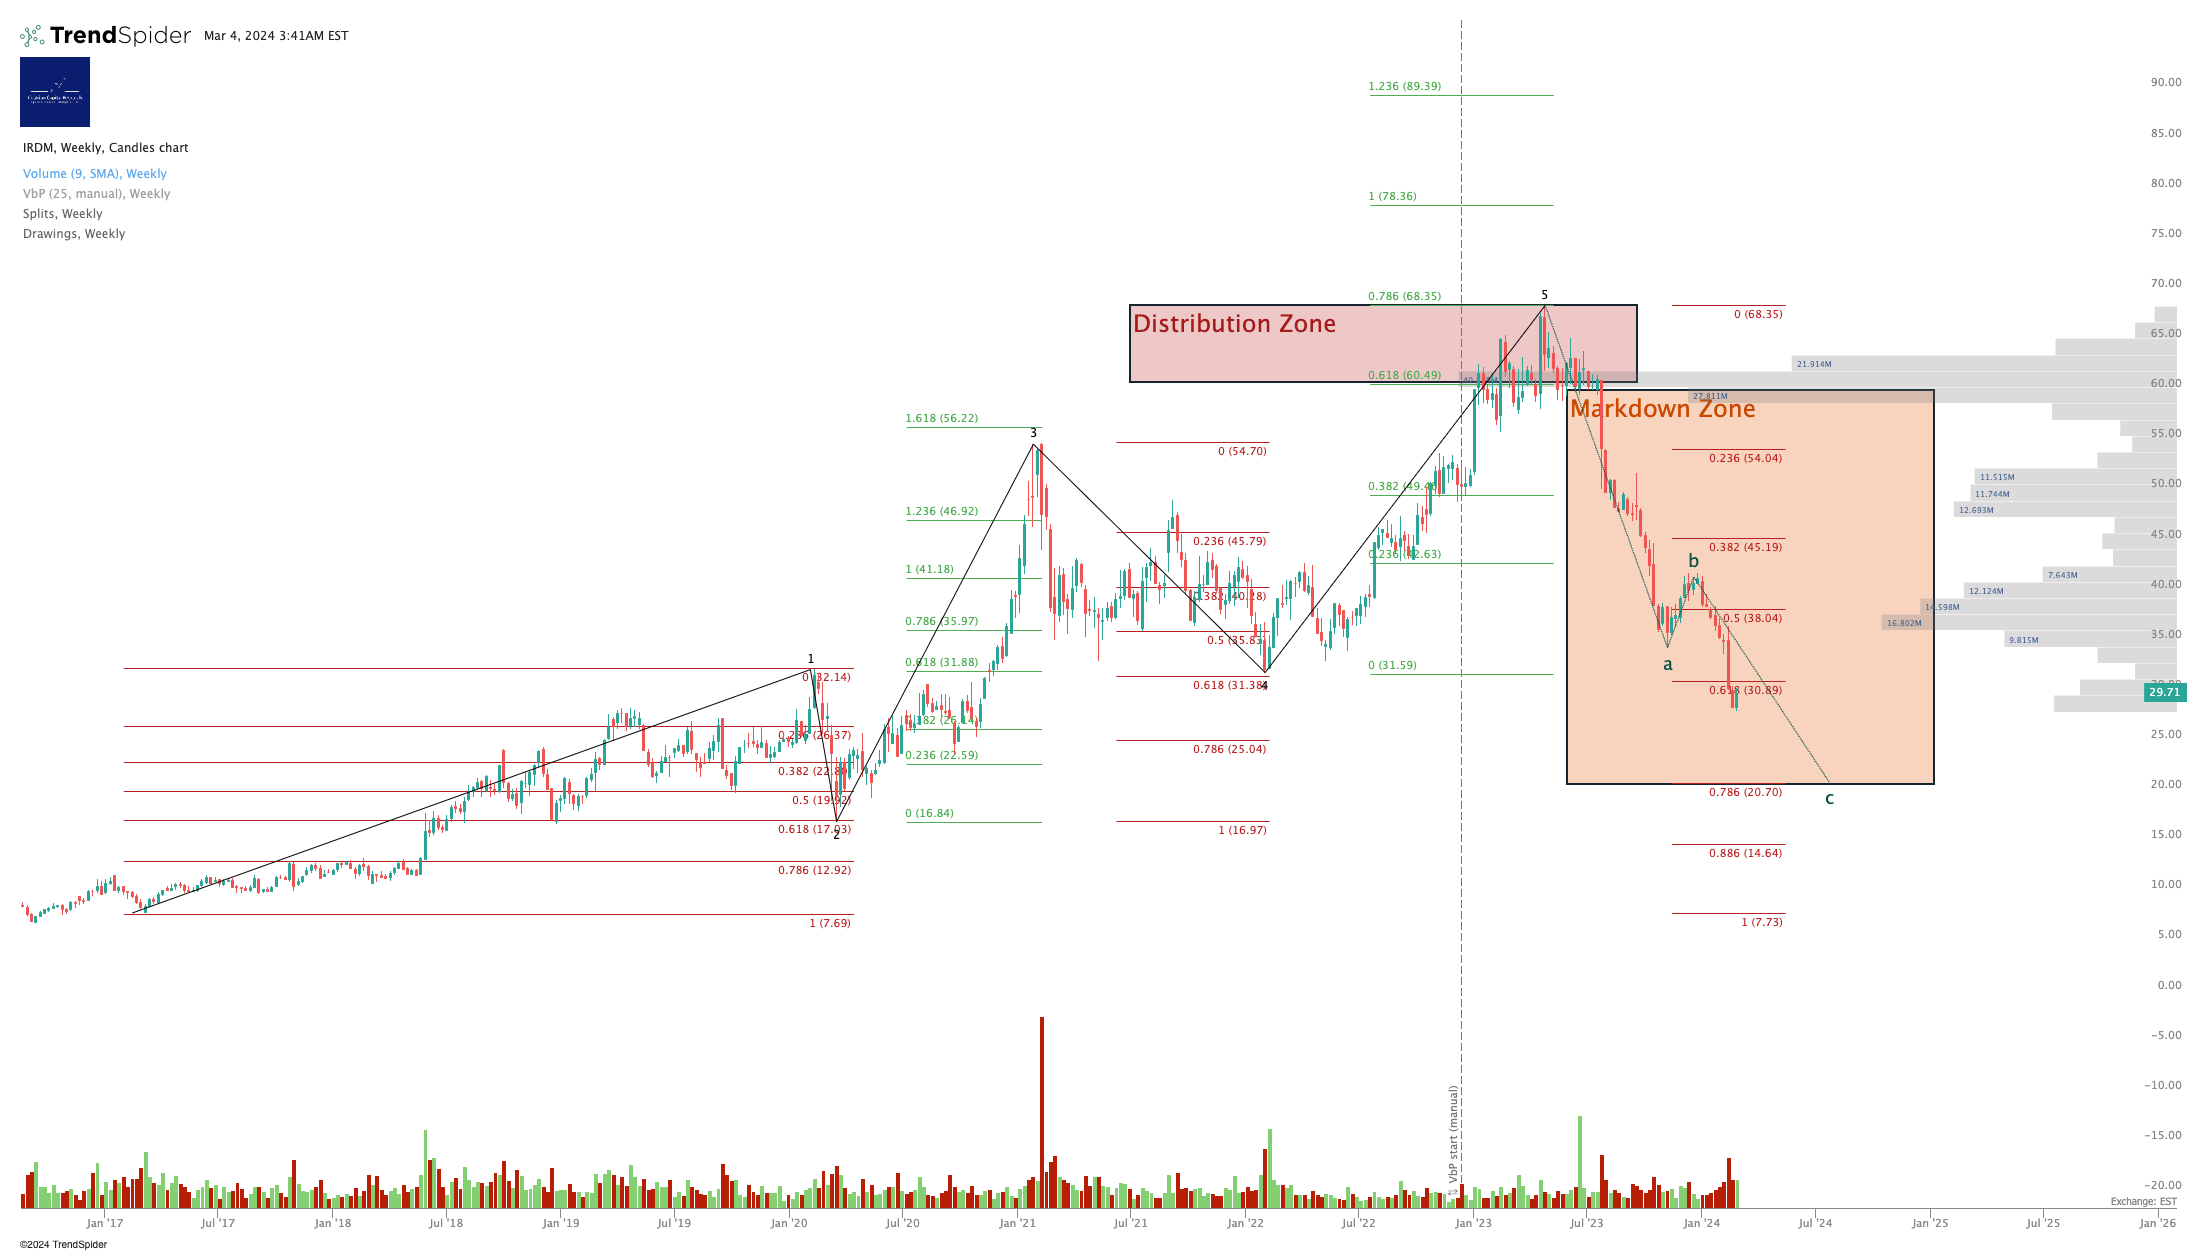
This is a technically beautiful chart. The distribution zone played out perfectly, with high volume x price nodes as the stock hit the .618 - .786 extension of the prior Wave 1-3 placed at the Wave 4 low. That's a typical Wave 5 termination zone. The stock then goes into freefall - because institutions look to have completed their sell run and there is no volume demand from buyers, so lower volume sells have a big negative impact on the price. The A-B-C correction pattern is currently underway - a smaller B wave countertrend rally than I personally expected. Now in the C-leg down. Where will this end? Well, nobody knows, obviously but a logical place to look for support would be at around $20-21/share, which is the .786 retrace of the whole move up from the 2017 lows to the 2022 highs. Think that's too brutal a correction, $68-20? That's exactly the magnitude of correction that hit META and NVDA and CRM and others in 2022. Actually, CRM was worse than that. This kind of correction at the end of a 5-wave impulse cycle is more common than you might think.
The big question is - is IRDM a buy at those levels? And the answer for me is, does IRDM have an answer to newer LEO competitors, or not. This remains to be seen, in my mind at least.
Let’s take a look at the detailed numbers.
Fundamental Analysis
Here's our detailed take on Iridium fundamentals.
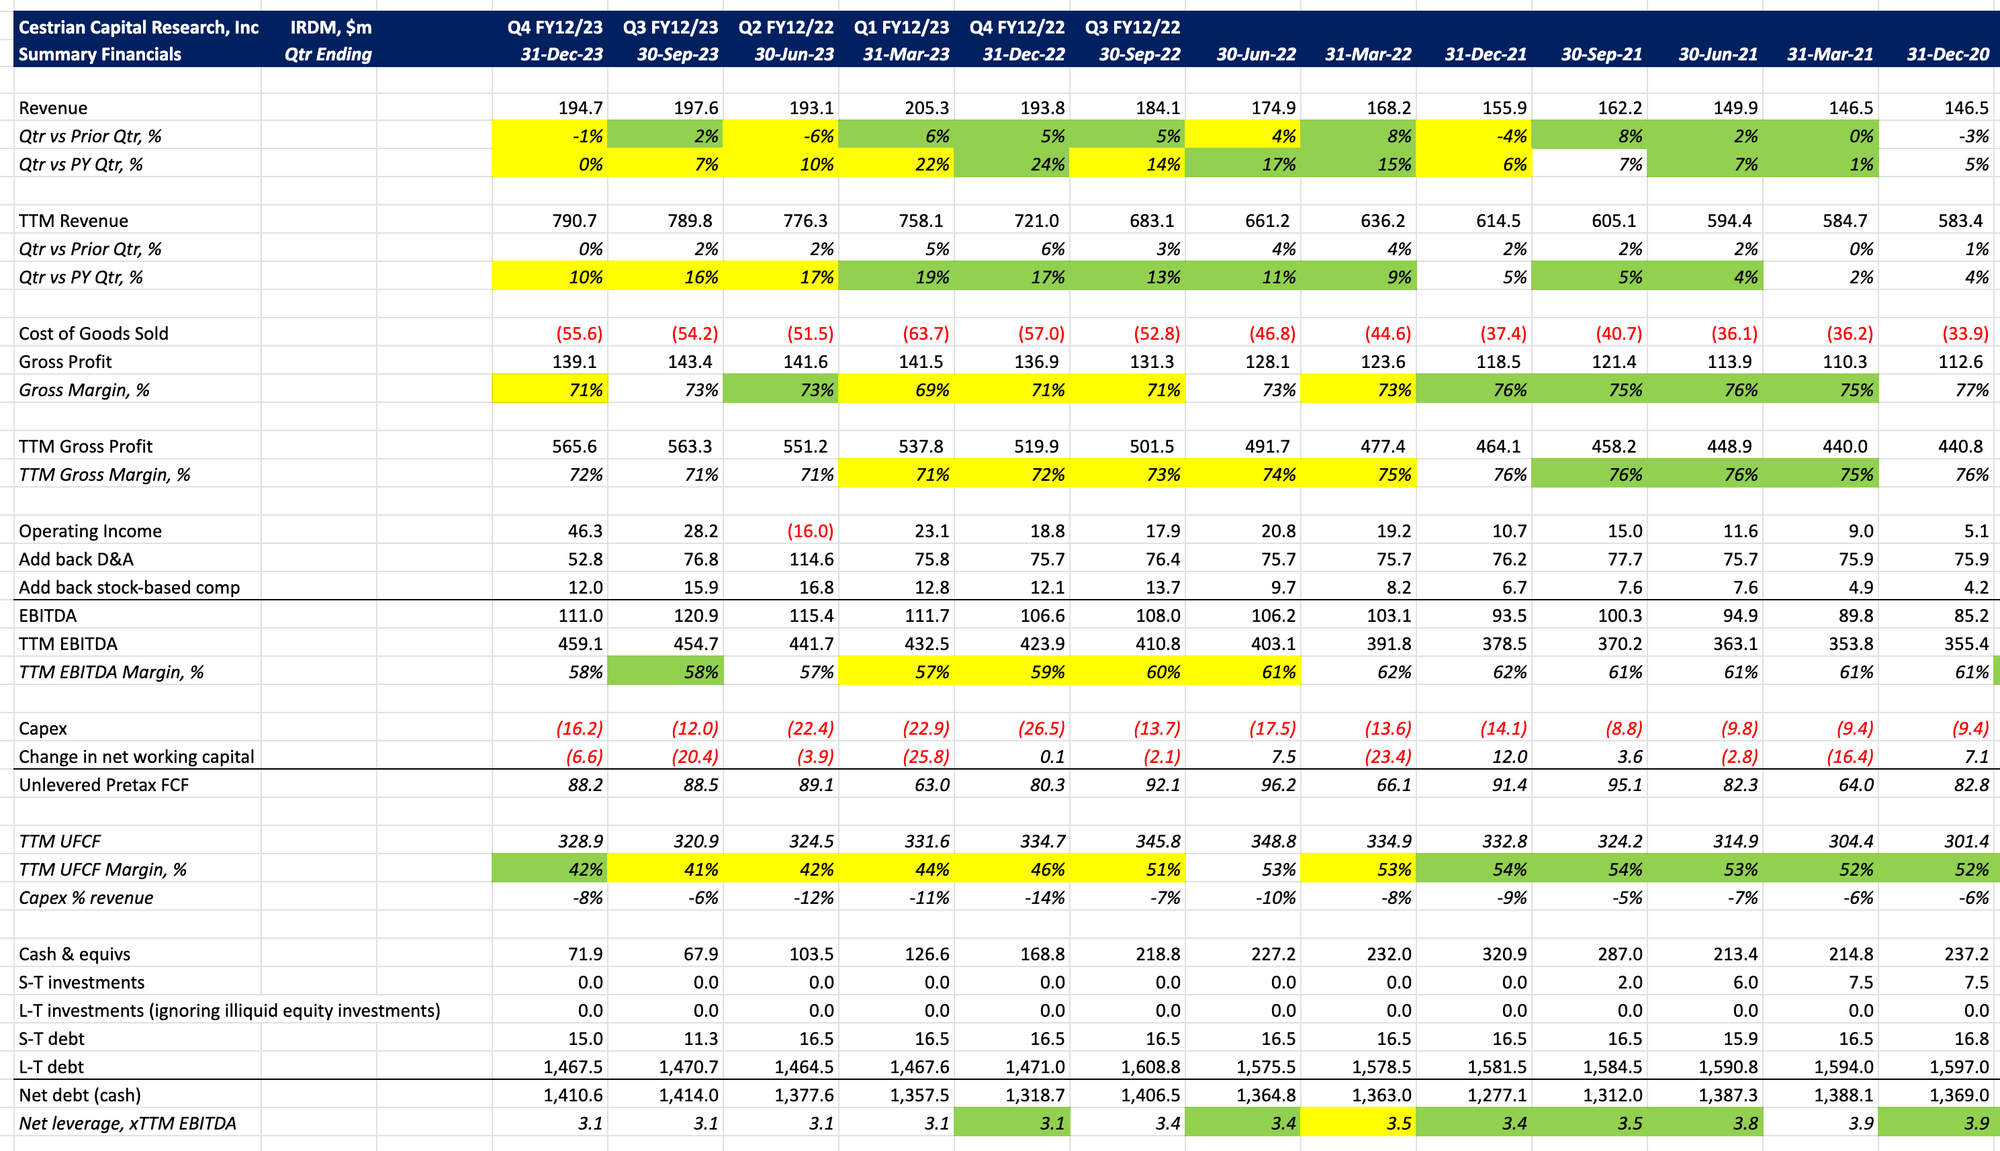
If you have any questions about the numbers or anything else here, be sure to reach out. Don't suffer in silence!
Valuation Analysis
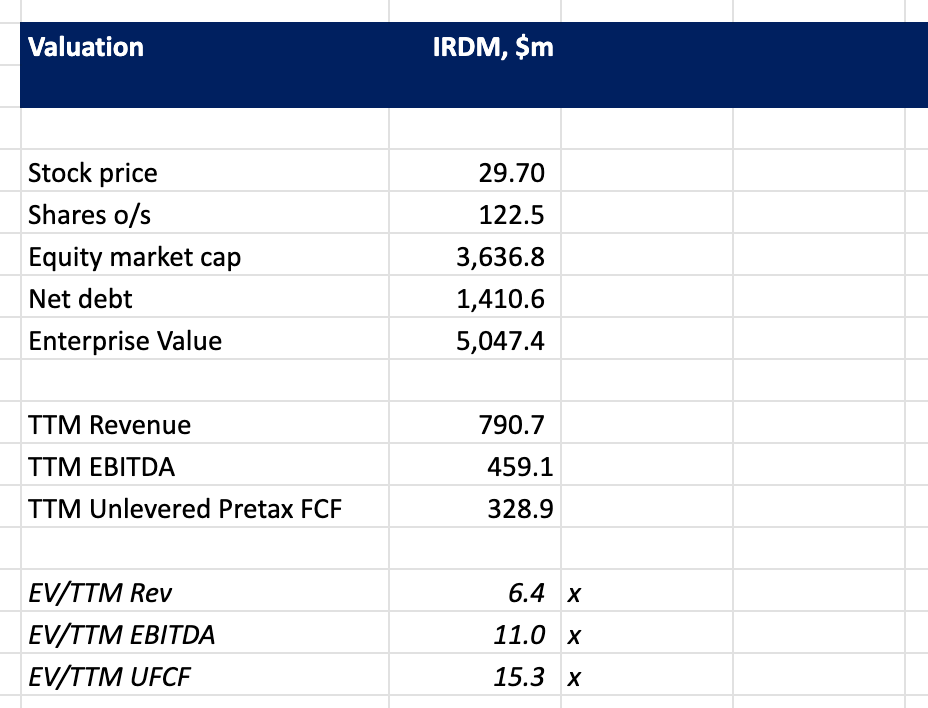
Iridium isn't expensive on fundamentals - 15x TTM cashflow for a steady-Eddie value name paying a dividend (albeit a small one - forward yield estimate is just 1.75% according to Ycharts.com) and conducting a buyback campaign. That doesn't make it a buy for me at this stage, because it is not extremely cheap. Only at extremes do I believe fundamental valuations matter. When META bottomed in 2022 it was trading at just 7.5x TTM UFCF, so, half the multiple that IRDM is now at. (Oh, and nobody wanted to buy it, by the way).
Stock Rating
We rate IRDM at Do Nothing for now.
If you have questions about any of the numbers, charts, anything, reach out in chat.
Cestrian Capital Research, Inc - 4 Mar 2024.
DISCLOSURE - Cestrian Capital Research, Inc staff personal accounts hold no positions in IRDM.