
Macro Musings – What To Expect From The Next Nonfarm Payrolls?

DISCLAIMER: This note is intended for US recipients only and, in particular, is not directed at, nor intended to be relied upon by any UK recipients. Any information or analysis in this note is not an offer to sell or the solicitation of an offer to buy any securities. Nothing in this note is intended to be investment advice and nor should it be relied upon to make investment decisions. Cestrian Capital Research, Inc., its employees, agents or affiliates, including the author of this note, or related persons, may have a position in any stocks, security, or financial instrument referenced in this note. Any opinions, analyses, or probabilities expressed in this note are those of the author as of the note's date of publication and are subject to change without notice. Companies referenced in this note or their employees or affiliates may be customers of Cestrian Capital Research, Inc. Cestrian Capital Research, Inc. values both its independence and transparency and does not believe that this presents a material potential conflict of interest or impacts the content of its research or publications.
Yimin Xu, Jun 06 2024
Will May's Nonfarm Payrolls further soften?
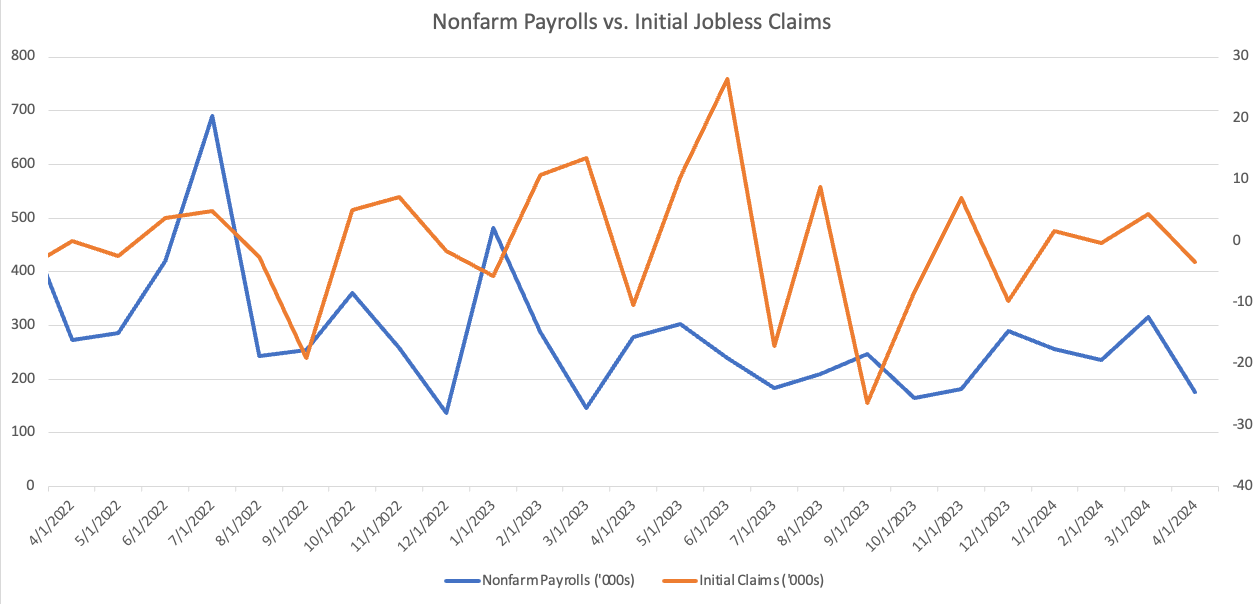
One month ago, we saw a big reduction in the Nonfarm Payrolls (NFP) data from 315k in March to 175k jobs added in April.
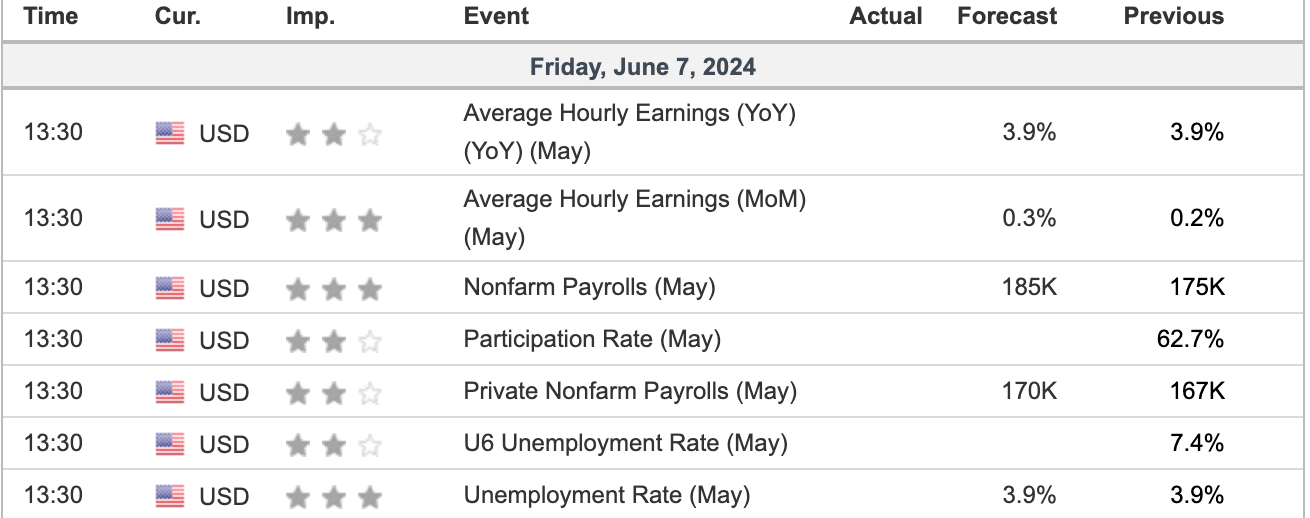
Tomorrow (Friday June 7th), we will see the release of the May NFP data. The market consensus is +185k jobs, a slightly stronger print than April.
But a further softening in the NFP could bring forward the first rate cute expectation from the currently expected September FOMC.
This is because in the May FOMC, Powell highlighted that an unexpected weakening in the labour market could trigger the next rate cut, even though this scenario was not the primary expectation.
I expect the May NFP data to further soften, undershooting the market expectation of 185k jobs added.
In my statistical analysis, I found a moderate negative correlation of -0.54 between NFP and the change in monthly average Jobless Claims since 2021. In May, the number of initial claims shot up by 12.3k from April to 222.5k.
However, I think the average hourly earnings likely come in line with forecast of 0.3% MoM. This is because hourly earnings are positively correlated with the number of hires and quits, and negatively correlated with the number of layoffs. These correlations still work (though moderately weaker) with a 1-month lag.
While the latest job openings data only covers April (not May), we actual saw higher numbers of both hires and quits and fewer layoffs in April, which should still work in the hourly earnings' favour.
Why has employment been so strong in this rate hike cycle?
In short, immigrant workers and female workers have helped hold up the US labour market.
In 2023, the foreign born accounted for 18.6% of the US civilian labour force. Foreign-born men continued to participate in the labour force at a considerably higher rate in 2023 (77.5%) than their native-born counterparts (66.1%).
However, immigration policy can easily become more restrictive in this election cycle, adversely affecting the labour supply.
In terms of the sex divide, 20+ year old men saw both participation rate and employment numbers drop in the past 12 months. A year ago, 70.3% of 20+ year old men participated with 82.6 million employed. Today, participation rate and employment stand at 70.1% and 82.3 million respectively. For women over 20-years-old, their participation rate went up from 58.6% to 59%, and 750k more women are employed today than a year ago.
Unfortunately, the end to pandemic-related childcare funding can be causing struggles for working mothers. This could reverse the upward momentum in female labour force participation.
Will Equities continue to defy seasonality?
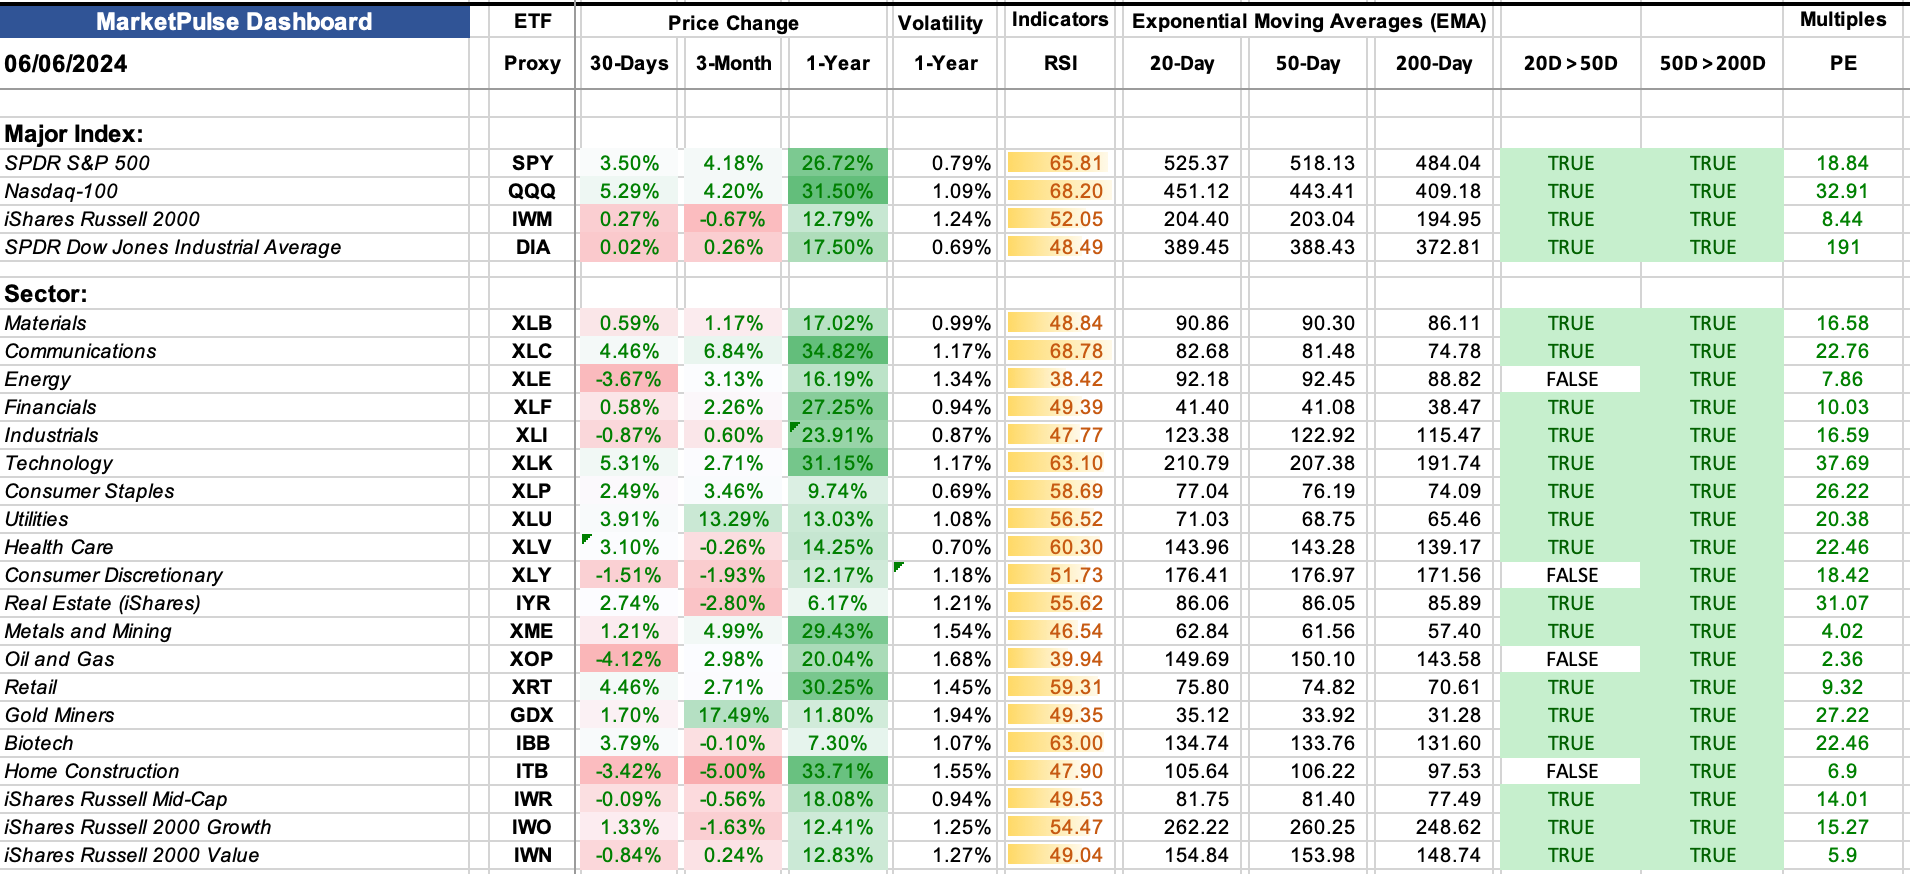
We saw a fairly broad-based rally in the past month, with 13 out of the 17 sector ETFs making a positive 30-day return, led by Technology, Communications, and retail. More encouragingly, the overwhelming majority of stock indices and sector ETFs retain a positive momentum, with their 20-day averages above their 50-day, and 50-day averages entirely above the 100-day.
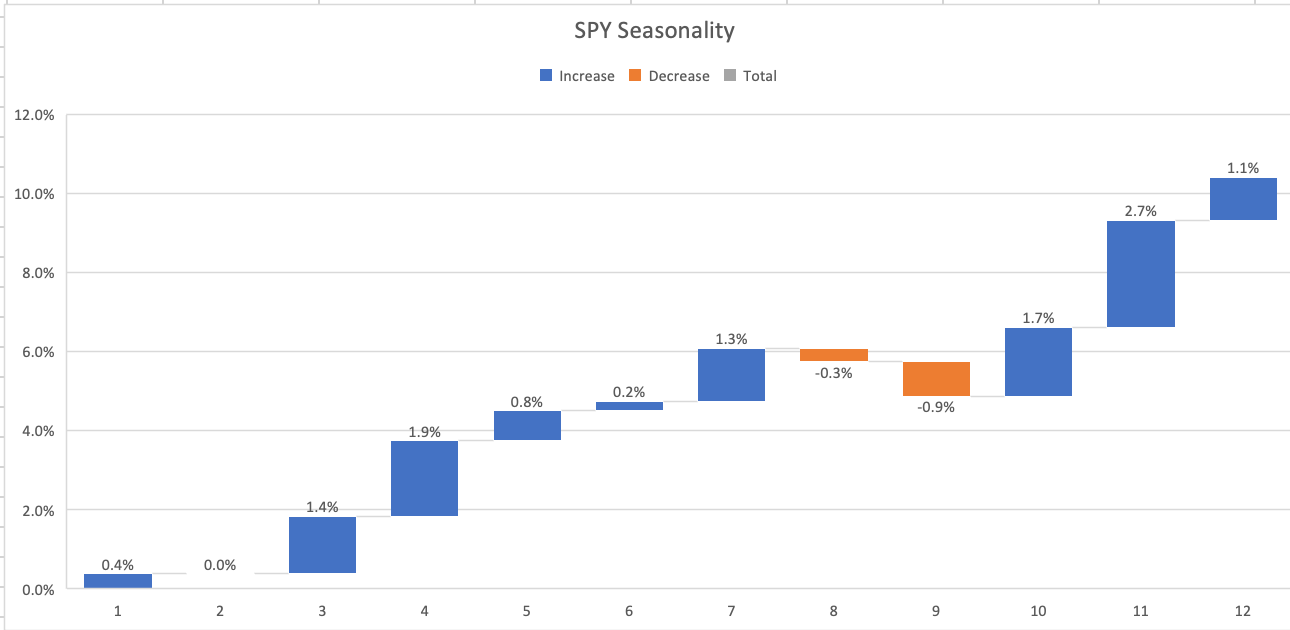
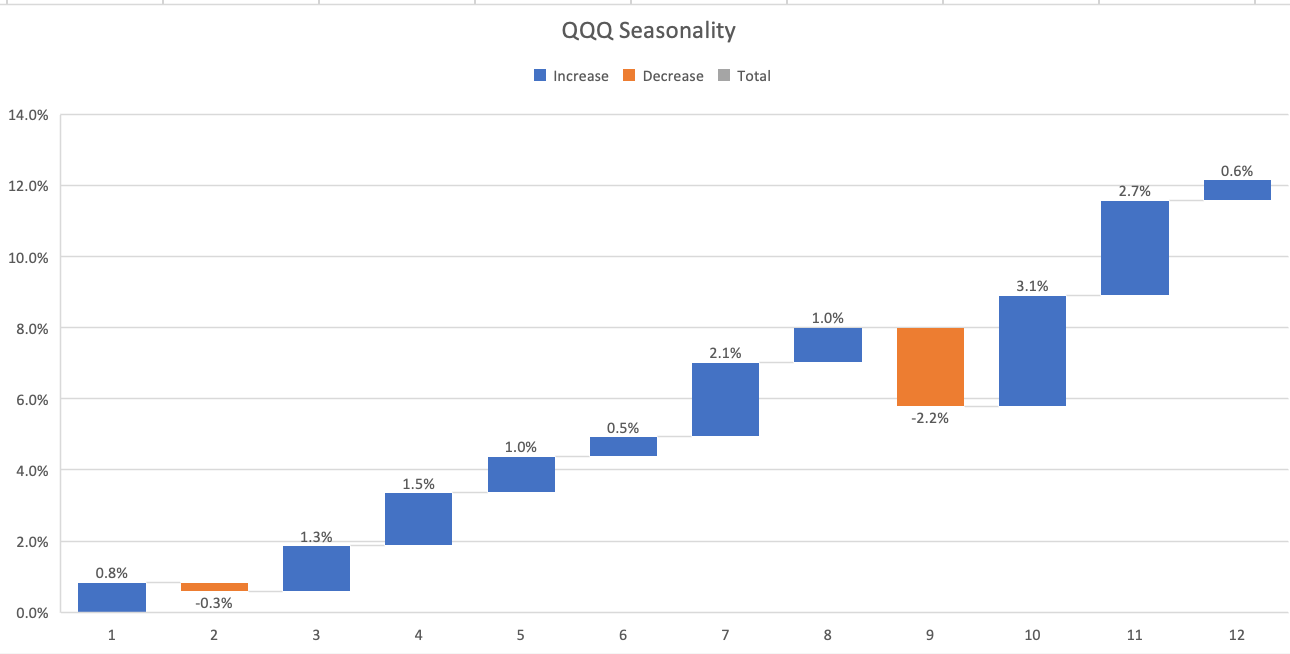
We have also enjoyed a quick start to the month in June with SPY up 1.1% and QQQ up 2% this week. However, June is a seasonally muted month for equities.
Since 1996, SPY returned on average just 0.2% in June, compared with 0.8% in May or 1.3% in July.
QQQ performed marginally better at just a 0.5% June average since 1999.
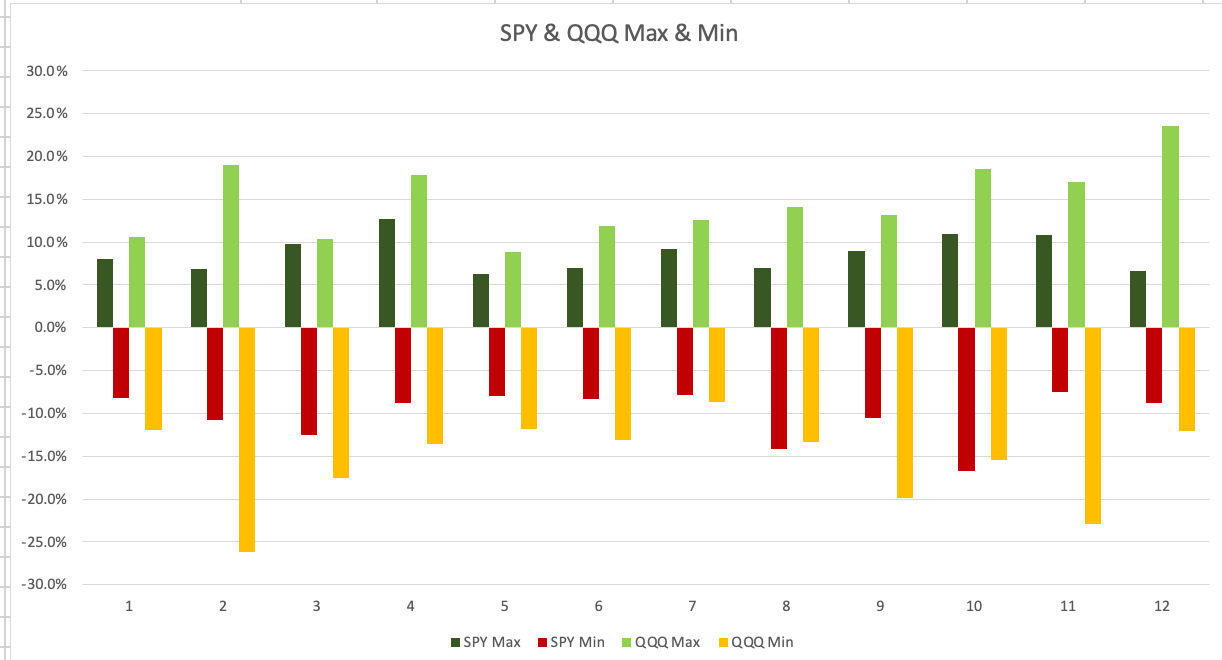
The graph below maps out the best and worst performances of SPY and QQQ for any given month in the past 30 years. You could see that their performance range is much tighter in May and June.
Therefore, I would not be surprised if the market takes a breather this month.
The Fed Funds Path
As the latest Core PCE moderated to 0.2% from 0.3% MoM (in line with forecasts), market has priced back some more cuts.
The market has formed an expectation of a September cut this year, followed by another cut in December. We are still pricing in 3 cuts for 2025.
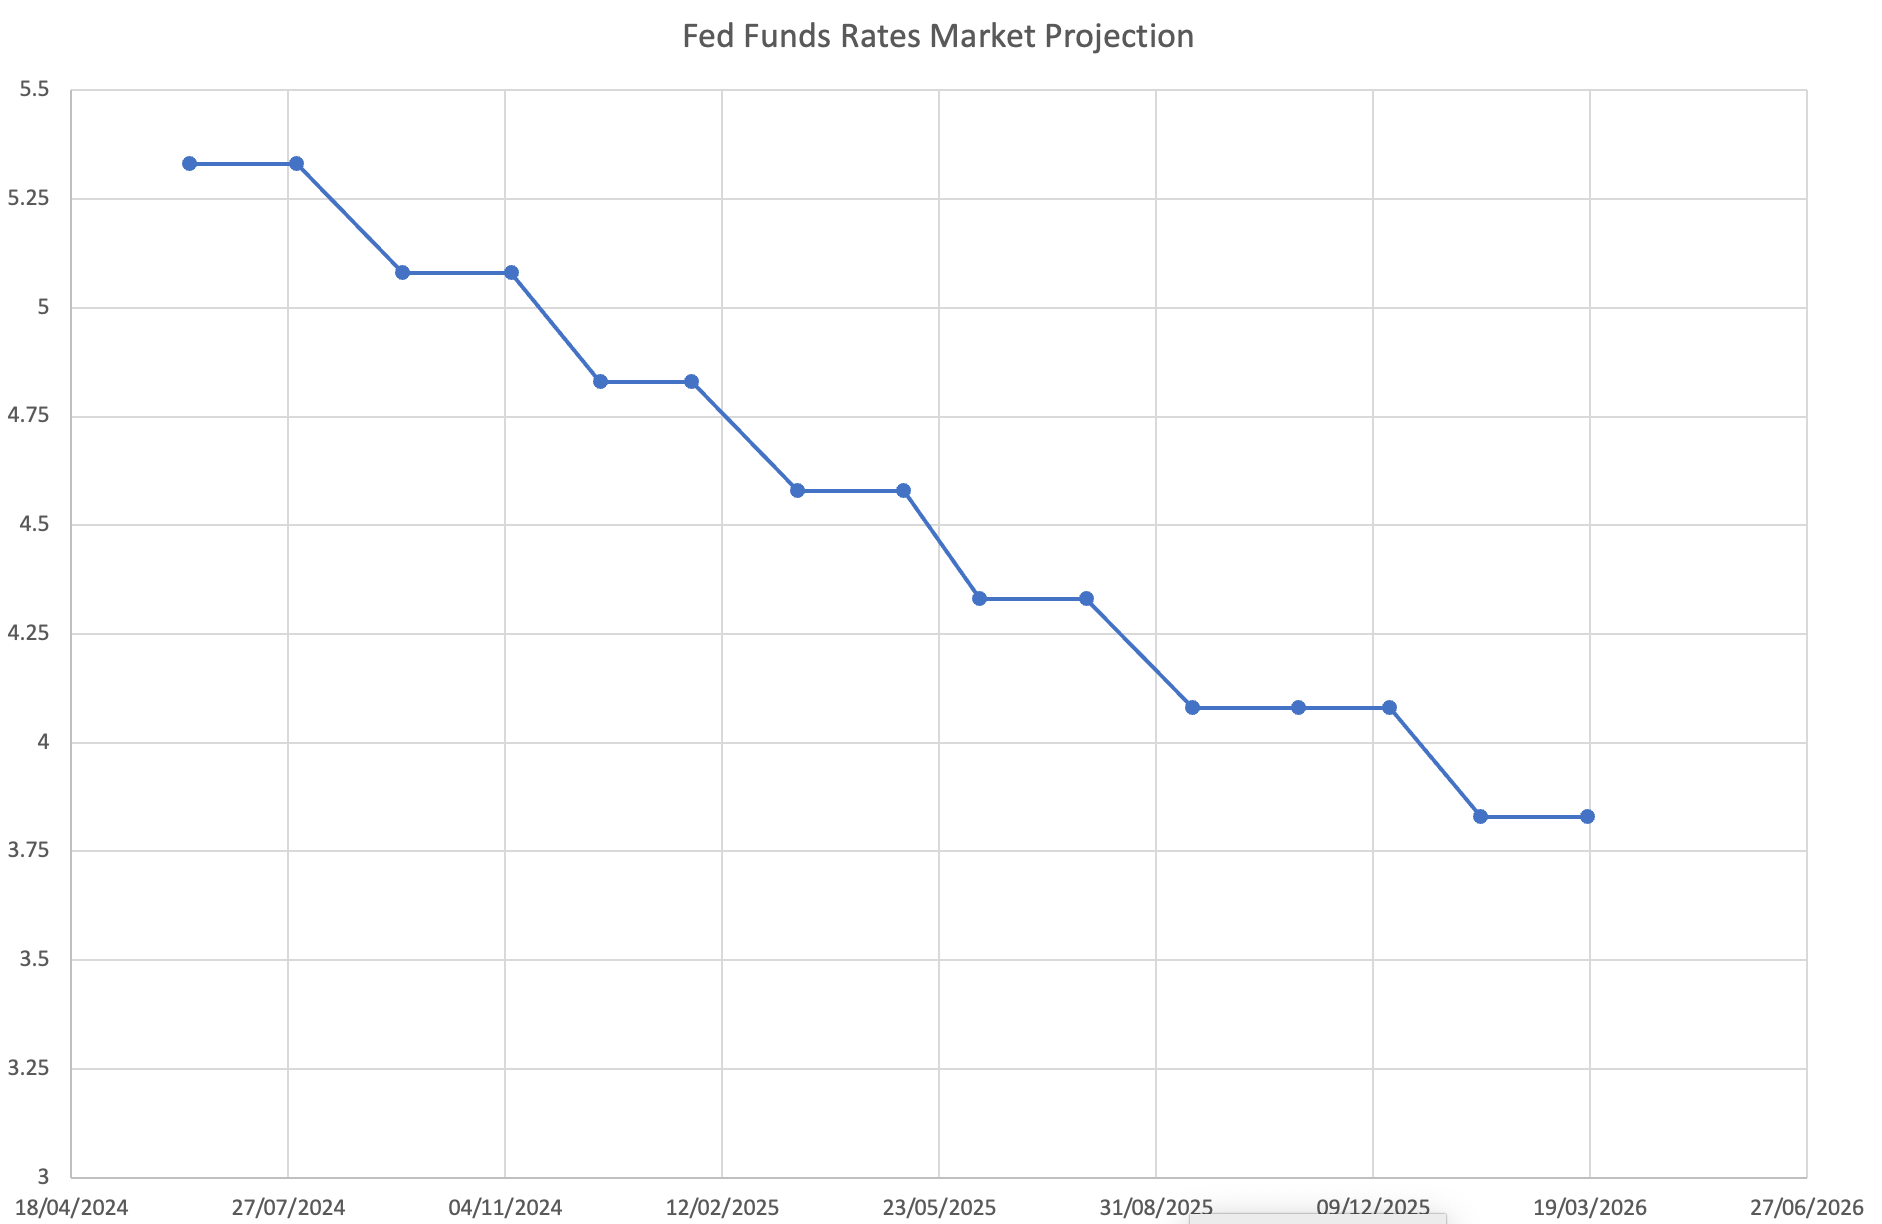
A weaker than expected NFP tomorrow can push up the odds of the first cut to July.
Feel free to ask any questions in the comments
Thanks for reading my analysis. If you have any questions, please simply reach out. If you have a suggested topic for me to cover in the future, please also let me know in the comments.
- Yimin