
Market On Open - Monday 5 February
Act II
DISCLAIMER: This note is intended for US recipients only and, in particular, is not directed at, nor intended to be relied upon by any UK recipients. Any information or analysis in this note is not an offer to sell or the solicitation of an offer to buy any securities. Nothing in this note is intended to be investment advice and nor should it be relied upon to make investment decisions. Cestrian Capital Research, Inc., its employees, agents or affiliates, including the author of this note, or related persons, may have a position in any stocks, security, or financial instrument referenced in this note. Any opinions, analyses, or probabilities expressed in this note are those of the author as of the note's date of publication and are subject to change without notice. Companies referenced in this note or their employees or affiliates may be customers of Cestrian Capital Research, Inc. Cestrian Capital Research, Inc. values both its independence and transparency and does not believe that this presents a material potential conflict of interest or impacts the content of its research or publications.
Unstoppable Bull
Blowout jobs numbers Friday wasn't enough to stop the Bullo Di Tutti Bulli, the Bull's Bull Market, The Grand Ole Bull, in its tracks. So powerful has been the run since the October 2022 lows that it has blasted through every worry that has come the market's way - to the dismay of many who have stayed on the sidelines. Friday was no exception.
Jobs and in particular wages ticked up vs. expectations to a degree that puts March rate cuts as a much less likely prospect. And since the market is up because - right? this is the reason, as everyone knows? - because of the rate cuts that are coming, it stands to reason that the market would sell off because if no rate cut, no fuel for the bull.
Oops. The S&P500 and the Nasdaq continued to move up Friday. Proving, in case it needed to be proved, that exogenous factors are interesting but not determinative of price movements. Most likely anyone who matters in the market already knew jobs were running hot and figured that at a minimum, rates wouldn't go up in an election year, so, all good.
Today we get properly into February which as any fule kno is on average one of the weaker months of the year. According to TrendSpider, looking back to 1993, February in the SPY has been up just 56% of the time.
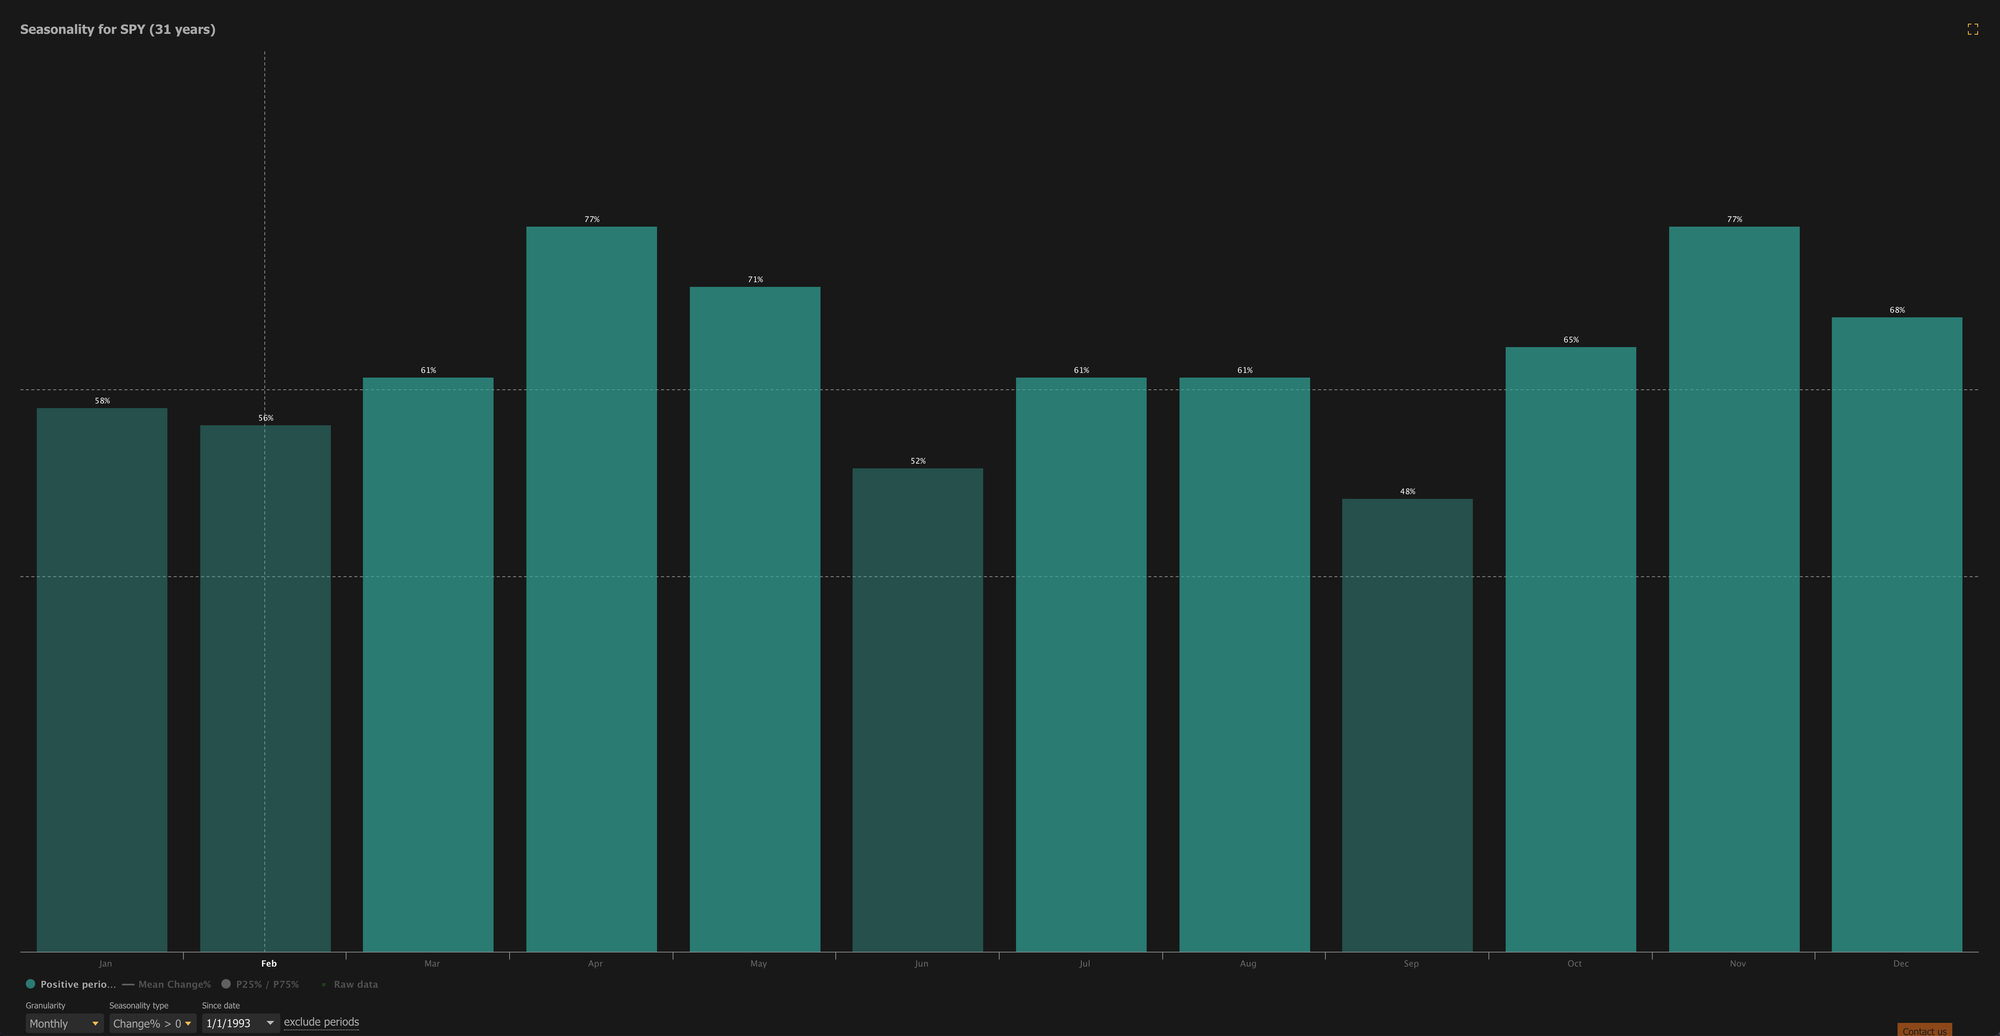
So there is a little seasonality headwind in front of us.
In addition the degree of run-up means in the short term that a pullback is increasingly likely. I do not say a dump, and I certainly do not say Armaggeddon. I remain bullish on US equities for 2024. But pullbacks happen when wave movements get extended. The S&P500 finds itself at the 100% extension of waves 1-3 combines on a chart that starts in January 2023.
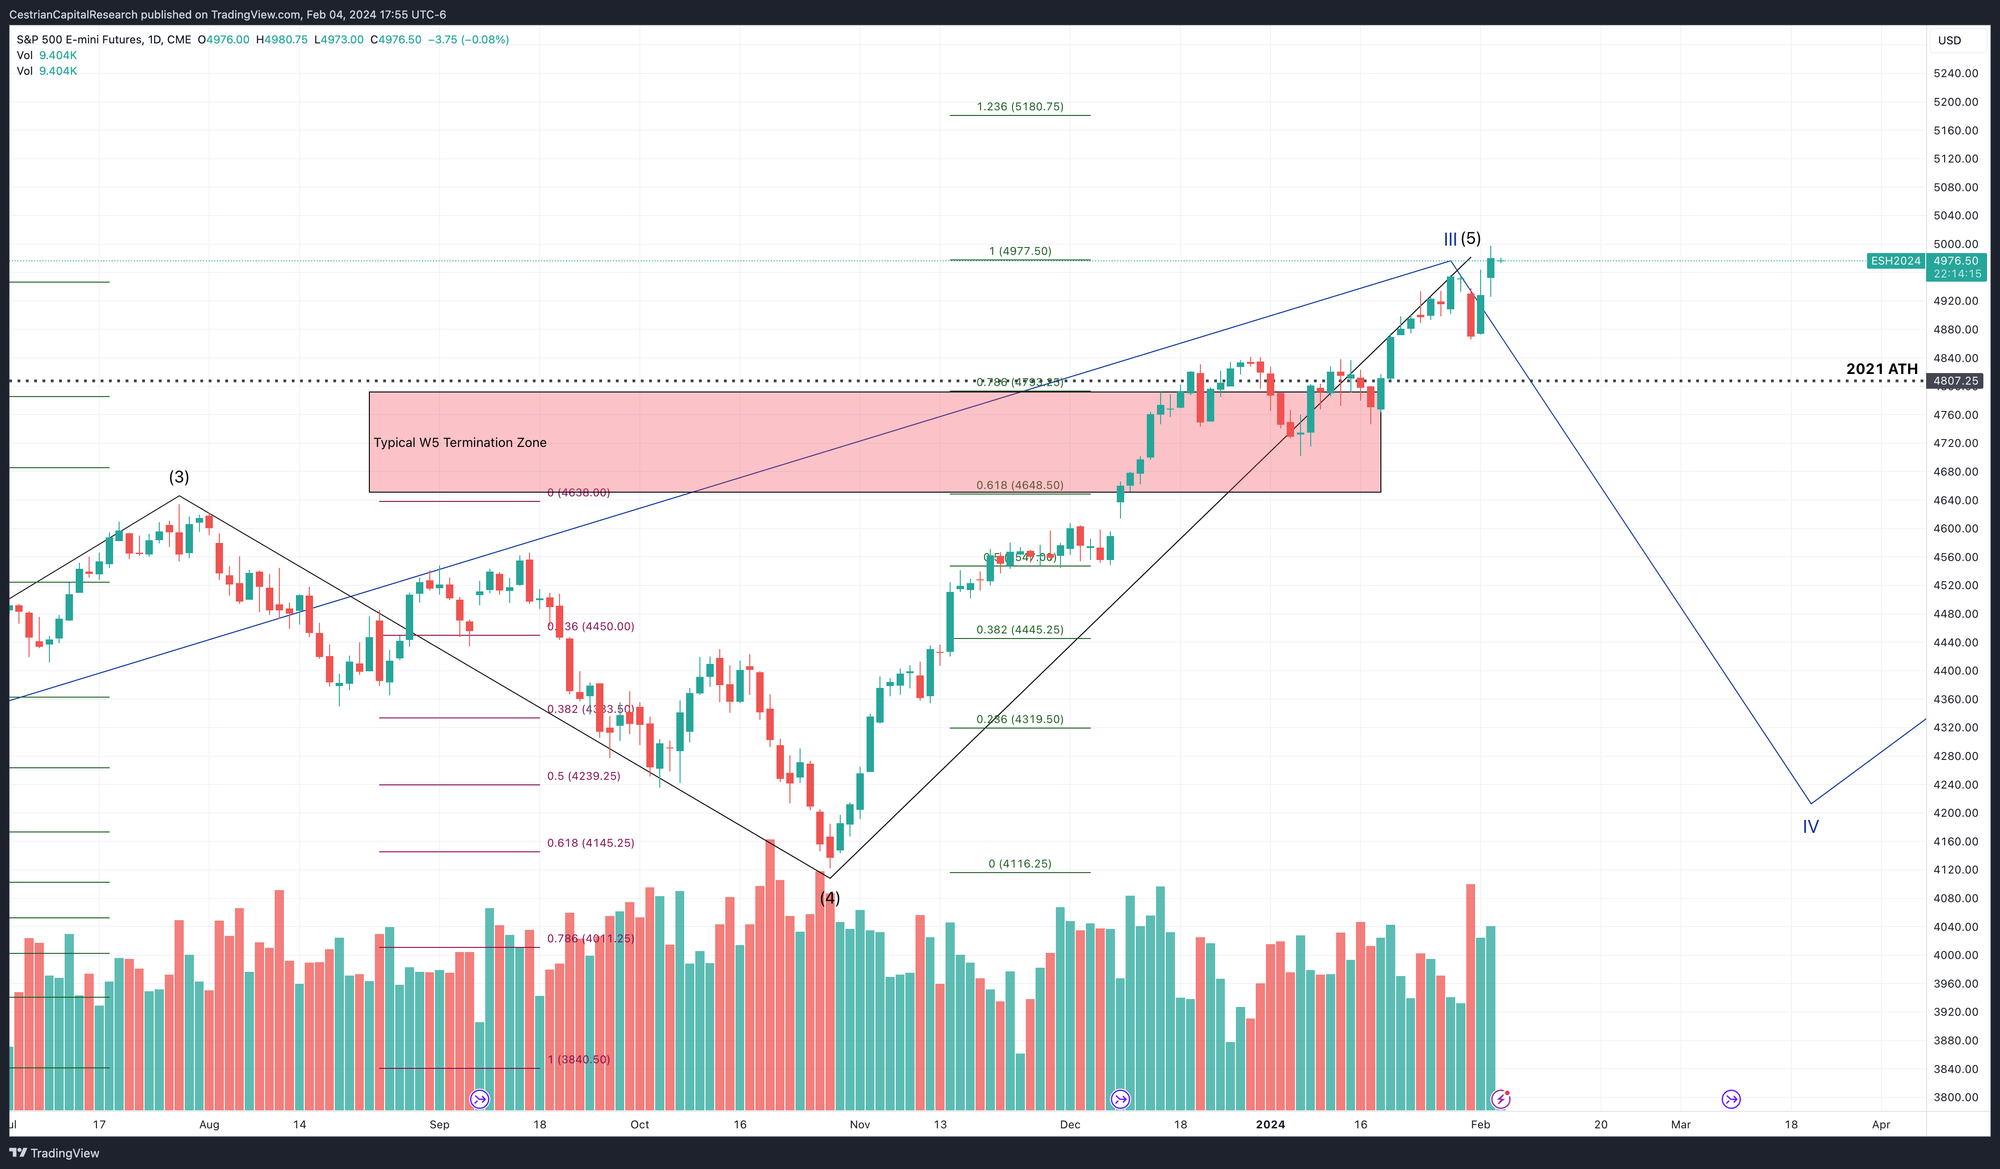
That is a big Wave 5 as you can see.
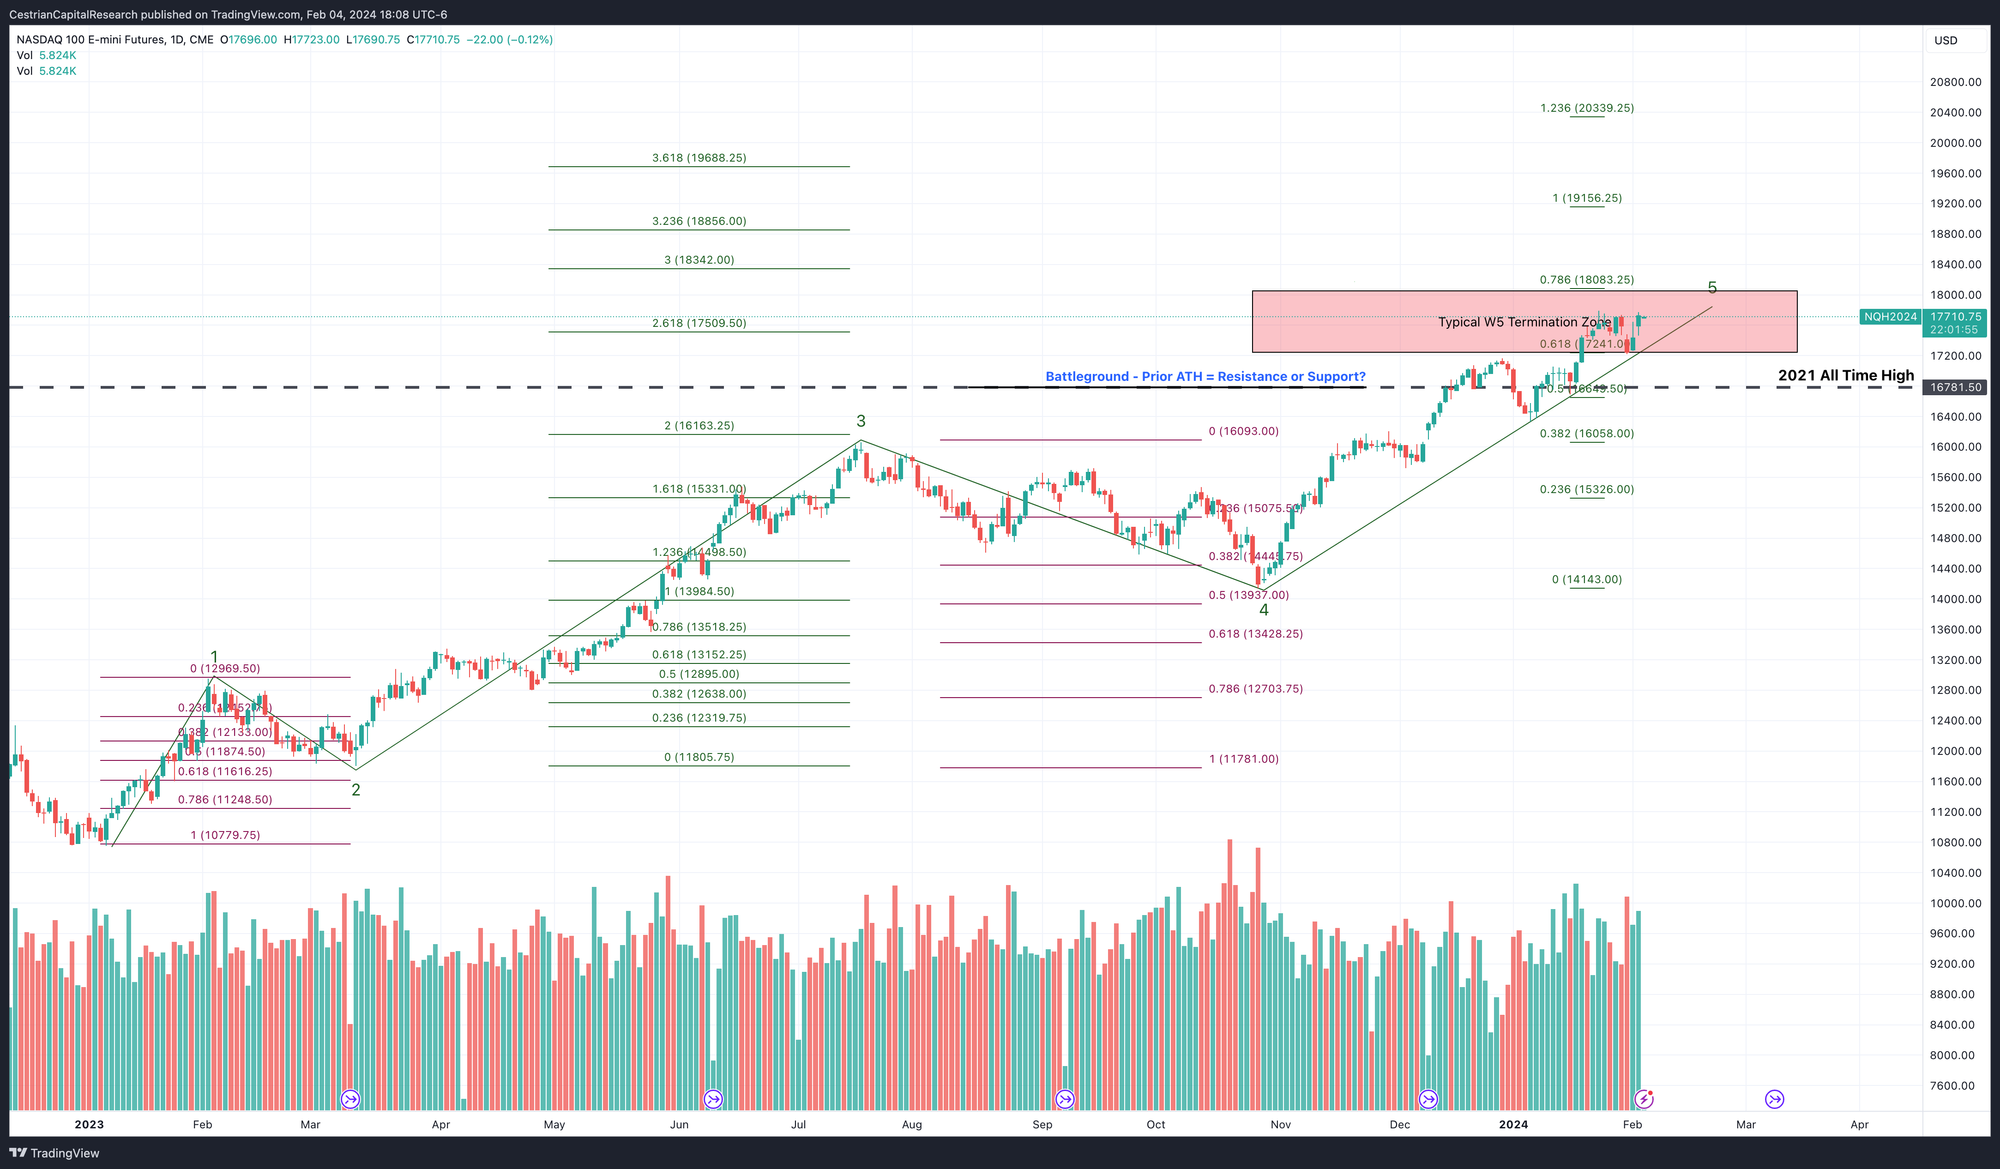
The Nasdaq finds itself right in the crosshairs of a typical Wave 5 consolidation zone.
None of this means a pullback will happen. And we firmly believe that we're in a bull market that has some time yet to run. So if a pullback does come we think it may present an opportunity for anyone looking higher.
OK. Now onto our usual charts. Paying members of Inner Circle, scroll down for our long- and short-term take on the S&P500, the Nasdaq-100, the Dow Jones 30 and the Russell 2000 - including the regular ETFs, the futures, the 3x leveraged ETFs and then finishing with a take on sector ETFs in semiconductor, tech, and the Fangs.
(Not a paying member? Sign up right here. If you’re not sure about committing, just take the monthly. If you like it and want to take an annual, we’ll deduct that first month’s fee so you’re not out of pocket. If you hate it, you’re down only $299).
Note - to open full-page versions of these charts, just click on the chart headings, which are hyperlinks.