
Market On Open, Tuesday 8 July

DISCLAIMER: This note is intended for US recipients only and, in particular, is not directed at, nor intended to be relied upon by any UK recipients. Any information or analysis in this note is not an offer to sell or the solicitation of an offer to buy any securities. Nothing in this note is intended to be investment advice and nor should it be relied upon to make investment decisions. Cestrian Capital Research, Inc., its employees, agents or affiliates, including the author of this note, or related persons, may have a position in any stocks, security, or financial instrument referenced in this note. Any opinions, analyses, or probabilities expressed in this note are those of the author as of the note's date of publication and are subject to change without notice. Companies referenced in this note or their employees or affiliates may be customers of Cestrian Capital Research, Inc. Cestrian Capital Research, Inc. values both its independence and transparency and does not believe that this presents a material potential conflict of interest or impacts the content of its research or publications.
Back To The Future, Tariffs Edition
by Alex King, CEO, Cestrian Capital Research, Inc
As the day progressed Monday, the promised letters were sent to third party countries with whom the US trades and with whom trade agreements have yet to be agreed. The headlines rolled in thus:
Equities had been weak all day and the tariff news didn’t deliver any relief.
Most likely the timing of tariff news wasn’t news to everyone. The options market has been telling a story of bearish large-account positioning for some days now.
Predictive Analytic Models (PAM)
— Robert P. Balan (@RobertPBalan1) June 30, 2025
Robert P. Balan
Jun 30, 2025 5:30 PM (CET)
And Here Comes Charm -- Getting Set For Acceleration! -- (and you know what that means!)
Visual shows the catastrophic flip from positive to negative charm at 6185:
Below 6185: Positive charm (green… pic.twitter.com/QutRnAg7et
Image Source - X.com / Robert P. Balan
In addition, short-term equity charts have looked toppy for a while - as you know if you read these Market On Open notes - so perhaps we will now get a partial correction of the moonshot move that took place between early April and early July.
Crypto
The crypto market is, it seems to me, quietly professionalizing further and splitting into two distinct wings. Bitcoin, Ether and Solana look to be emerging as the systems with real institutional backing, whilst the very long tail of altcoins seem set to remain pure gambling chips. Tom Lee, who is nobody’s fool, is explaining to the world the ultimate use case of the Ethereum blockchain, which is the underpinning of the growing stablecoin system (Lee claims 51% of stablecoins operate on the Ethereum network) and indeed the coming wave of everything-is-token.
Tokenized AUM on @ethereum is at an all-time high
— Token Terminal 📊 (@tokenterminal) July 6, 2025
World's biggest financial services firms & asset managers are tokenizing assets on Ethereum pic.twitter.com/5Xl4XXYQ3O
Image Source - X.com
We'll be talking a lot about tokenized assets here in the coming months; and we’ll be talking a lot about Ether and Solana as a result. More of our work will include crypto, because the tokenization of the world is real and just beginning.
Just last week we launched our first AI signal service to be embedded in third-party charts - we chose to start with Bitcoin on Trendspider. You can read all about it here:

Now, let’s take a look at what carnage happened on Wall Street on Monday!
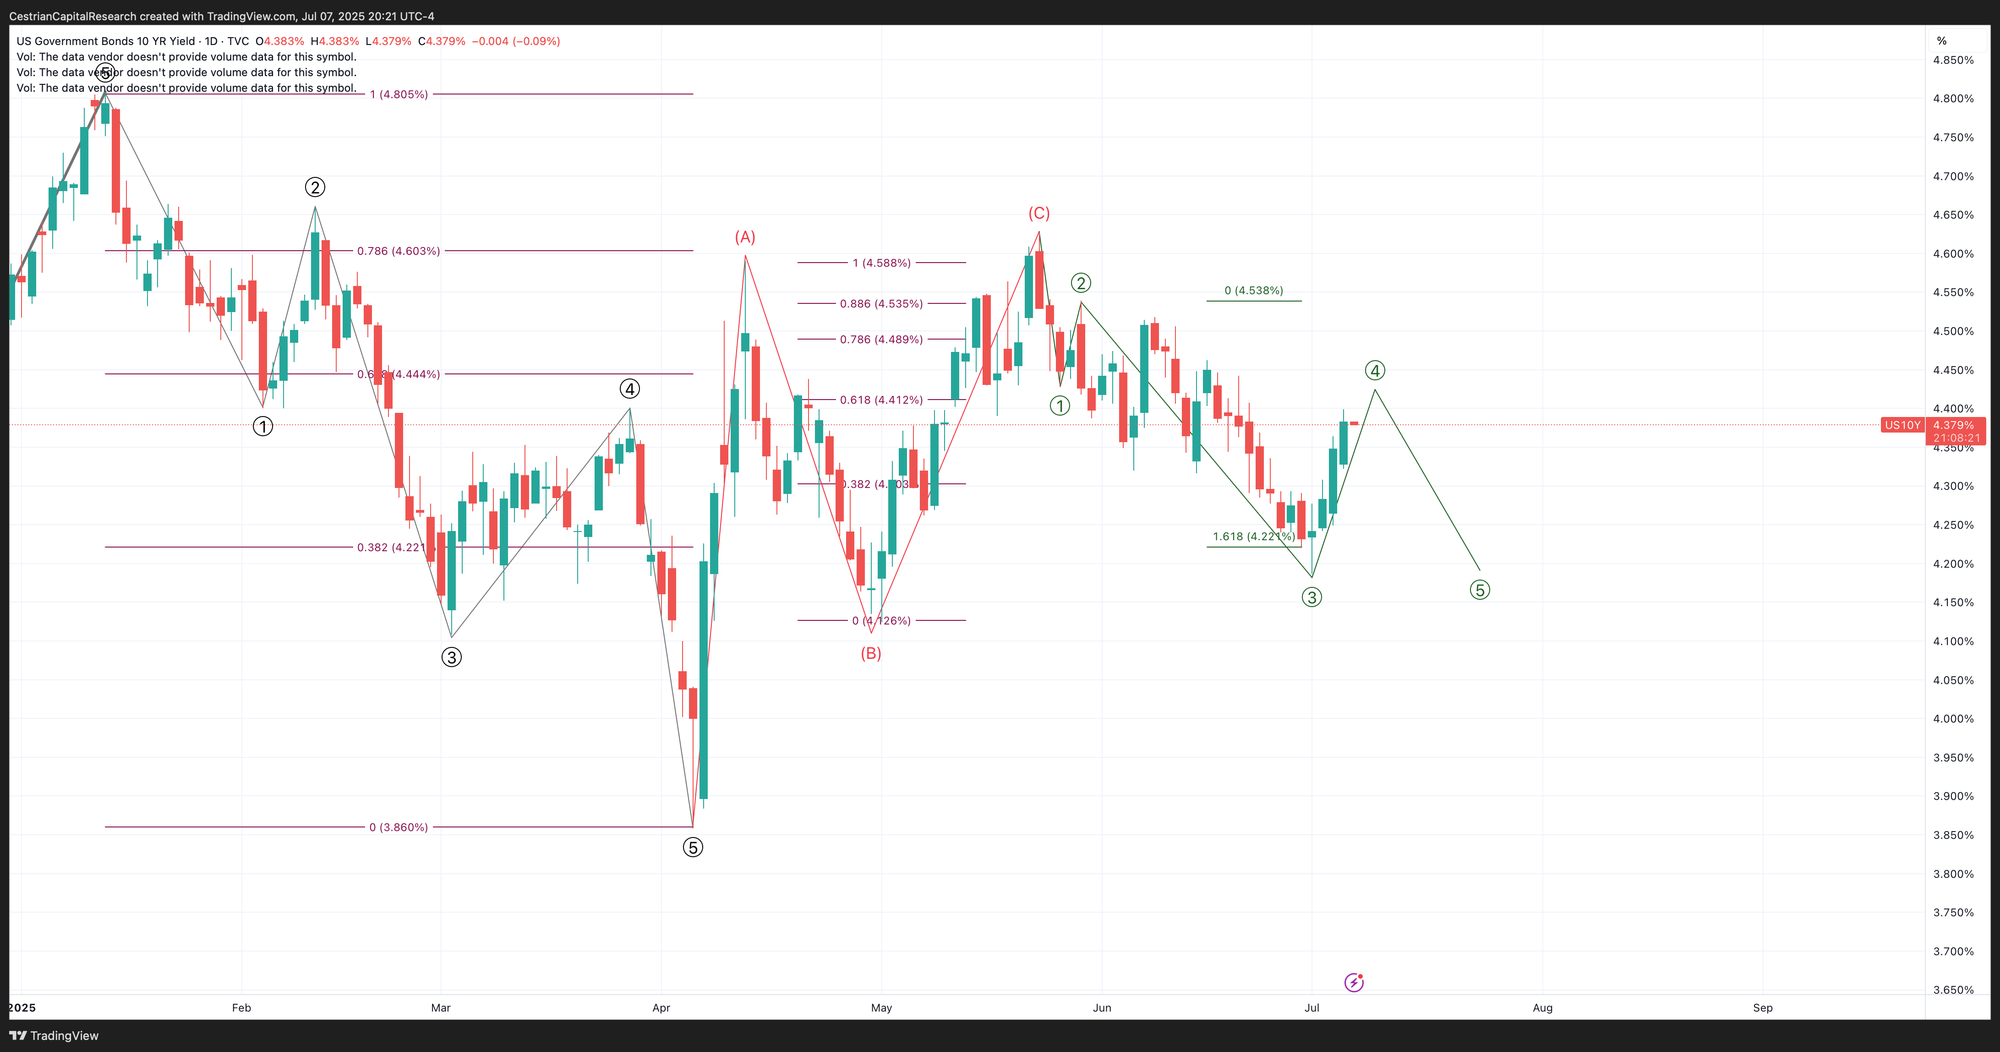
US 10-Year Yield
Below 4.43%, bullish for bonds.
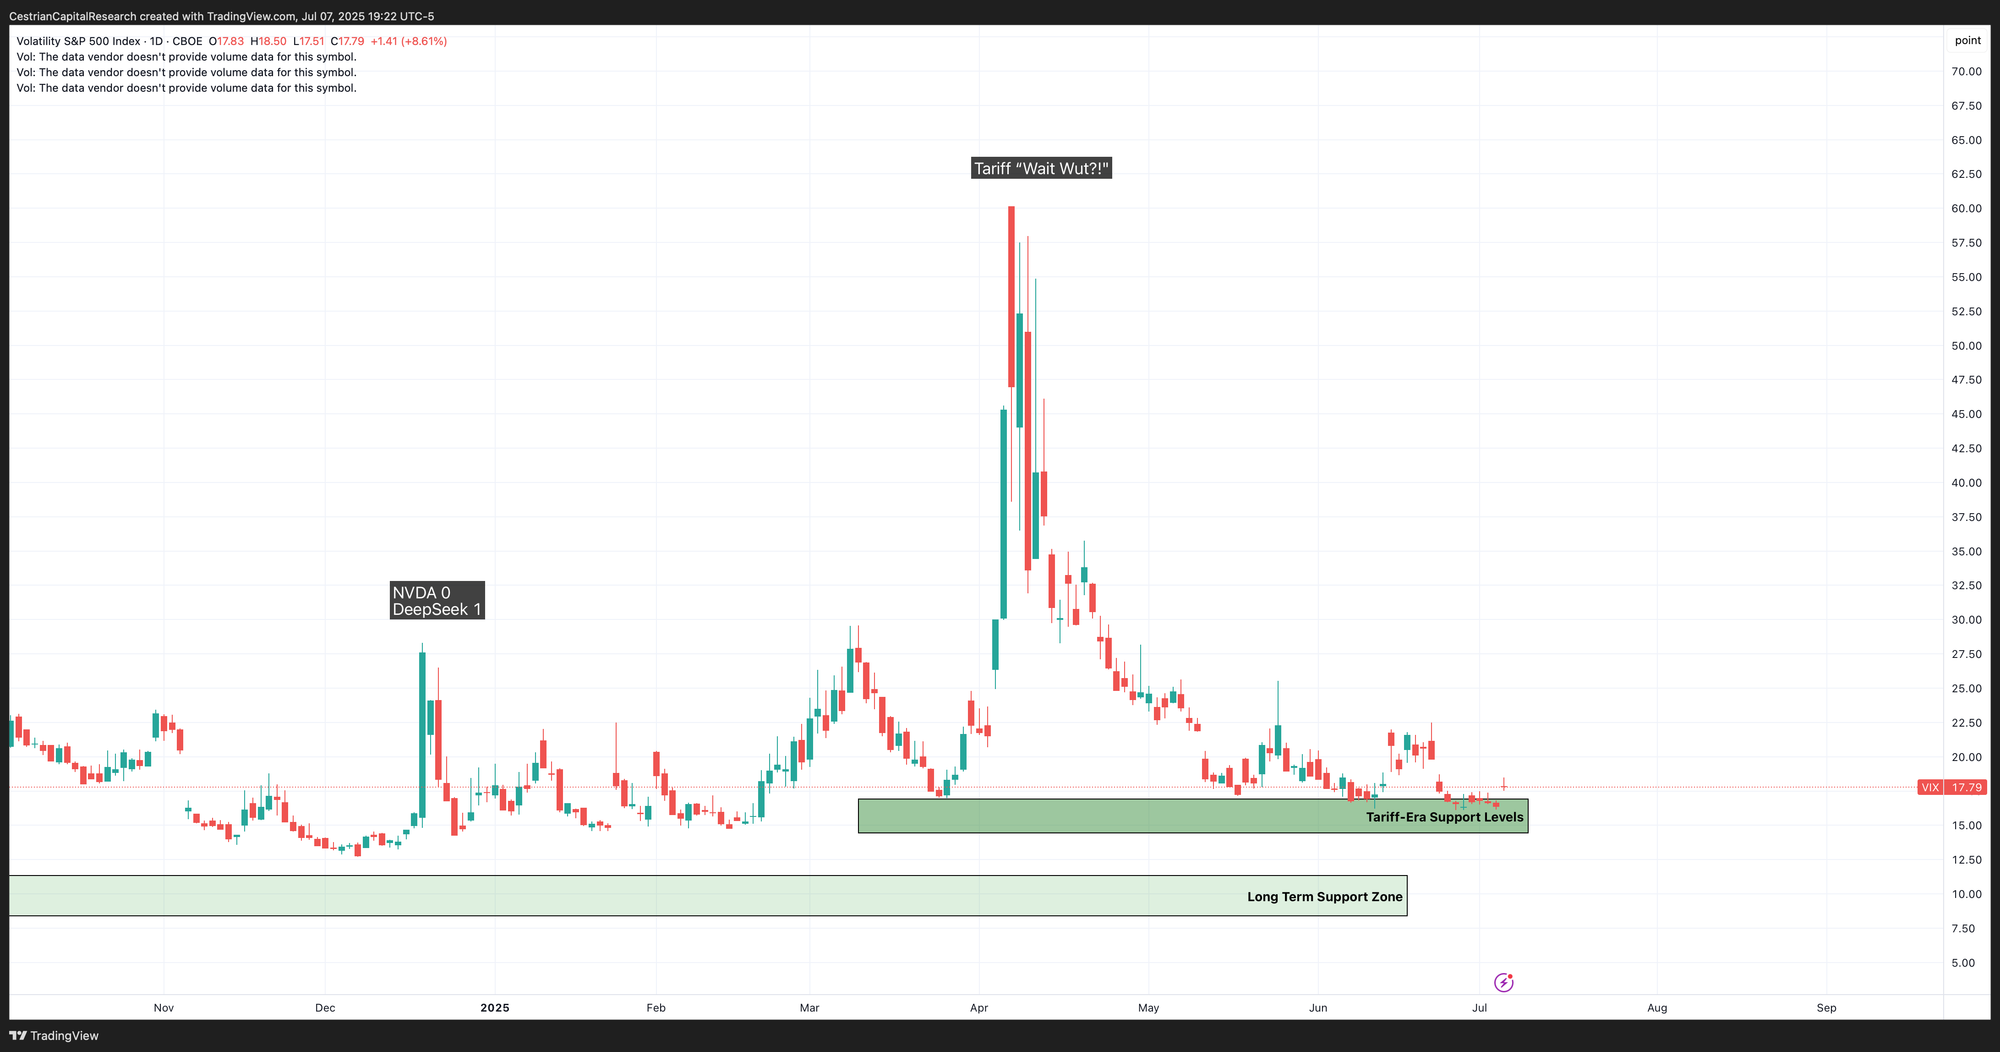
Equity Volatility
There are as yet no signs of panic in the Vix.
Disclosure: No position in any Vix-based securities.
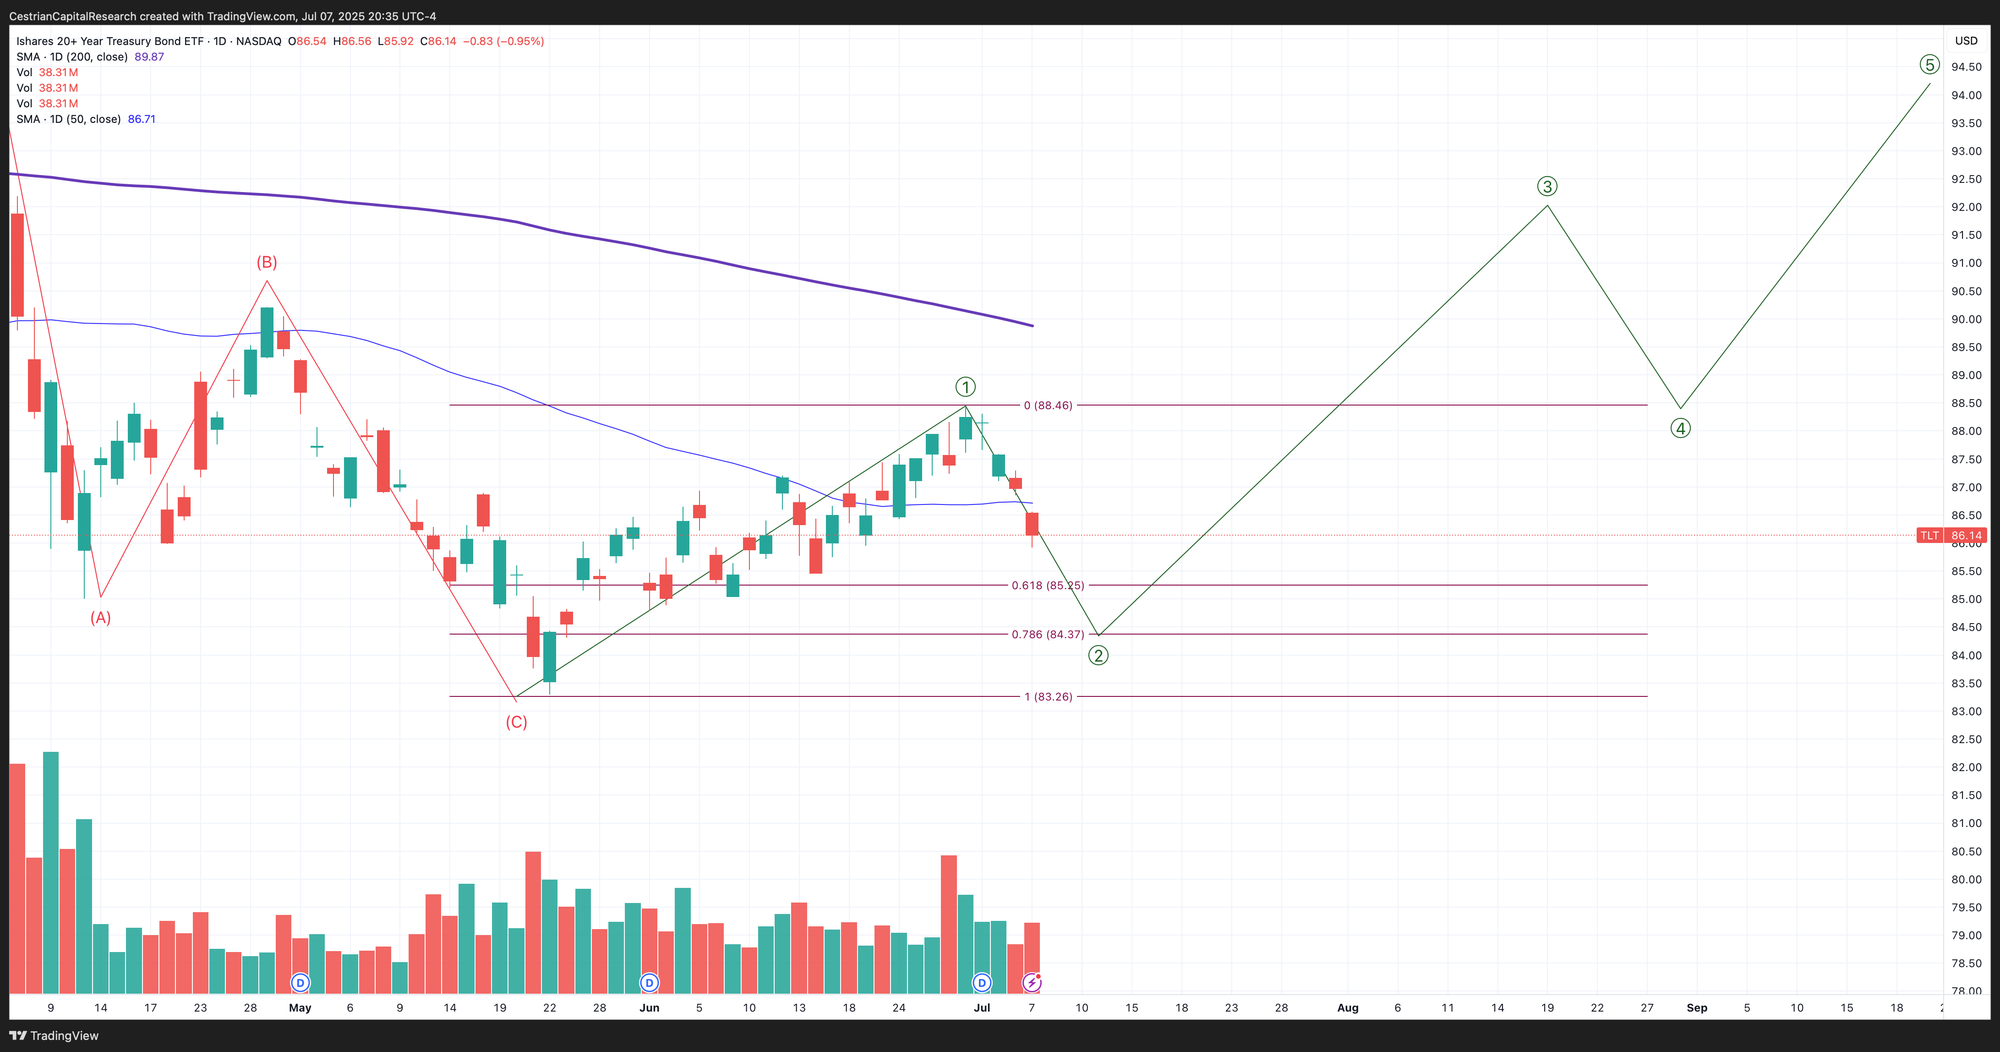
Longer-Term Treasury Bonds (TLT / TMF)
No change on this timeframe. It remains a bullish look.
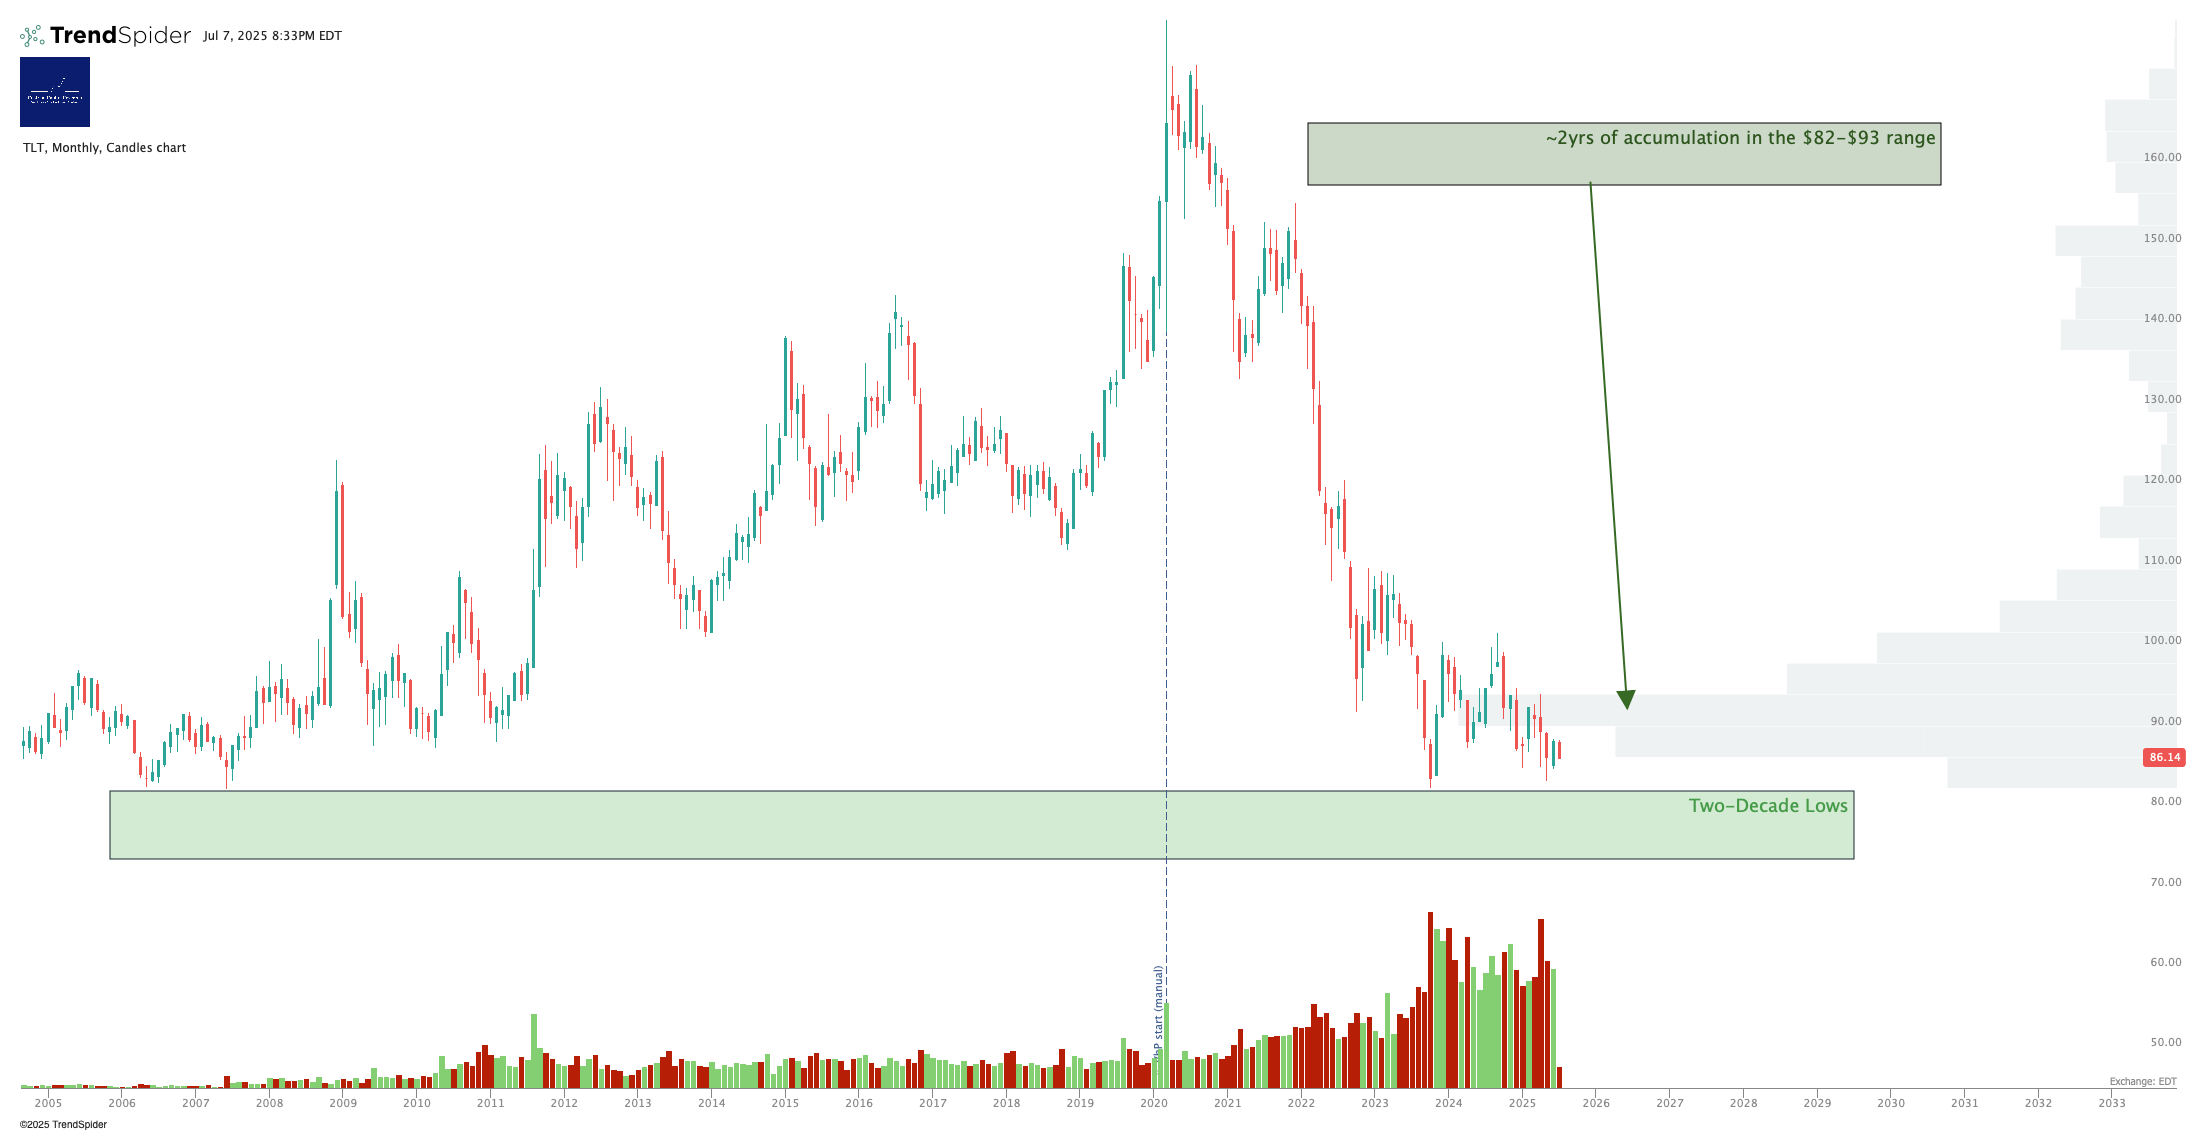
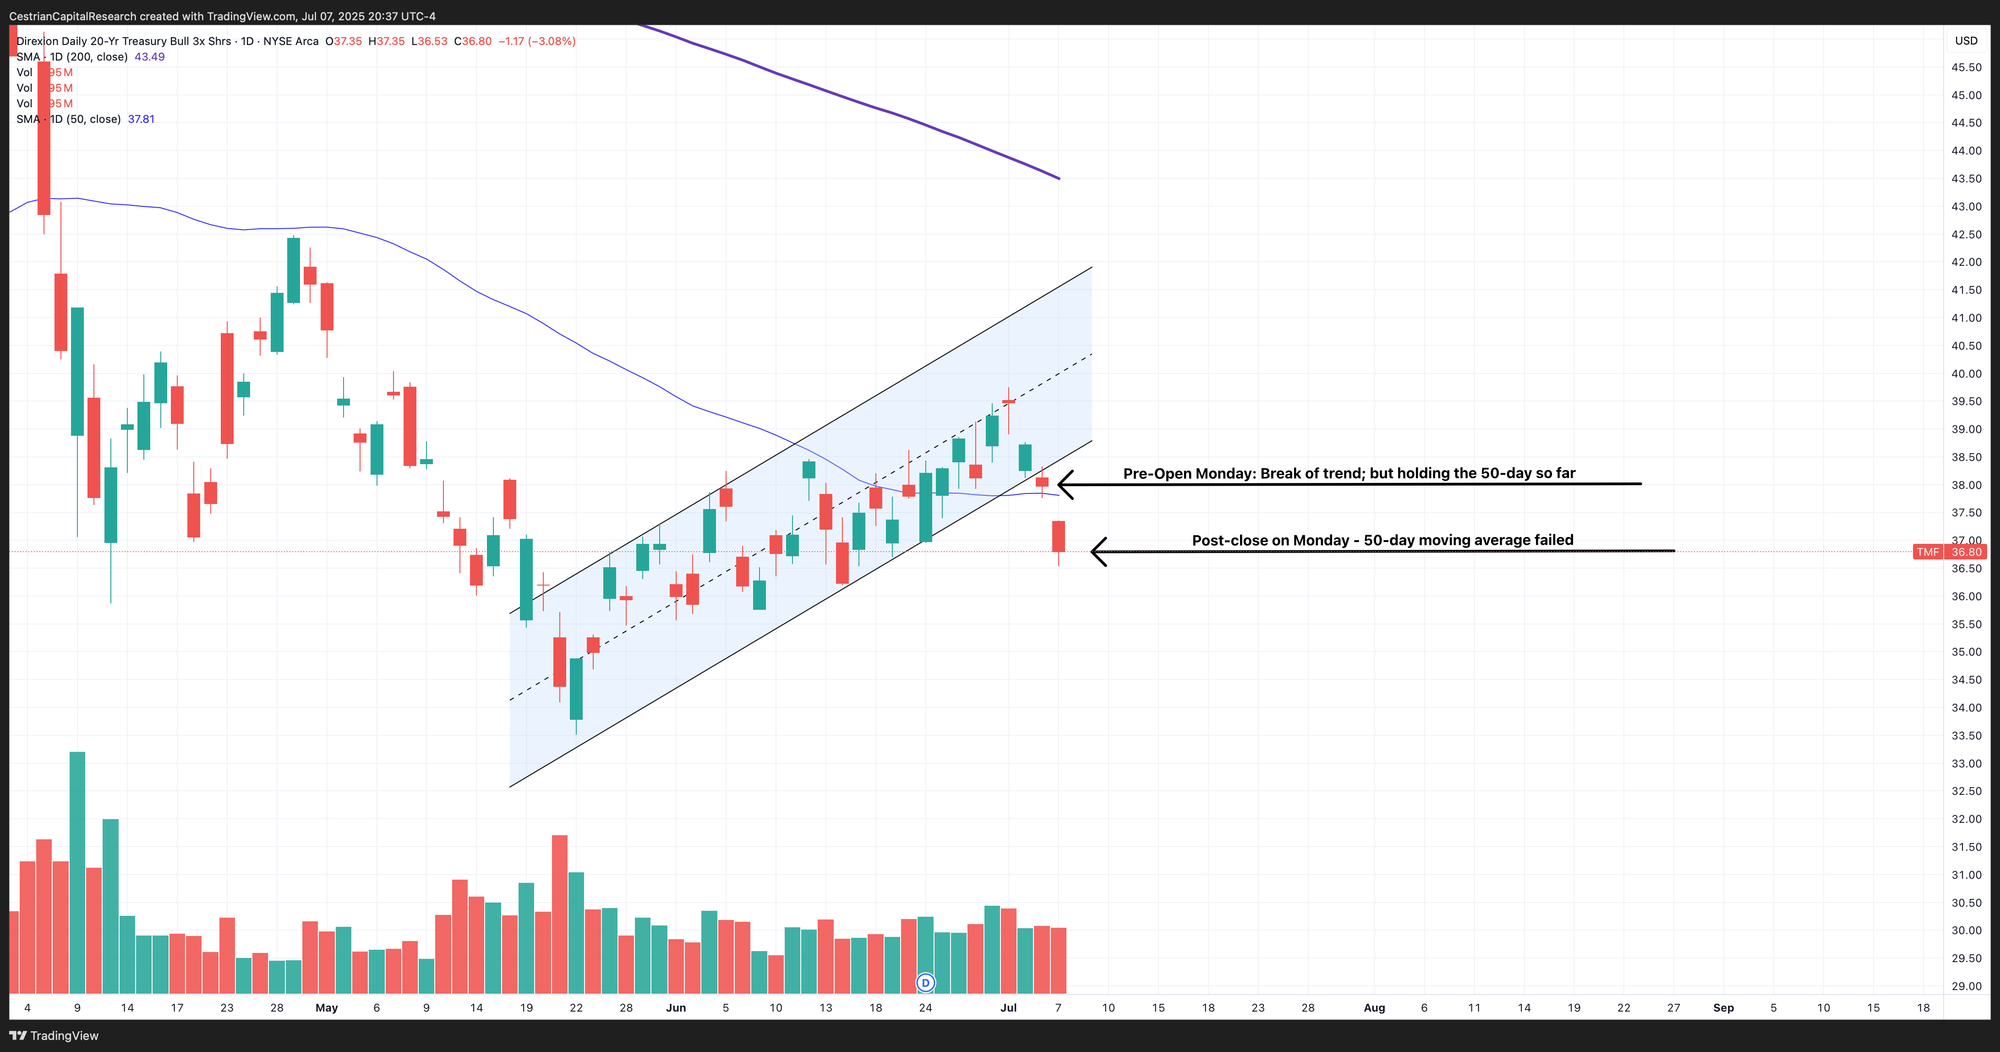
TLT broke its 50-day moving average Monday - that’s not bullish. This is a new chart reflecting that look.
Note - Leveraged ETF. Read the fund documentation if you are considering using this instrument.
Again a weak move in TMF on Monday.
Disclosure: I am unhedged long $TLT, $TMF and similar EU UCITS ETFs.
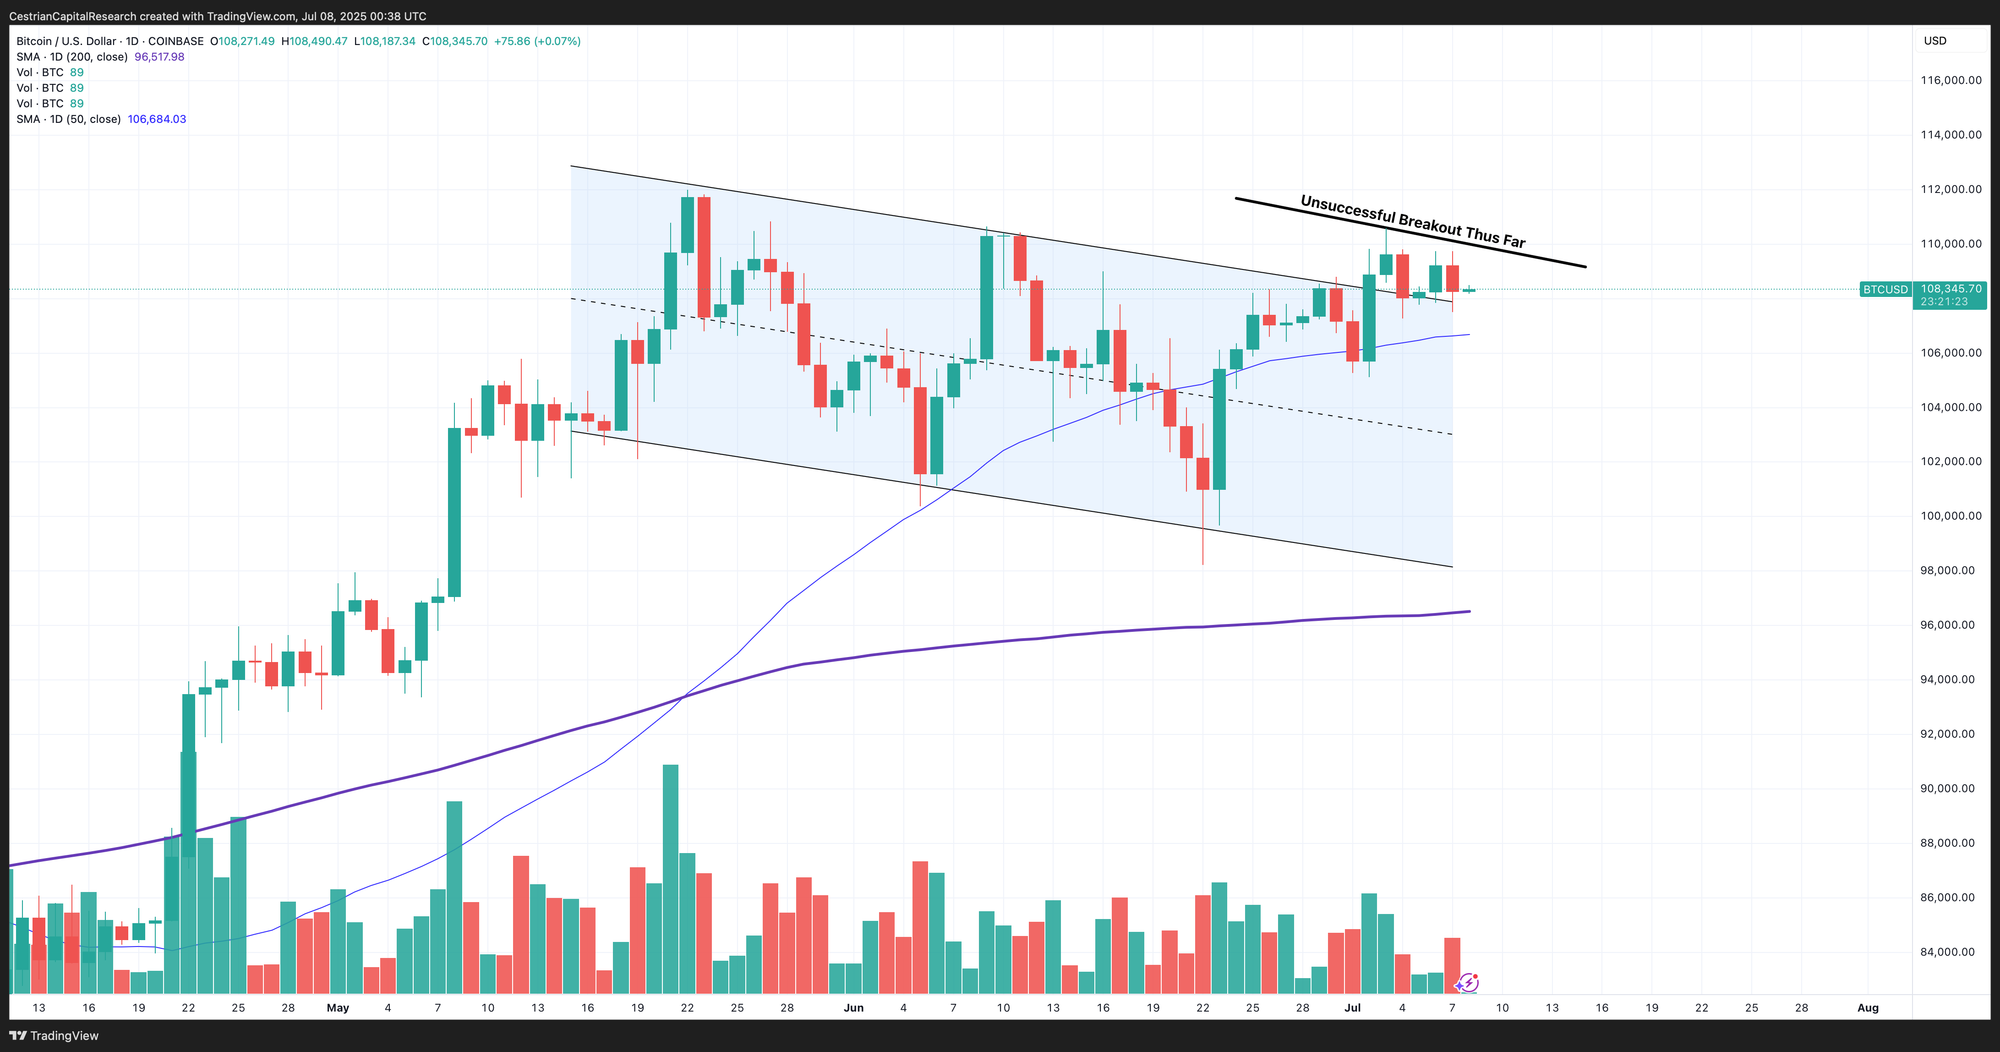
Bitcoin
The 50-day has to hold to remain bullish.
NEW! We now offer Bitcoin risk signals embedded in TrendSpider charts. You can view the Cestrian Algo Store on TrendSpider by clicking below or here.
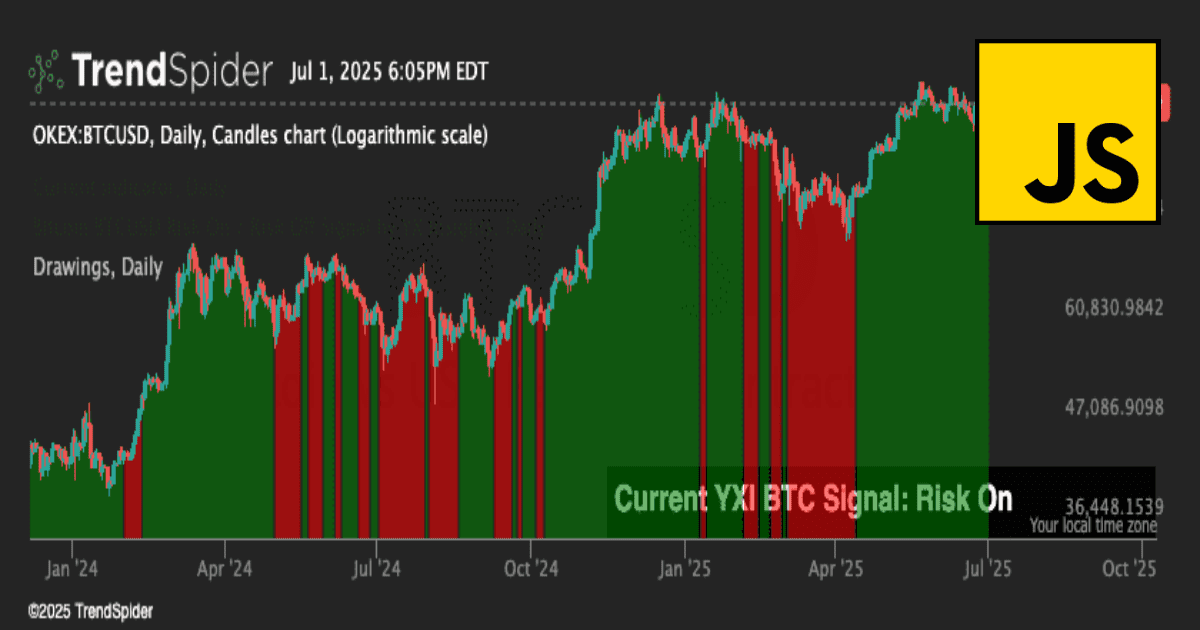
Disclosure - No position in Bitcoin.
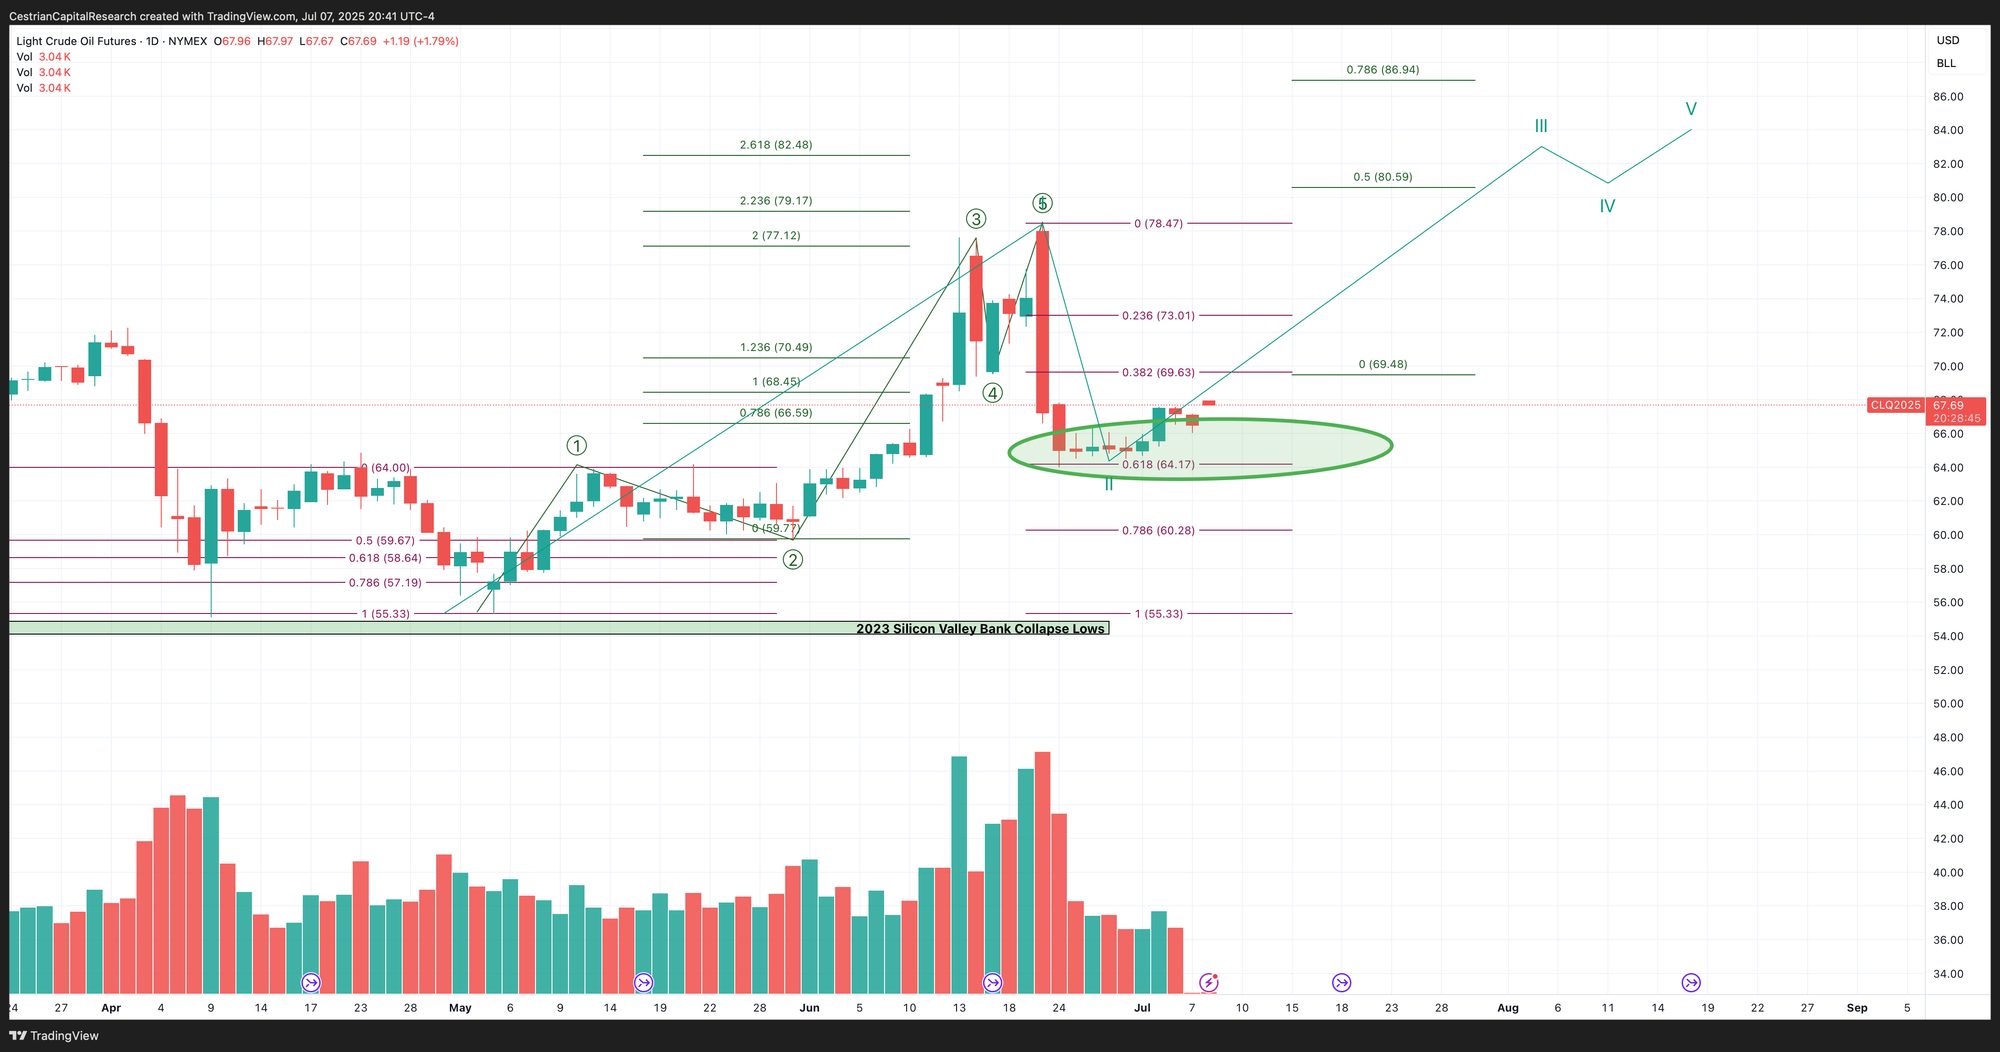
Oil (USO / WTI / UCO)
Up meaningfully on Monday in the absence of real news and in the face of reported rises in OPEC+ production levels.
In securities markets reality reveals itself in what you don’t see. Price moves tell you about the structure beneath.
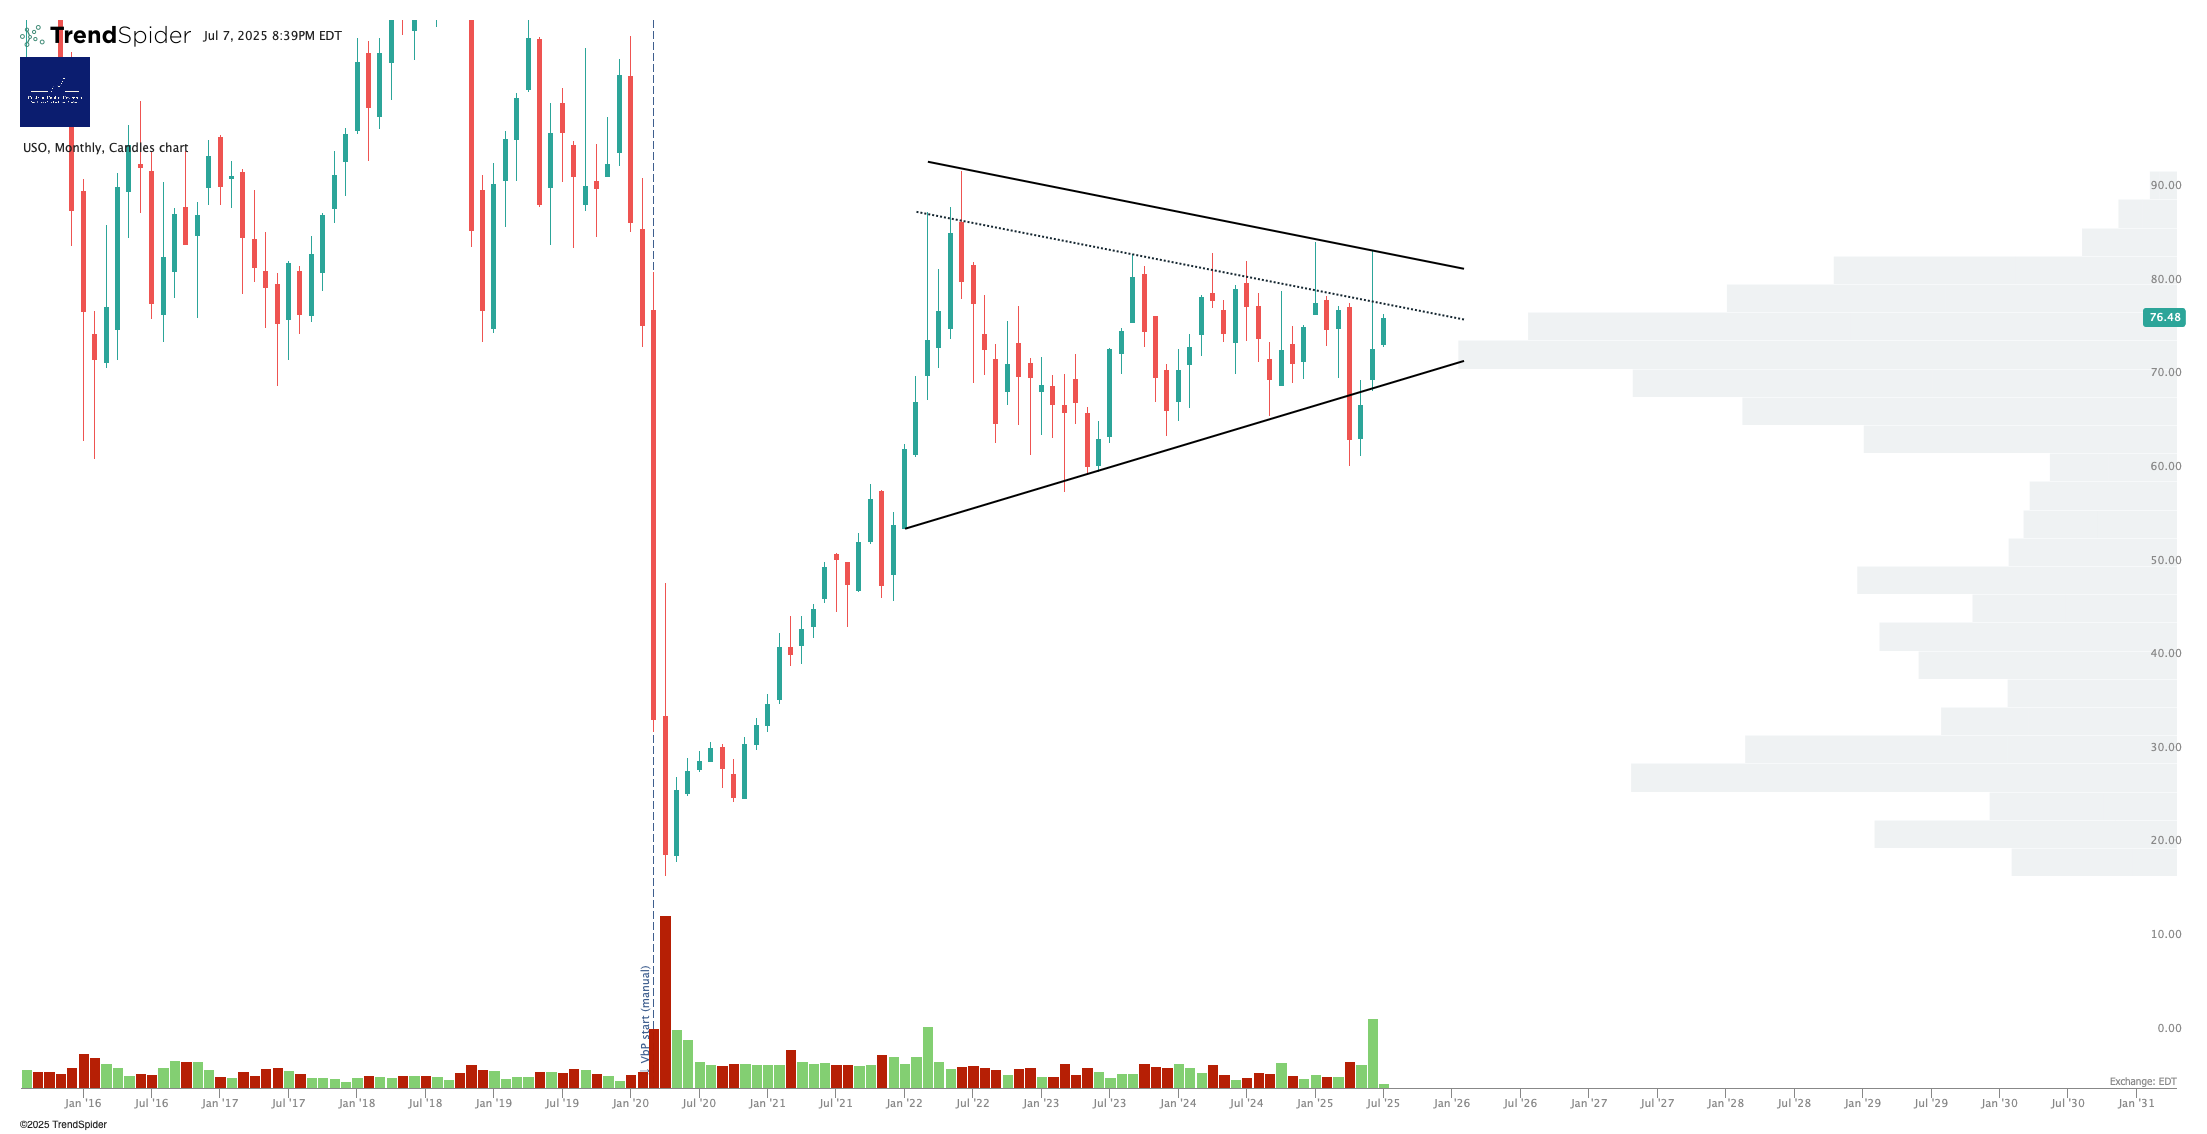
TO REPEAT: As long as $64 holds - which it is, despite talk of further rises in OPEC+ volumes - I think the next major move is up.
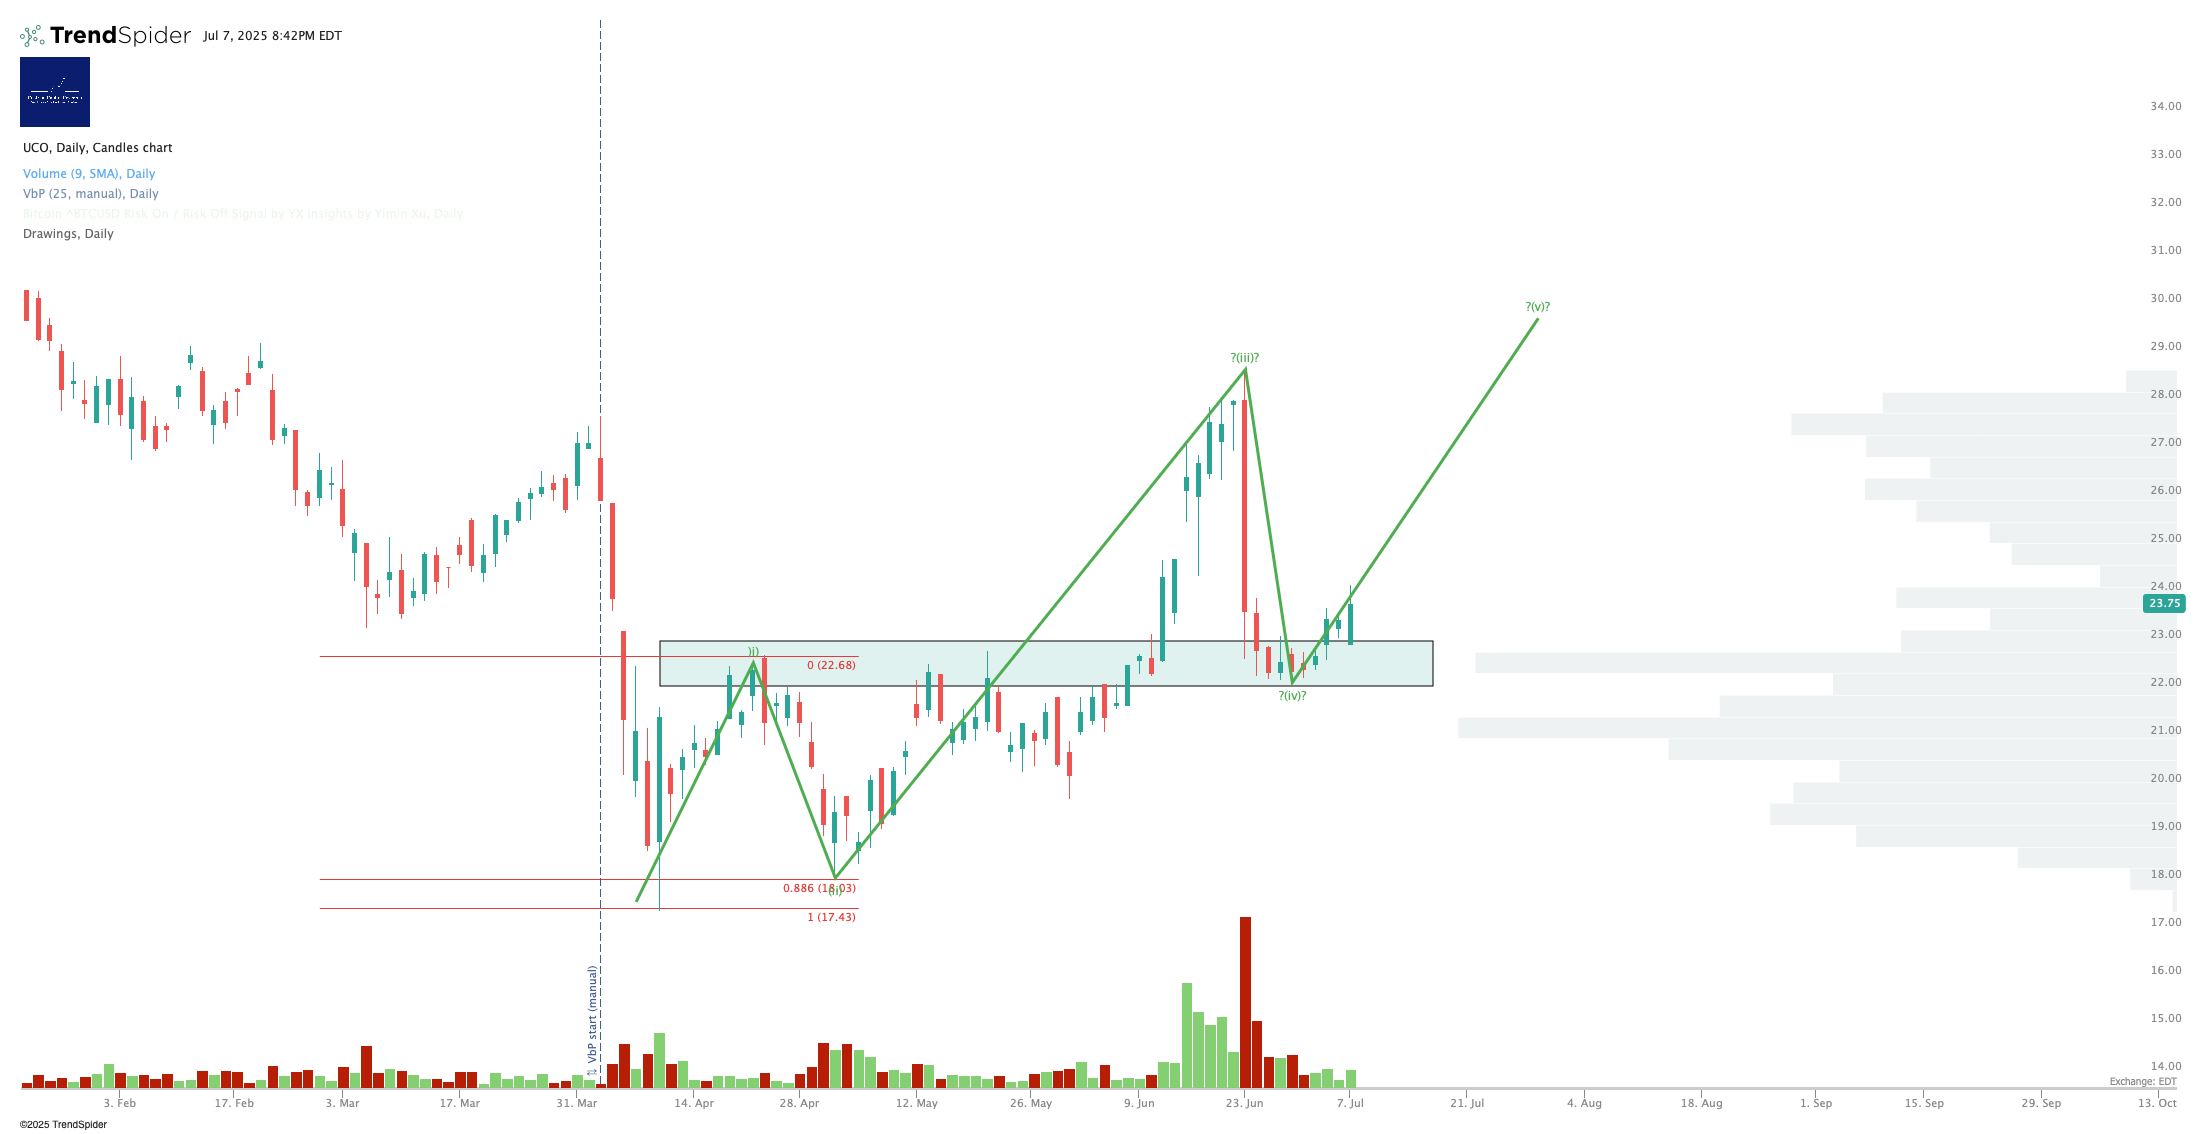
Note - Leveraged ETF. Read the fund documentation if you are considering using this instrument.
A simple bullish chart.
Disclosure: No position in oil.
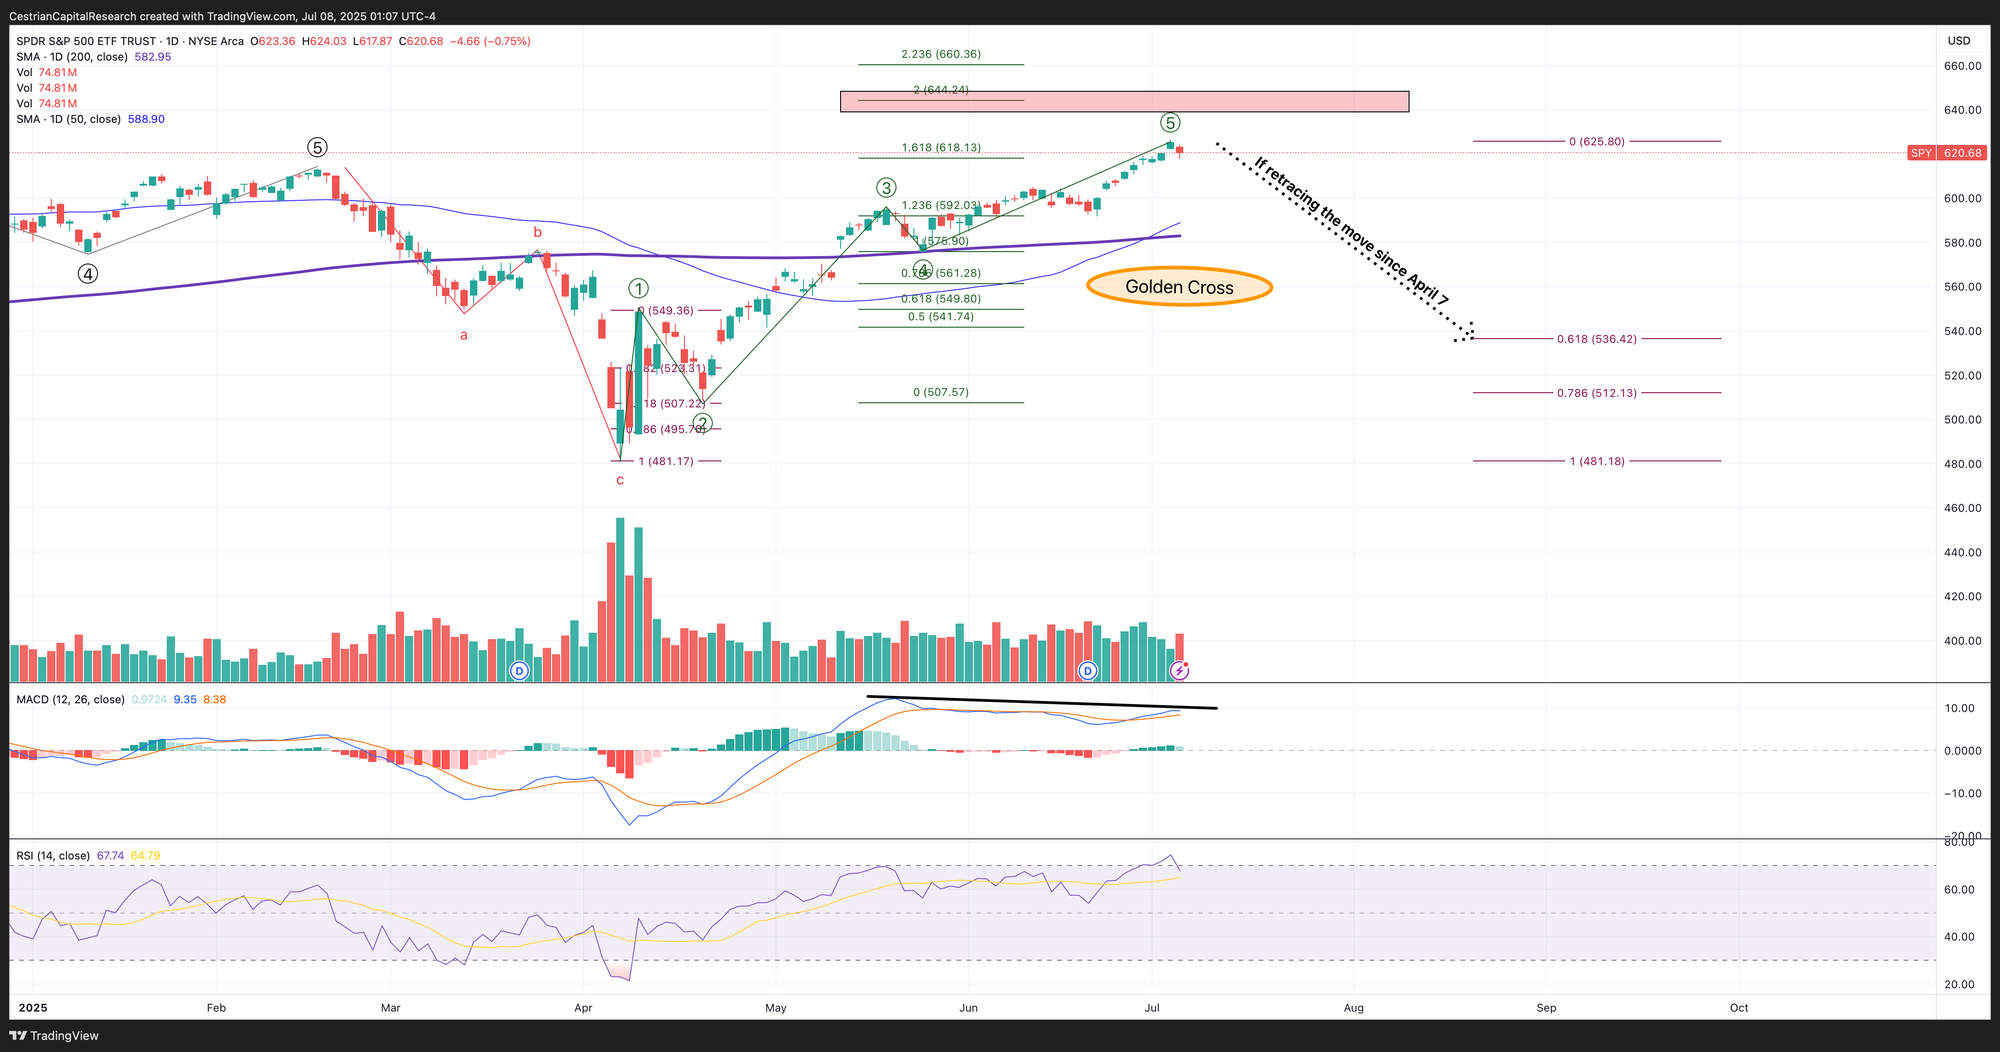
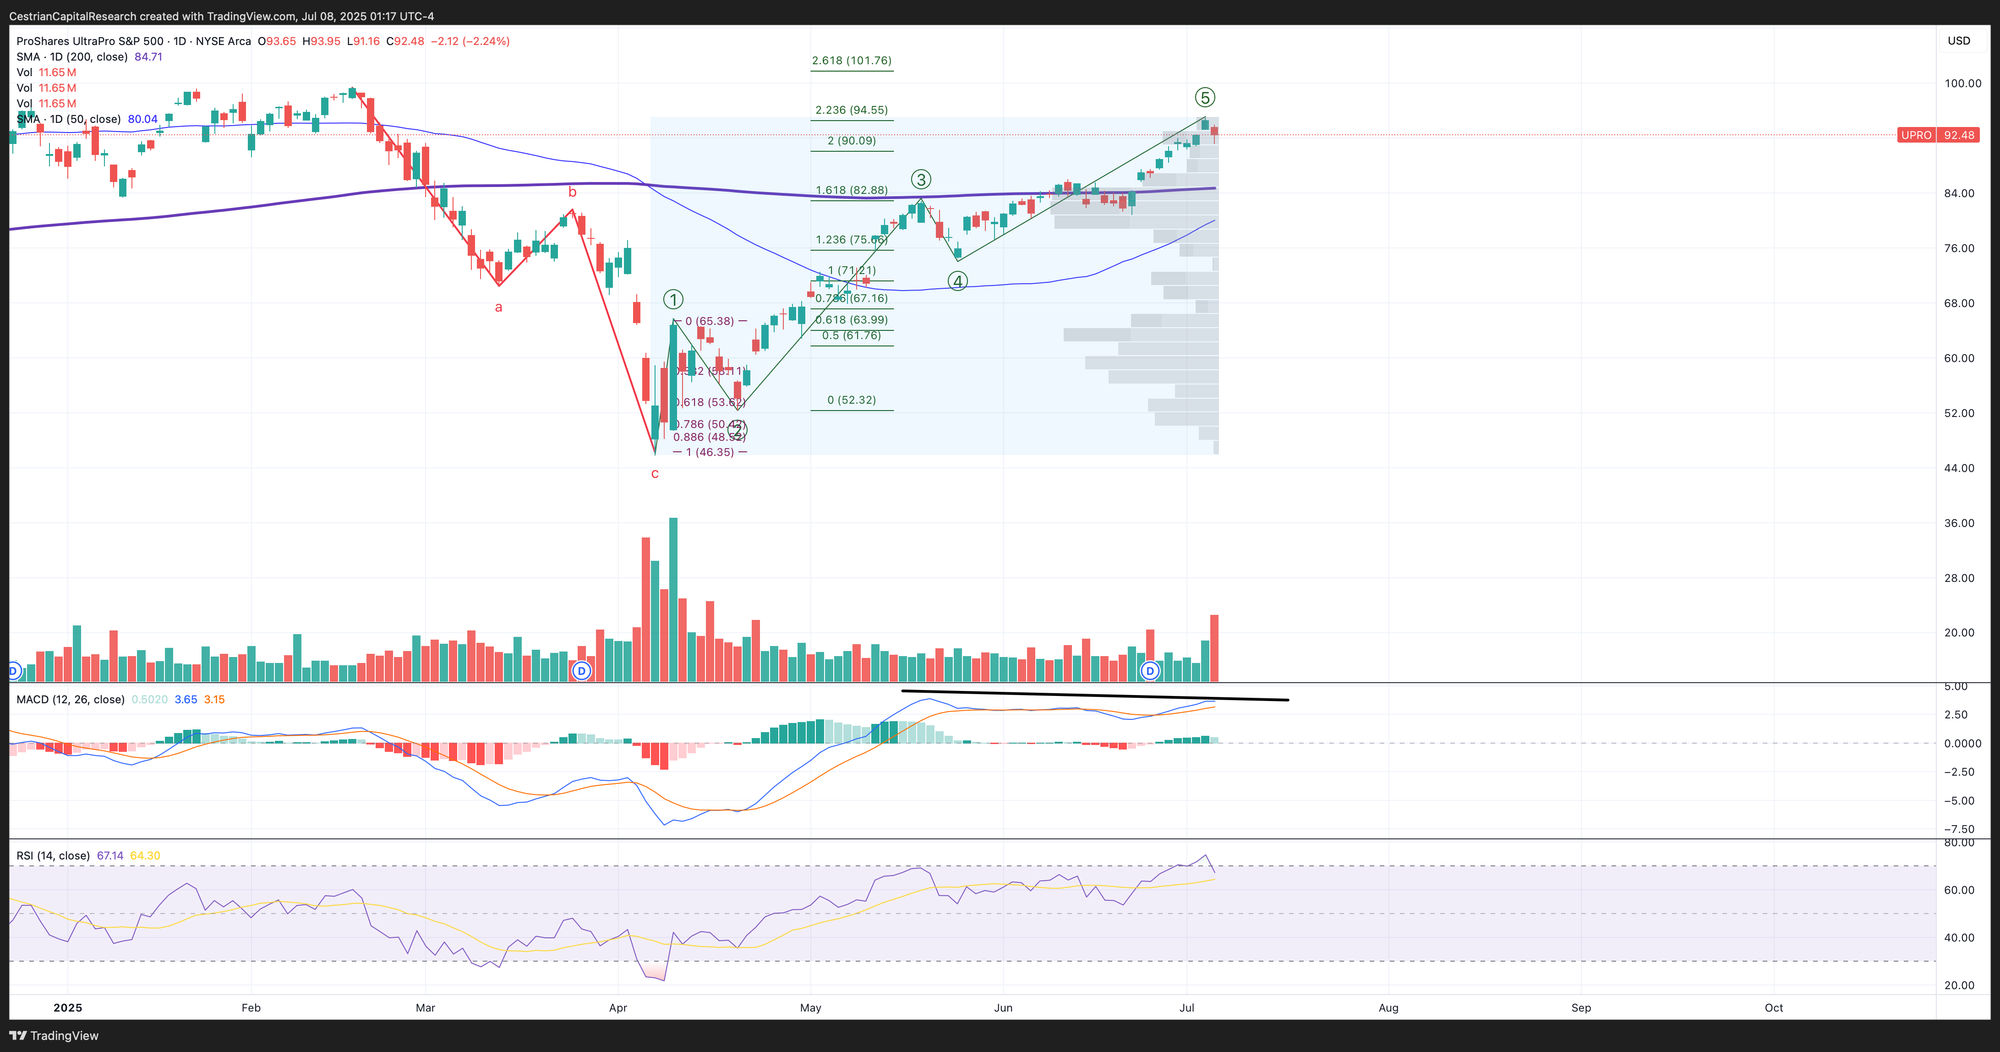
S&P500 / SPY / ES / UPRO
The bull market looks intact on this timeframe. During our live, open-mic Inner Circle webinar yesterday we discussed at length what a correction might look like if it really took hold right now - or indeed what a selldown might look like if the bull has in fact come to a screeching halt. If you’re an Inner Circle subscriber you can find the recording of the session here.
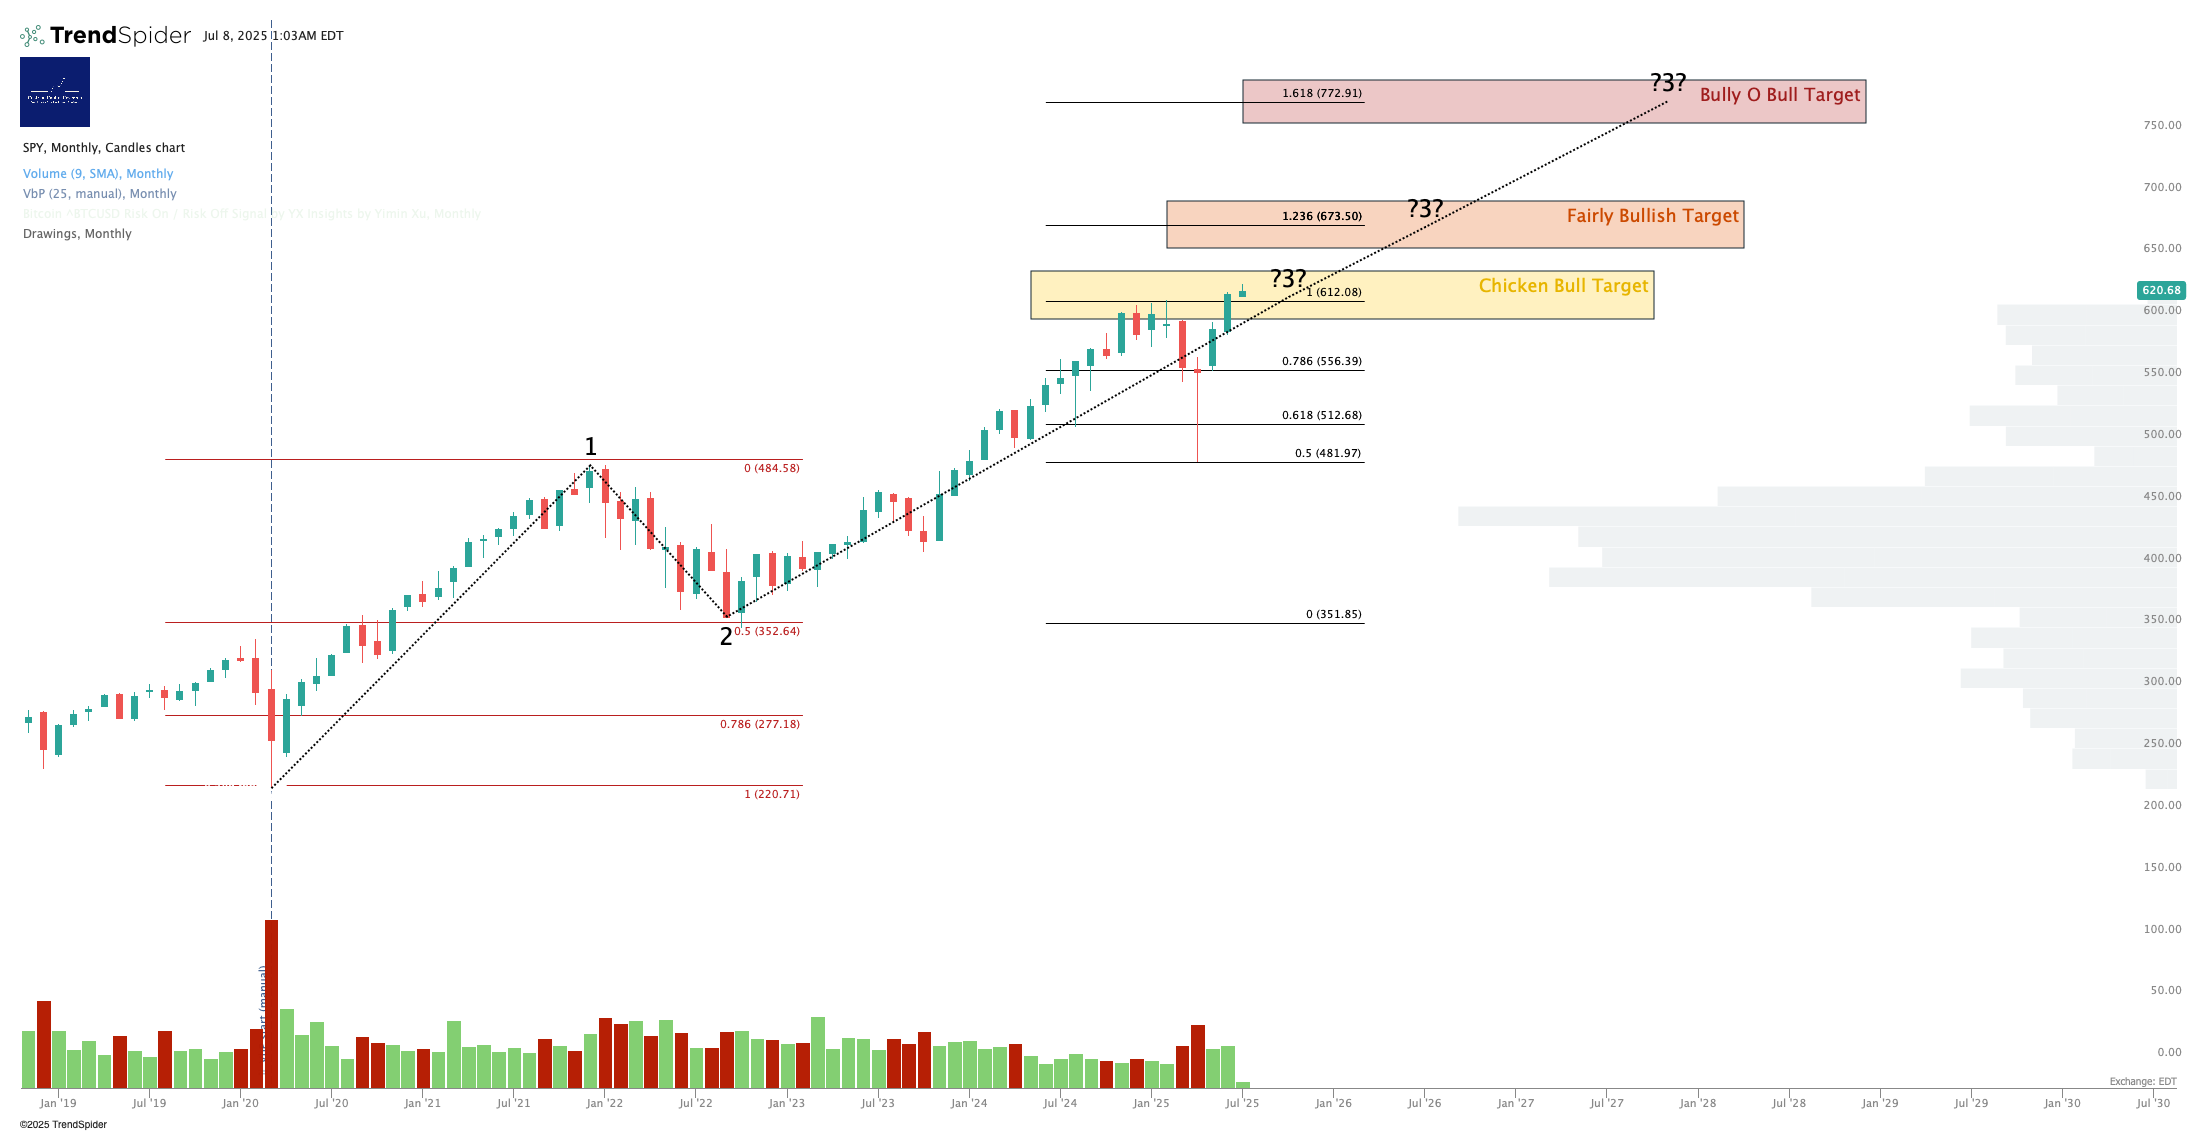
That Golden Cross provides a bullish backdrop and suggests that if we get continued selling, the 50- and then 200-day moving averages have a good chance of acting as support. In case we have a standard retracement of the gains clocked up since the 7 April lows, we may see say a .618 retrace of that move and still be in a bull market - the arrow below points the way in that event.
Note - Leveraged ETF. Read the fund documentation if you are considering using this instrument.
Support at the 50- or 200-day if we have more selling. Breaks the 200-day we can resurrect the saying “nothing good happens below the 200-day”. Remember if you want to hedge UPRO, consider SPXU.
Disclosure: I am long $SPY puts for September expiry.
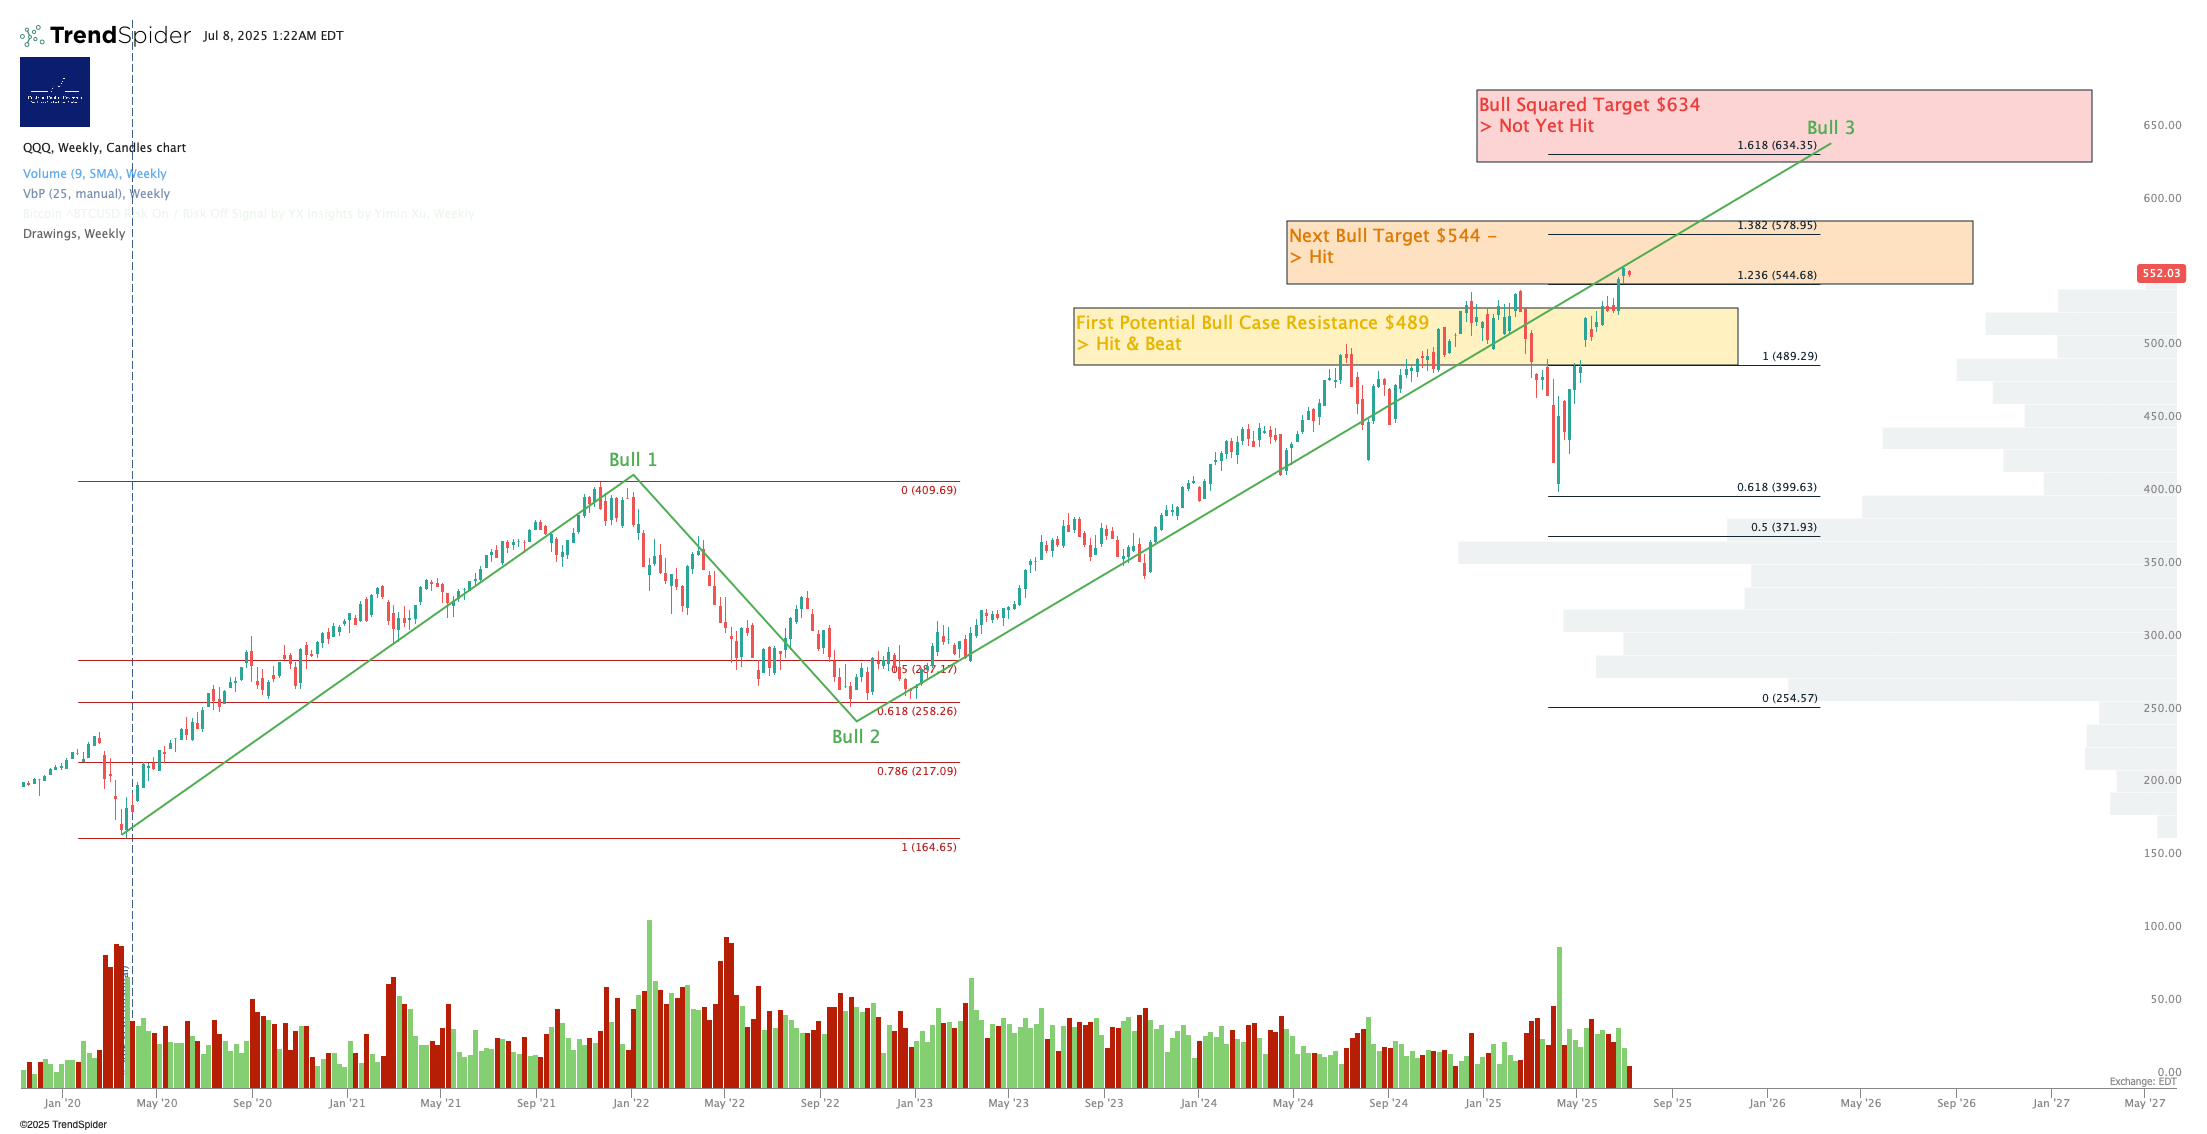
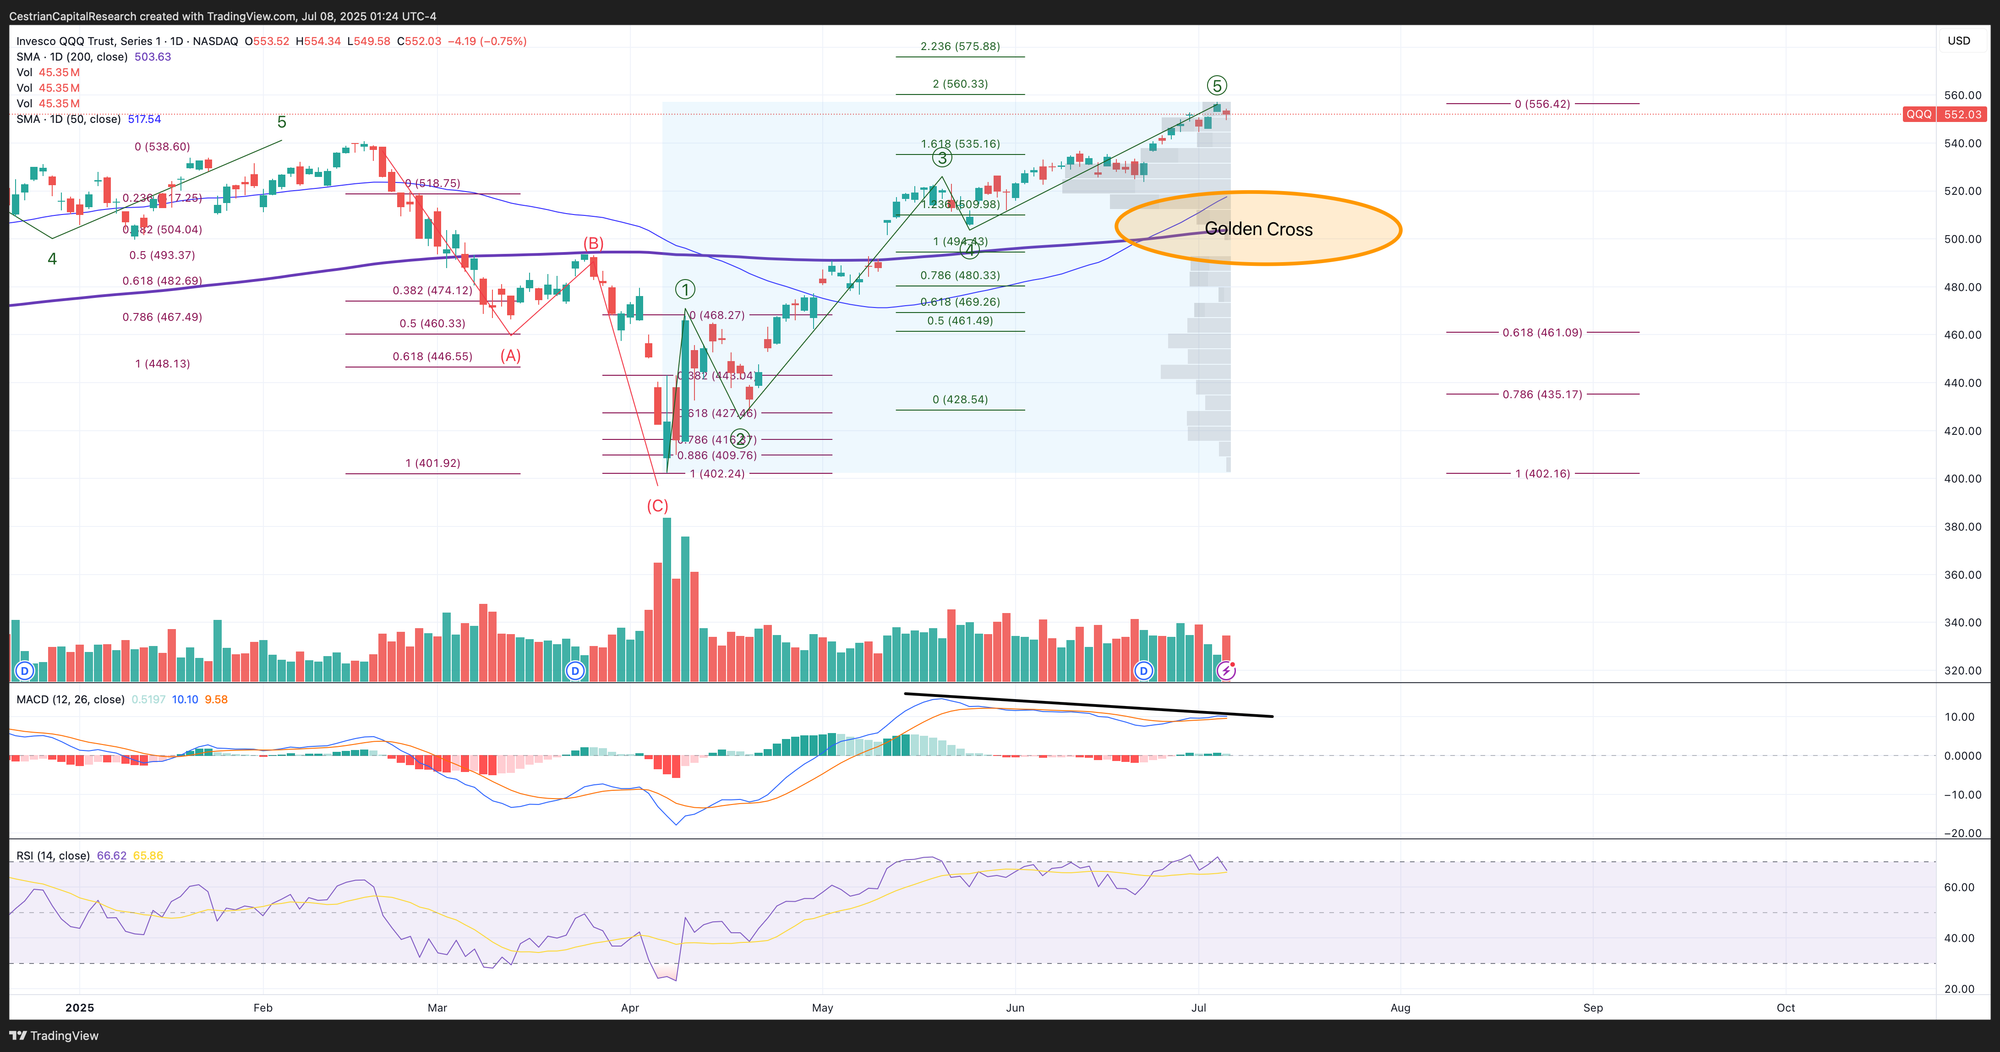
Nasdaq-100 / QQQ / NQ / TQQQ
Note slightly reduced targets with sharpened-up Fib levels. Remains bullish on this timeframe.
Everything about this chart suggests a continuation of selling for a little while, with support to be found at the 50-day most likely (and then the 200-day if that fails). But it’s just a chart and to quote the famous market technician E. Musk, “the most entertaining outcome is the most likely, even if it’s not very entertaining for those most affected”, stocks may also go up. So one has to have a set of tools at the ready to deal with either direction.
These are the tools we use here at Cestrian:

Oh and here’s that QQQ chart.
Note - Leveraged ETF. Read the fund documentation if you are considering using this instrument.
A picture is worth …. maybe a paragraph in this case.
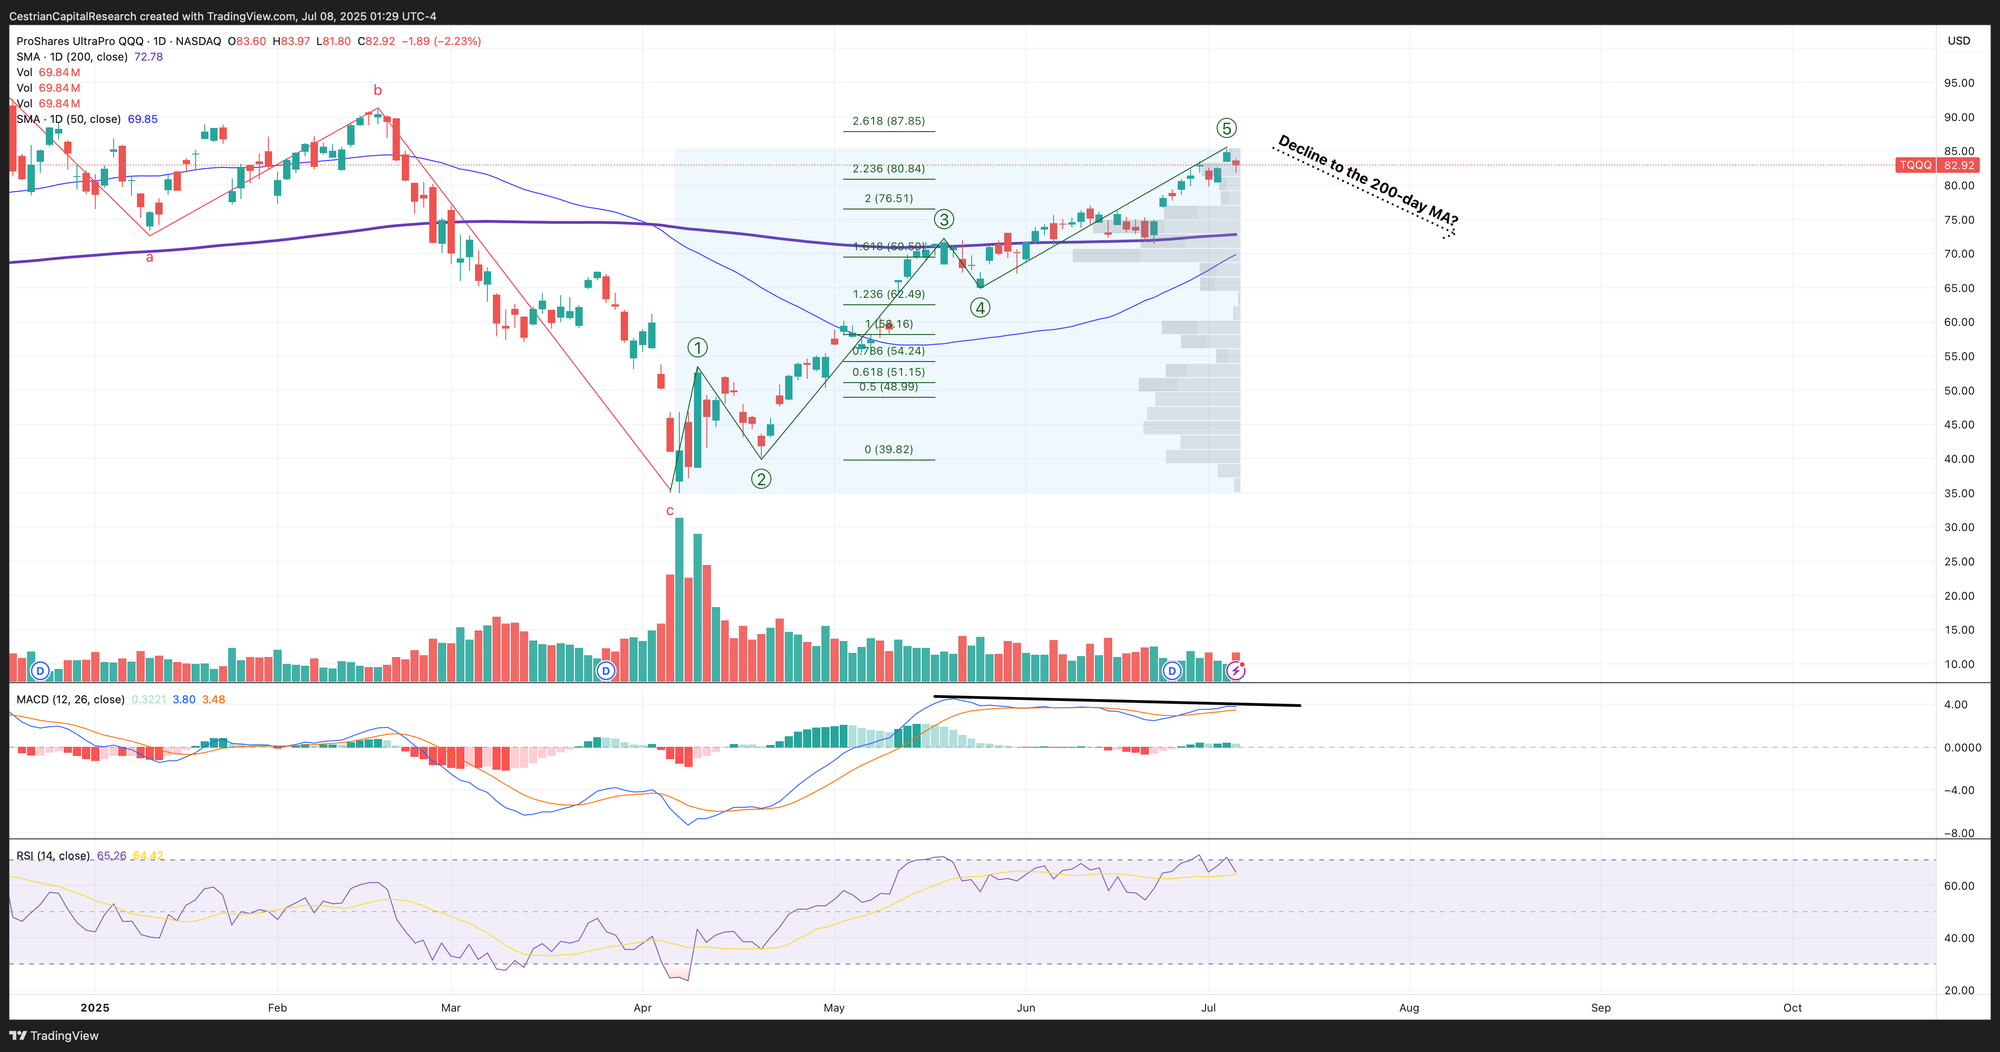
Disclosure: I am hedged 1:1 $TQQQ:$SQQQ and have $QQQ puts for September expiry. Overall broadly neutral the Nasdaq.
The full morning note, available to Inner Circle members, also includes coverage of: DIA, UDOW, XLK, TECL, SOXX, and SOXL.
Alex King, Cestrian Capital Research, Inc - 8 July 2025.
DISCLOSURE - Cestrian Capital Research, Inc staff personal accounts hold long positions in, inter alia, TQQQ, SQQQ, SOXL, SOXS, TLT, TMF, DTLA; also long August SOXS calls and September QQQ and SPY puts.