
The Long Bull Market To Come
Fear is blinding many investors to the opportunity.
DISCLAIMER: This note is intended for US recipients only and, in particular, is not directed at, nor intended to be relied upon by any UK recipients. Any information or analysis in this note is not an offer to sell or the solicitation of an offer to buy any securities. Nothing in this note is intended to be investment advice and nor should it be relied upon to make investment decisions. Cestrian Capital Research, Inc., its employees, agents or affiliates, including the author of this note, or related persons, may have a position in any stocks, security, or financial instrument referenced in this note. Any opinions, analyses, or probabilities expressed in this note are those of the author as of the note's date of publication and are subject to change without notice. Companies referenced in this note or their employees or affiliates may be customers of Cestrian Capital Research, Inc. Cestrian Capital Research, Inc. values both its independence and transparency and does not believe that this presents a material potential conflict of interest or impacts the content of its research or publications.
This Is How We Do Our Work
This note is available to all Inner Circle readers, whether you're a paying member of the service or a free reader of the occasional non-paywalled work here.
If you're yet to join us as a paying member, you can do so right here:
Read on, folks.
1. The Damaging Impact Of Recency Bias
All but the most psychologically robust investors are destined to suffer from recency bias, particularly where actual or potential market crashes are concerned. Twenty-three years on from the dot-com crisis, fears of a repeat of that specific crash continue to haunt investors’ minds. Fifteen years on from the mortgage crisis, investors fear a “2008-style collapse” may be just around the corner.
Investor psychology is mostly defective; because even when a significant correction does take place, most cannot recognize when a bottom is in place and a recovery begins. When corrections hit and risk asset prices drop, the majority of investors simply expect further drops. This is true whether the correction is sharp and deep, as per the drop in equities from the 2019 highs to the March 2020 Covid lows, or whether it is slow but relentless, as was the case in equities during the 2022 rate-hike cycle. Many investors lost money in 2020 and 2021, despite the relentless up-move in risk assets; and many have repeated this mistake in 2023 because they disbelieved that stocks had bottomed as early as May 2022 and were simply waiting for another leg down. When spike lows came along in October 2022 and again in January 2023, fearful investors saw this as confirmation of their expectations and failed to switch out of shorts or cash into long positions. Today many remain disbelieving of the very significant rally in equities this year, despite missing out on real gains that could have been banked.
The weakest of the four US major equity indices - the Russell 2000 - is up slightly on the year, and the strongest - the Nasdaq - is up 40%, in each case on a total return basis.
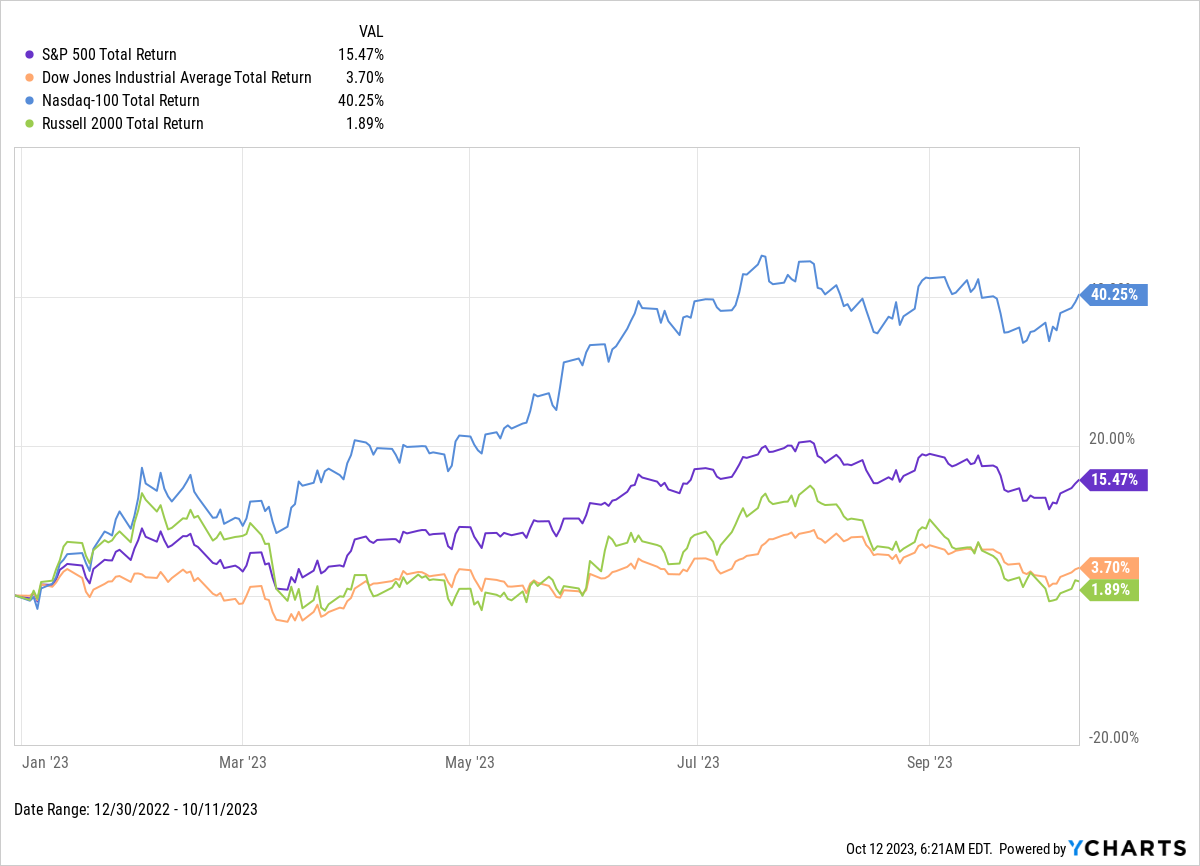
Today there is a strong opinion amongst many investors that the Nasdaq and indeed S&P500 boom this year has been purely due to an “AI bubble” and/or that it is only a handful of stocks that have propelled the indices upwards. These investors believe that the true story is told by the Dow and the Russell, weighed down by troubled old-line and/or financial sector names, and believe that the Nasdaq and the S&P will soon correct back down to the October 2022 lows or lower. They cite rising 10-year US Treasury note yields as evidence of this, and point to the inevitable damage to stocks that will be caused by a sustained inflationary environment.
We believe this take on risk assets is incorrect. The time to be fearful of inflation was when the Fed had yet to raise rates in earnest. The major top struck in equities at the end of 2021 was the moment to take profits and/or open short equity positions.
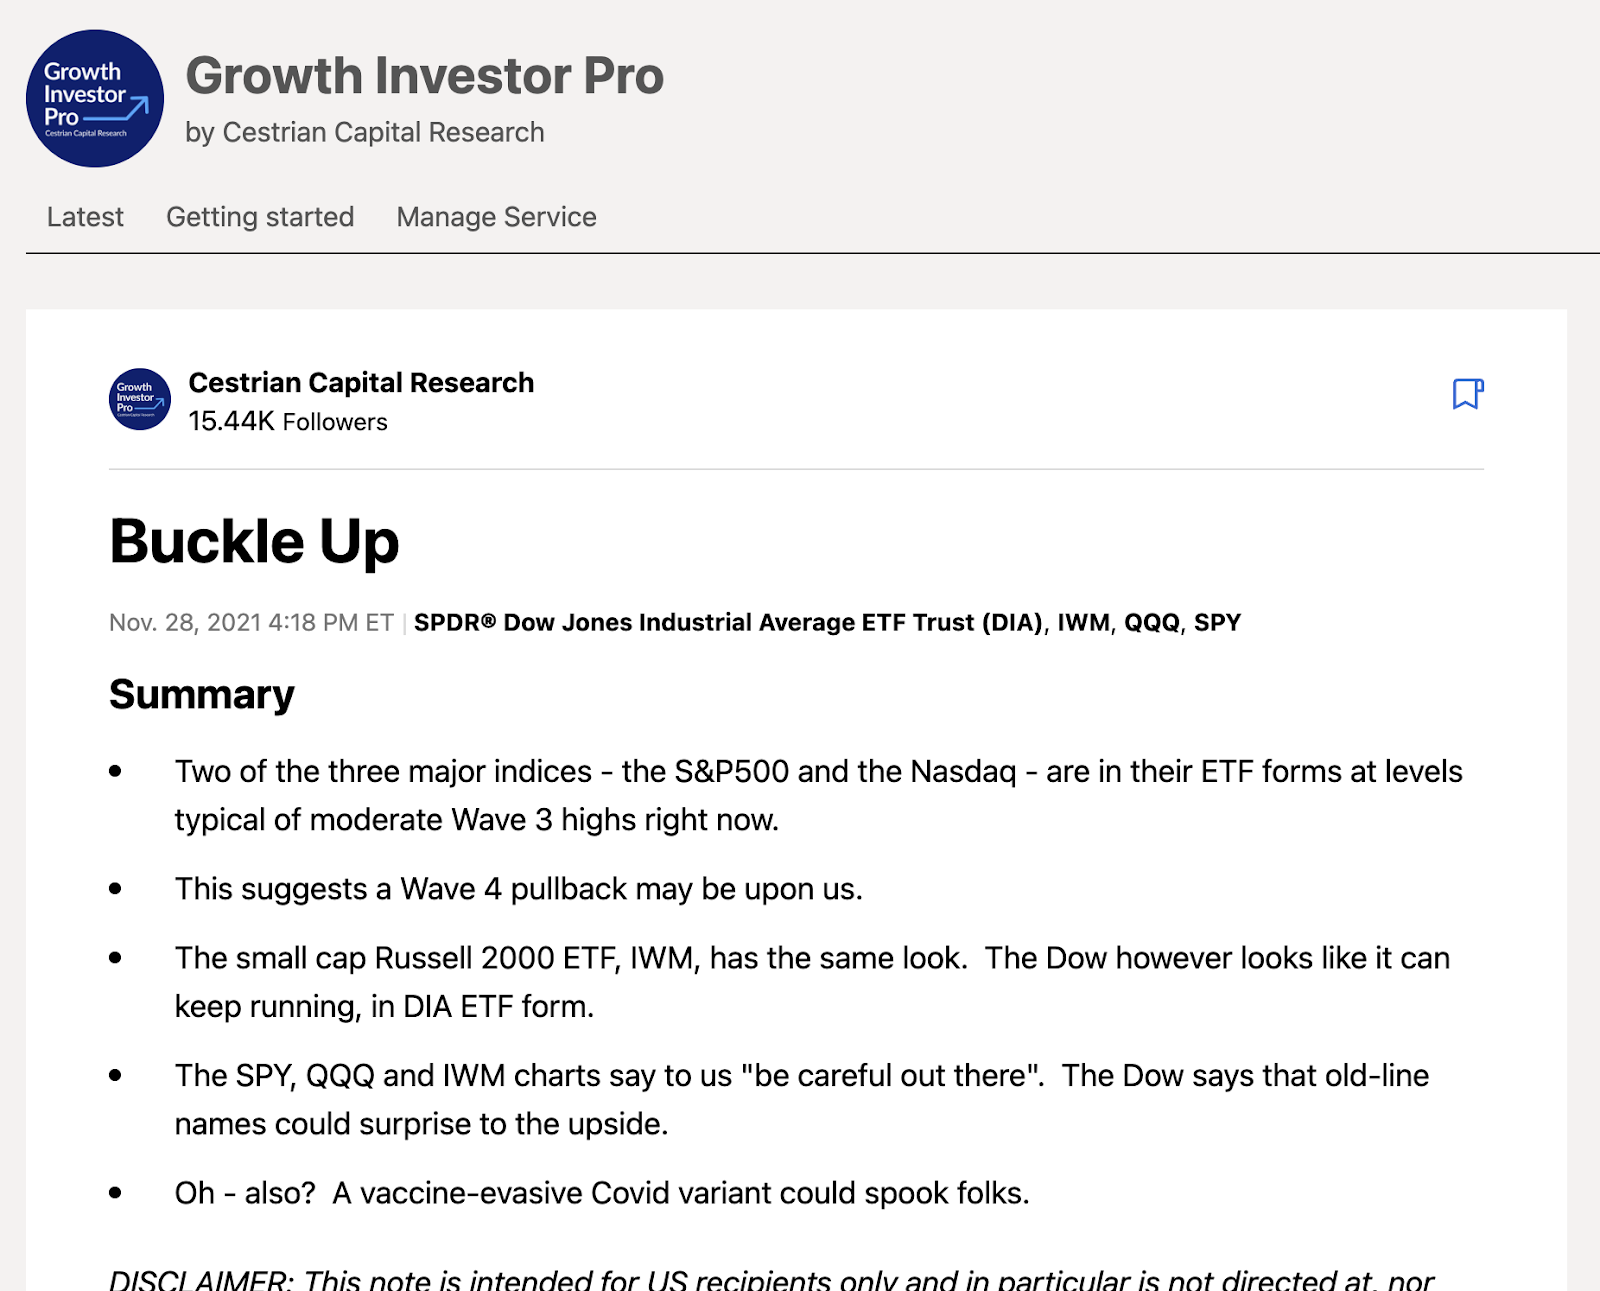
Source: Cestrian Capital Research, November 2021
If you made that call correctly, and acted upon it, our congratulations to you. If you then reversed course late in 2022, you are amongst a handful of truly skilled market operators. If you still believe that risk assets are set to decline? We acknowledge that you could be right - anything can happen in financial markets - but we ask that you consider the following.
2. Risk Asset Prices Are Dependent Variables
One of the reasons that many investors and traders refuse to accept the reality of the market in front of them is that they do not fully understand the drivers of risk asset prices. In the very short term, risk asset prices can be blown thisaway and thataway by any number of eddies in the cosmos. But the most liquid instruments - the S&P500 and the Nasdaq-100 in particular - do move in response to two factors.
The first is exogenous and has to do with the creation of money - still more specifically the creation of credit within monetary policy - and the deployment of that credit in government fiscal policy.
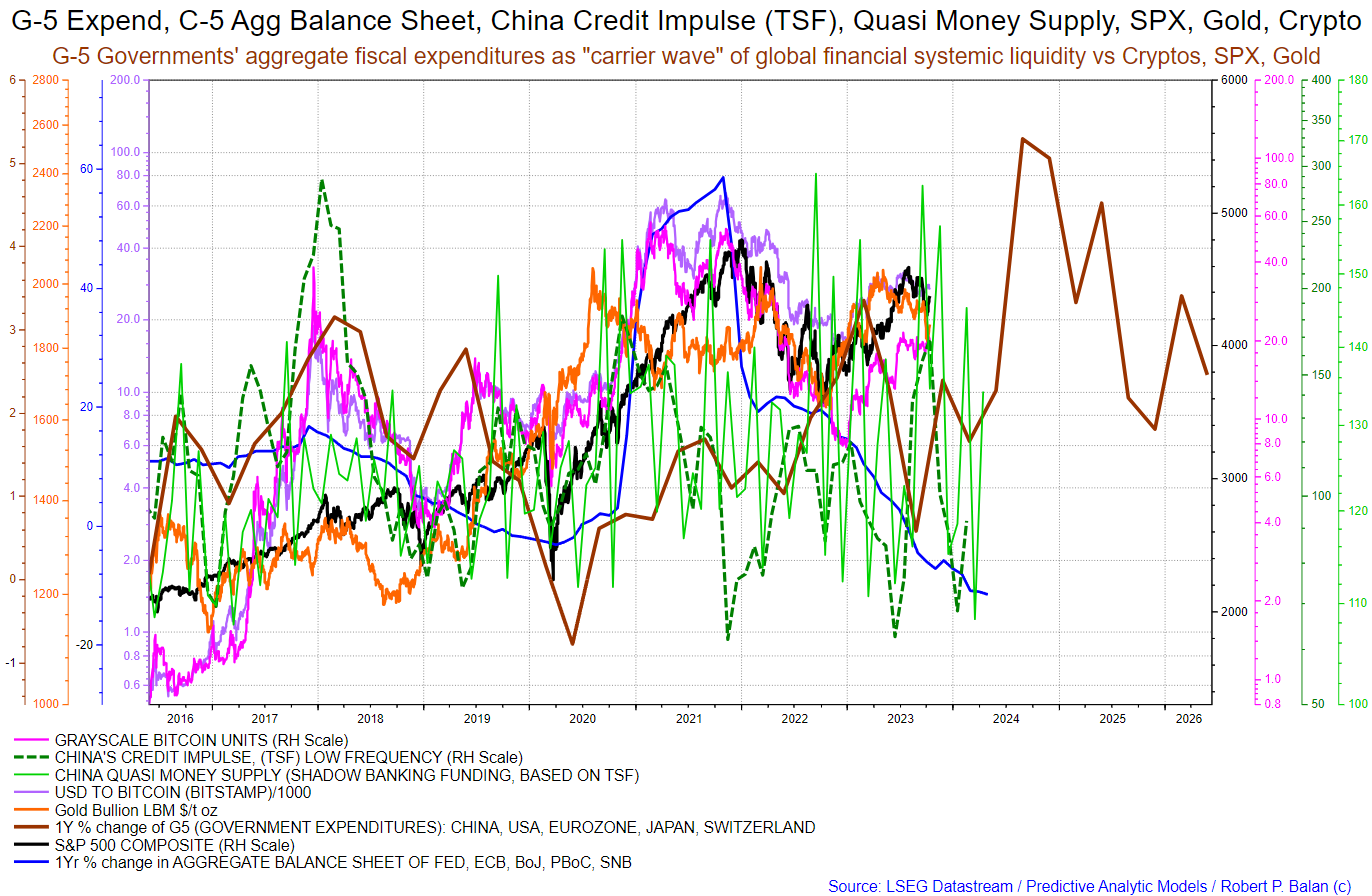
We include below a chart authored by Robert P. Balan and Timothy R. Kiser who lead Predictive Analytic Models, a highly respected research and trading service hosted on the Seeking Alpha platform. (You can read all PAM’s reviews, and sign up for the service, here. )
To understand the chart, read the subheader and then follow its logic. First credit creation, then government expenditure, then liquidity, then risk asset prices. In that order. And you know this to be true if you think about it for a moment. When governments slow credit creation, reduce or slow the growth of the money supply, and cut fiscal expenditure, risk asset prices fall. And the converse is also true. These effects are lagged and therefore not immediately obvious, but if you sit back and look, you can see it.
The second factor has to do with the shorter term. The apparently random walk nature of securities pricing can be navigated using technical analysis; in our own work we favor the Elliott Wave and Fibonacci technical method - specifically because it provides tools with which to assess the likely direction (up or down) and degree (large or small price change) of securities prices, with reference only to the prior movement of those same prices. The deeper you push a beach ball into the water, the faster it will resurface; and the further you stretch an elastic band, the more rapidly it will snap back into shape. This action-and-reaction is the basis of the Elliott Wave and Fibonacci method, and we find it works well.
3. Inflation Is Good News For Risk Assets
Many investors today have become fearful of inflation. This is an incorrect assessment, at least as regards the levels of inflation seen in recent times (hyperinflation in failing nation-states being a different matter altogether).
We live in a nominal world. We are all paid in nominal monies; we pay our bills in nominal amounts; the assets we own are valued in nominal terms. All prices you see quoted for labor or capital are nominal, ie. inclusive of inflation. The lesson from history is not that inflation is bad for equities pricing; the lesson from history is that late and overly rapid central bank policy response to inflation can deliver a shock to equities pricing. If inflation has risen uncontained by the Federal Funds Rate, which is then yanked upwards on the double, equities pricing will take a hit. If disinflation (ie. a reduction in the rate at which prices are rising) is underway and the Federal Funds Rate has yet to adjust down, once it does, equities pricing is likely to jump up. As investors we should not fear inflation - we should embrace it. Inflation is good news for risk assets. Here’s the last ten years of US CPI, the Nasdaq ETF $QQQ on a total return basis, and the overnight Fed Funds Rate.
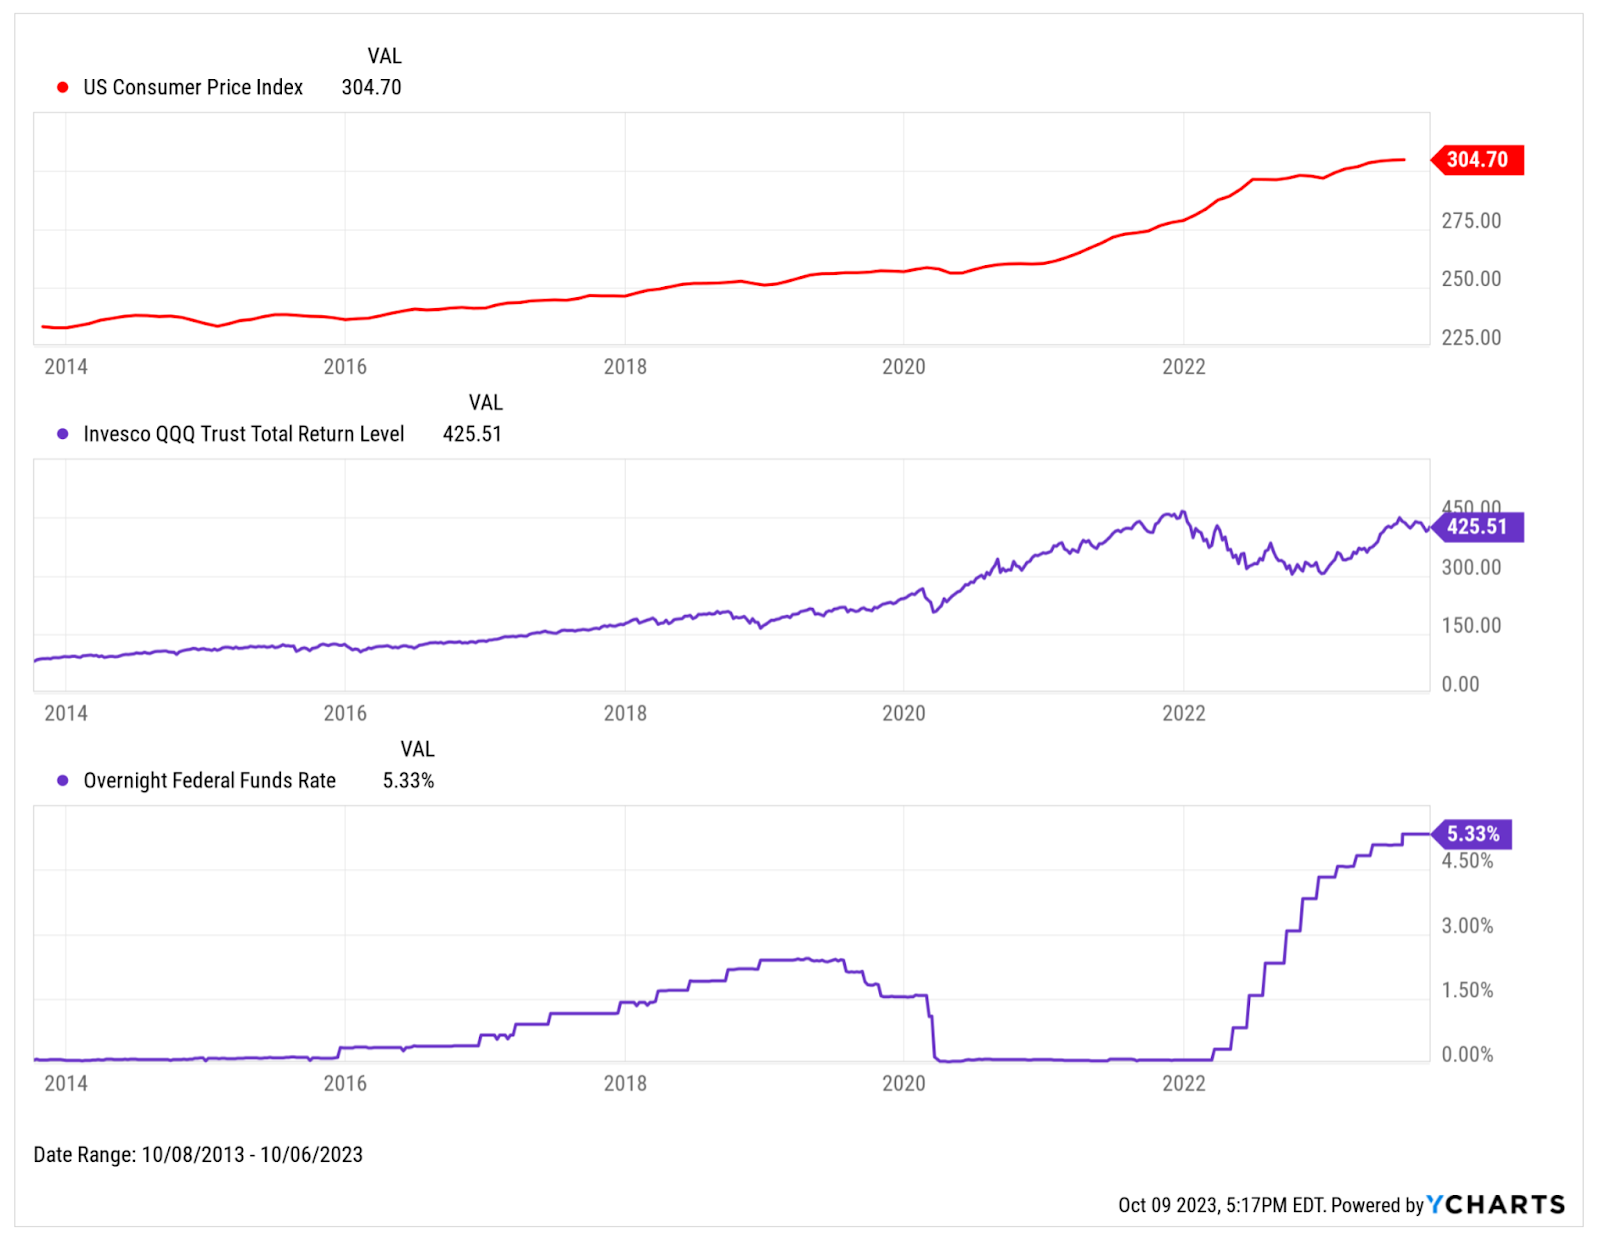
The slow drift up in the US CPI level from 2014-2019 was accompanied by a slow drift up in the QQQ. Inflation accelerated in 2020-2021, as did the QQQ total return level, whilst the Fed Funds Rate dropped to zero or close thereto. During 2022, the Fed Funds Rate was hiked quickly; the CPI level started to grow more slowly; QQQ declined. In 2023 the Fed Funds Rate began to rise more slowly; inflation fell (but prices were still rising); QQQ is up strongly.
Whilst US CPI growth is likely to slow, major corporate earnings will continue to benefit from the accelerated inflation that has taken place from early 2020. For instance, Microsoft (MSFT) isn’t about to reduce its prices - it will continue to raise them - but it will find that it can hire employees at not-higher rates of pay from a few months ago. It will also be applying constant downward pressure on its real estate and telecoms fees and on any other line item where those suppliers are price-takers. As a result, Microsoft earnings are likely to benefit from the difference between their pricing power on the revenue line, and price-setting power in their cost base. All other things being equal, earnings growth is likely to benefit the stock price.
The picture is rosier still for indebted corporations such as Intel (INTC). Debt and debt service costs aren’t nominal; they don’t rise with inflation. Debt is priced and serviced in real terms. If corporate earnings - specifically the cash available for debt service - is growing due to inflation, but the cash cost of debt service remains the same, then the corporation will deleverage faster as a result of inflation. Thus inflation is good for levered balance sheets which again, all other things being equal, is good for the stock price. (The lower the debt load, the more of the enterprise value is comprised of the market capitalization; so if EV is flat, market cap must be up, and absent wanton stock issuance, so too must be the stock price).
4. Reflation Is A Winning Opportunity For Longs
Inflation running at a steady clip is, all other things, good news for equity prices. We believe that the current reflationary cycle - where the cost of labor and capital goods is likely to continue to rise, in contrast to the deflation of labor and capital goods prices that took place in the West during the globalization era - is likely a positive backdrop. We do not believe that the Fed is going to continue to raise rates at anything like the speed seen in 2022 and, perhaps, it may not raise rates at all going forward. Fed Funds Futures - which can be wrong of course - are pricing in two rate cuts in 2024. That would be an accelerant to equity prices should it happen. But even with a flat Fed Funds Rate (no rate cuts) and modest but continuing rates of inflation, we anticipate strong growth in corporate earnings and a sustained appetite for the equities issued by those corporates (since the earnings per share available is likely to rise) amongst large account players.
It is possible that the March 2020 equity market lows, which coincided with the launch point for increased rates of inflation, will come to represent the beginning of a new and long bull market in equities. Initial over-exuberance in equity pricing, resulting from a near-zero cost of capital available to the largest investors which transmitted extreme risk appetite to smaller players (low trading volumes at the top of the 2021 peak indicate only small account players were transacting up there), gave way to a typical correction down into the 2022 lows. Buying volumes were high in the major US equity indices from Q2 2022 onwards, indicating large account accumulation in the last 18 months or so. Technical analysis of multiple equity indices and indeed sector ETFs suggest that we may now be in the early stages of a larger-degree Wave Three up, which if the usual technical patterns are followed may see QQQ run all the way to the mid-600s (from the current $366 and change) before a Wave 4 correction and then a final Wave 5 higher. If this analysis is in any way correct, the timeline may be measured in years not months.
Here’s a speculative take on what this may look like. (You can open a full page version of this chart, here).
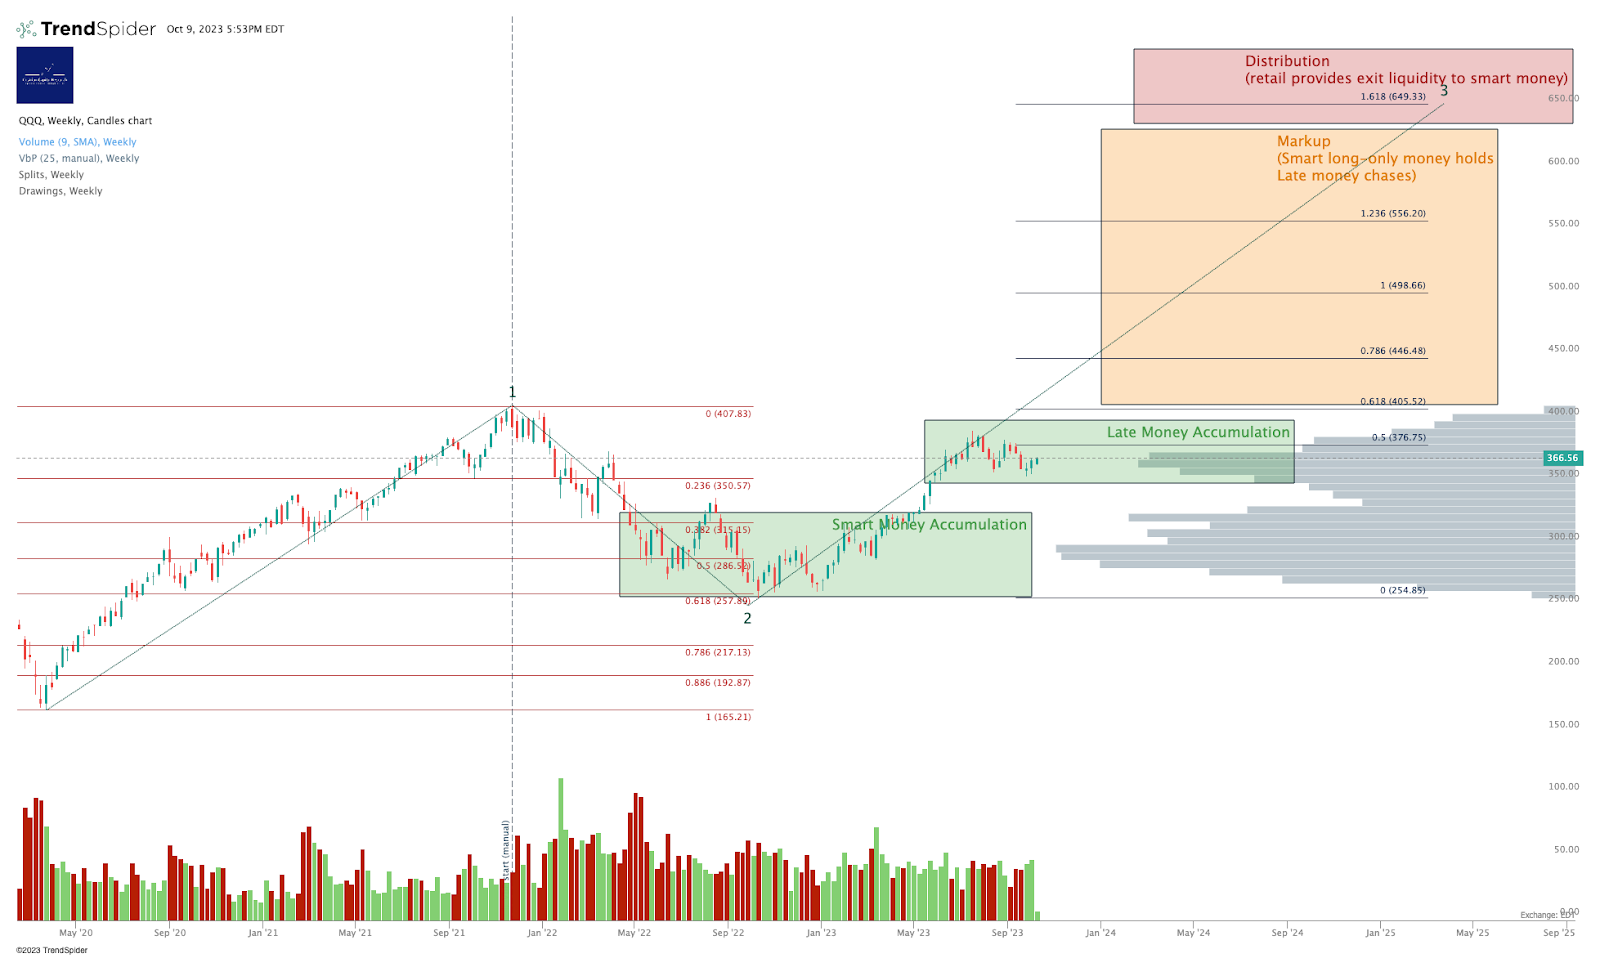
A QQQ target in the 600s looks preposterous today. But bull markets always look preposterous when viewed from the ground floor, and always look obvious in retrospect. (Just as bear markets look impossible when atop the roof, but obvious when one is back down on the ground floor once more).
5. Finally, To Execute Well, Using Hedging And Over-Hedging Can Maximize Gains And Protect Against Pilot Error
The truly wise investor, in our view, must utilize hedging if they are to maximize profits and minimize risk in markets. The most eloquently constructed argument in the world about what markets will and will not do does not, as we all know, last more than five minutes when punched in the mouth by reality. Markets will do what markets will do.
We believe that the most effective way to play the reflation cycle is:
- Decide on a larger-degree direction you believe to be most likely - we say that is up. We can call this the dominant direction. And if you believe the dominant direction is up, you may set your holdings to be long the major equity indices. This can be done with simple ETFs - the QQQ example above, for instance - with levered ETFs (such as QLD, a 2x daily QQQ instrument, or TQQQ, a 3x daily QQQ instrument) - and/or with futures or options, depending on your choice of poison.
- When the market trends against your choice of dominant direction, use inverse positions to generate gains on the way down. We believe the dominant direction is up, so for us, the inverse positions would be short. Again this can be done using simple short ETF positions, inverse ETFs, levered inverse ETFs, futures or options.
- When the counter-trend is close to exhaustion, take profits on that countertrend instrument, and roll the profits back into additional allocations of the dominant trend instrument. In the example above you might open a new SQQQ position as the market rolled over; sell SQQQ as the market bottomed; then take the cashed profits and use them to buy additional units of TQQQ.
- Then sell all the dominant direction position once a major top is reached. Your choice of timeframe, your choice of risk level.
Hedging offers many benefits in our view.
- One, it enables you to maximize profits by cashing gains in both directions.
- Two, if you choose the dominant direction incorrectly, hedging immediately puts a stop to the growing losses, and over-hedging (being net weighted in what turns out to be the direction you should have picked in the first place) will mean you make gains not losses.
- Three, if using portfolio margin accounts, it can free up margin capital to be used profitably elsewhere. (Use of leverage of any kind is, of course, a major amplifier of risk, and is to be done only with great care and with plentiful reserves on the side lest trouble strike).
Alex King, Cestrian Capital Research, Inc.
With thanks to Robert P. Balan and to @Lowerlightbebeaming, a contributing author to the PAM service specializing in hedged trading..
Learn More
Alex King is the founder and CEO of Cestrian Capital Research, Inc, an SEC-regulated independent equity research business. You can learn more about Cestrian here.