
The Rally, Crack'd?
DISCLAIMER: This note is intended for US recipients only and, in particular, is not directed at, nor intended to be relied upon by any UK recipients. Any information or analysis in this note is not an offer to sell or the solicitation of an offer to buy any securities. Nothing in this note is intended to be investment advice and nor should it be relied upon to make investment decisions. Cestrian Capital Research, Inc., its employees, agents or affiliates, including the author of this note, or related persons, may have a position in any stocks, security, or financial instrument referenced in this note. Any opinions, analyses, or probabilities expressed in this note are those of the author as of the note's date of publication and are subject to change without notice. Companies referenced in this note or their employees or affiliates may be customers of Cestrian Capital Research, Inc. Cestrian Capital Research, Inc. values both its independence and transparency and does not believe that this presents a material potential conflict of interest or impacts the content of its research or publications.
Indices In “Not Only-Up” Shocker
The S&P500 and Nasdaq delivered a nothingburger of a day overall today; the Russell rediscovered its appetite for basement dwelling. Let's take a look at where the indices stand after the close. Today’s post is free for all to read - if you’d like these notes daily, just sign up for a Premium or Pro subscription here at Cestrian Market Insight.
Real Time
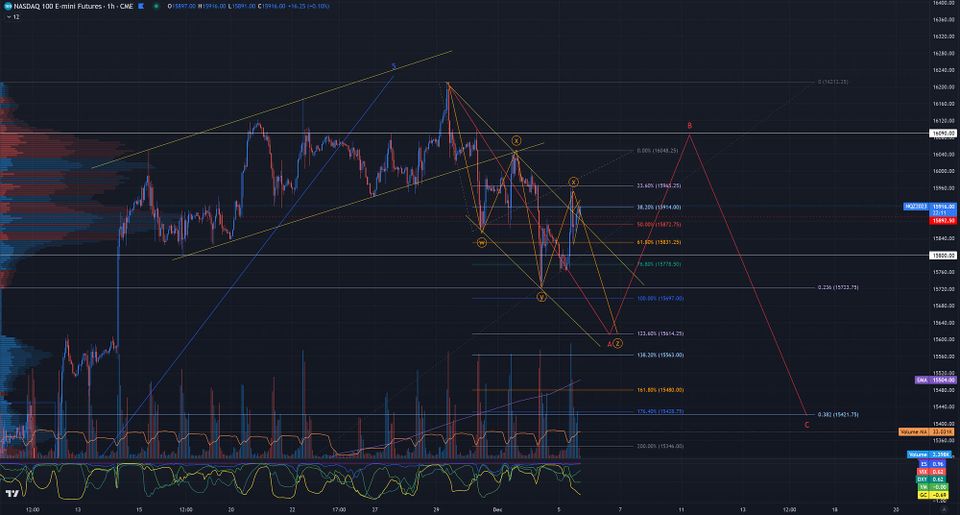
We also, by the way, are off to a rip-roaring start with our two new real-time trading services. Trading With Van and Trading Gains run live on our platform and are operated by two whip-smart technical analysts who spend all day in pursuit of the twists and turns in the S&P500 and the Nasdaq-100. You can use their work to try to profit from ETFs or futures, depending on your preference; neither has any kind of directional bias but will instead highlight long and short opportunities as the market dictates. Here’s something from Trading Gains just now:

Gains explains:
- “Nasdaq is forming a downward channel (A leg) and is showing weakness overall with other indexes following suit.
- Price action has been aggressive but the bears are coming out to sell the top. The bulls will have a hard time breaking through the upper channel without a catalyst”.
Want to trade with Gains? Learn more by just clicking HERE.
Any difficulties signing up for either service, or if you have any questions whatsoever, you can reach us using this contact form - we'll get right back to you.
Back To Basics
OK, here goes with our market charts for after the close on Tuesday 5 December.
Note - to open full-page versions of these charts, just click on the chart headings, which are hyperlinks.
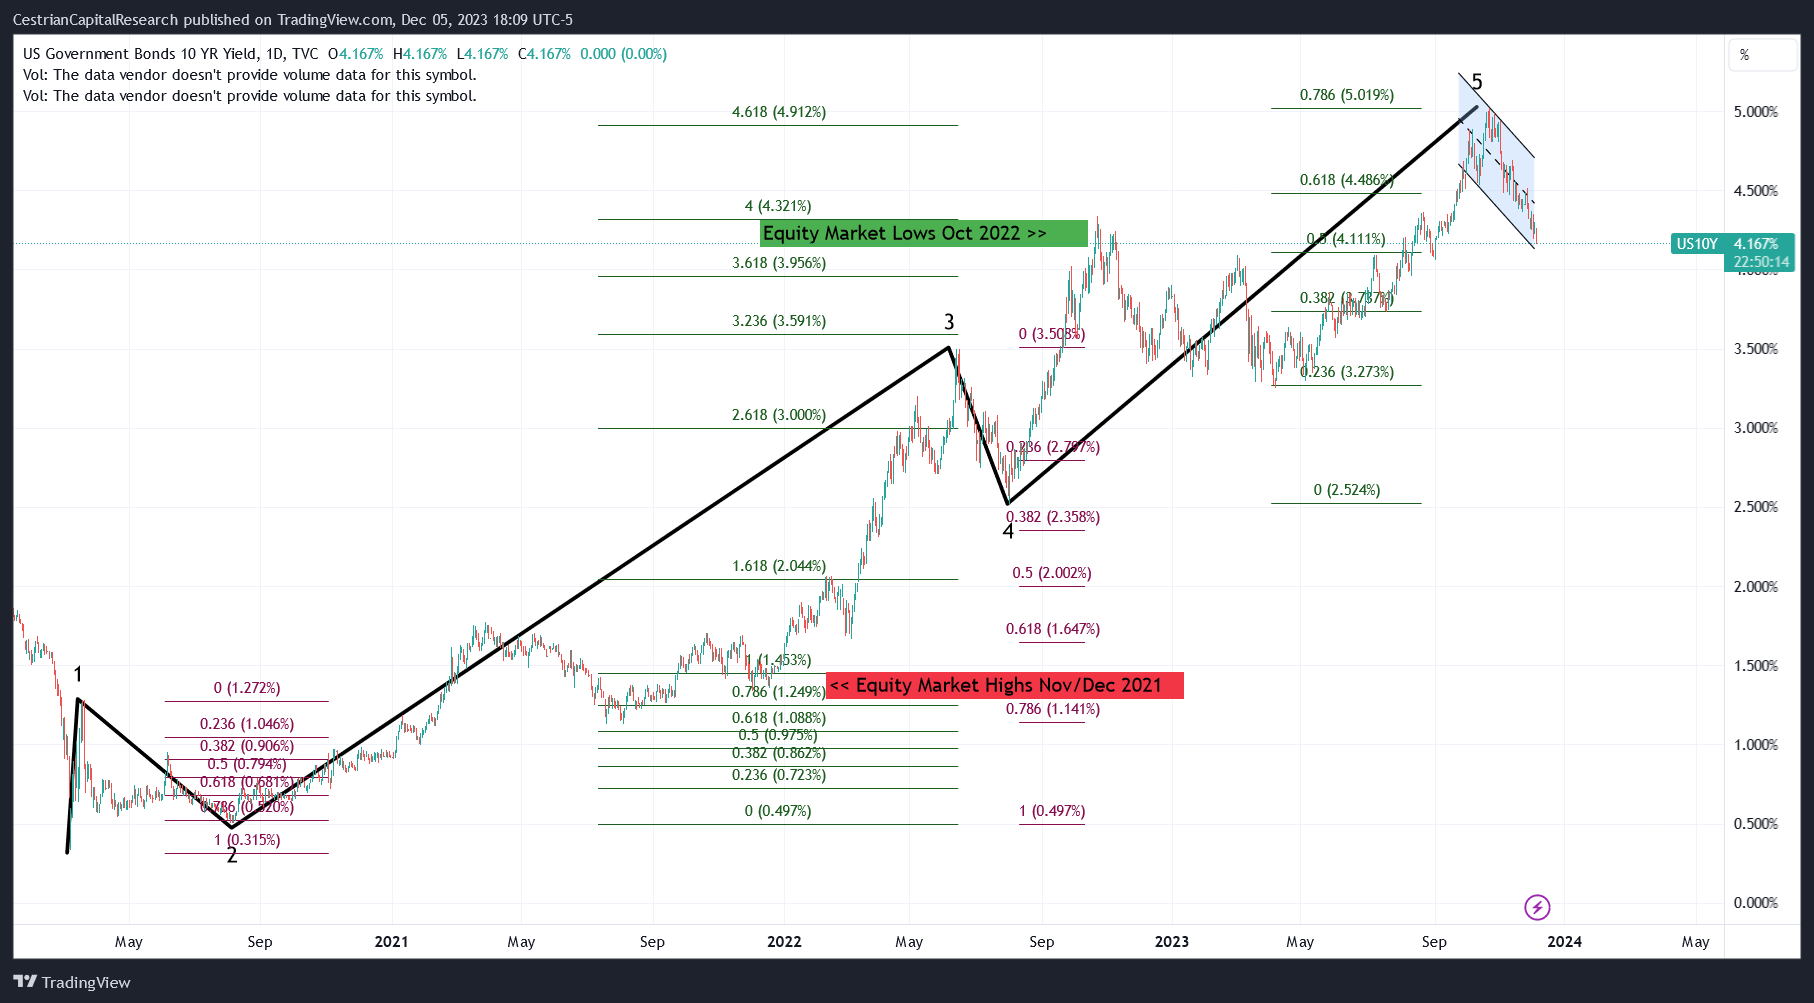
US 10-Year Yield
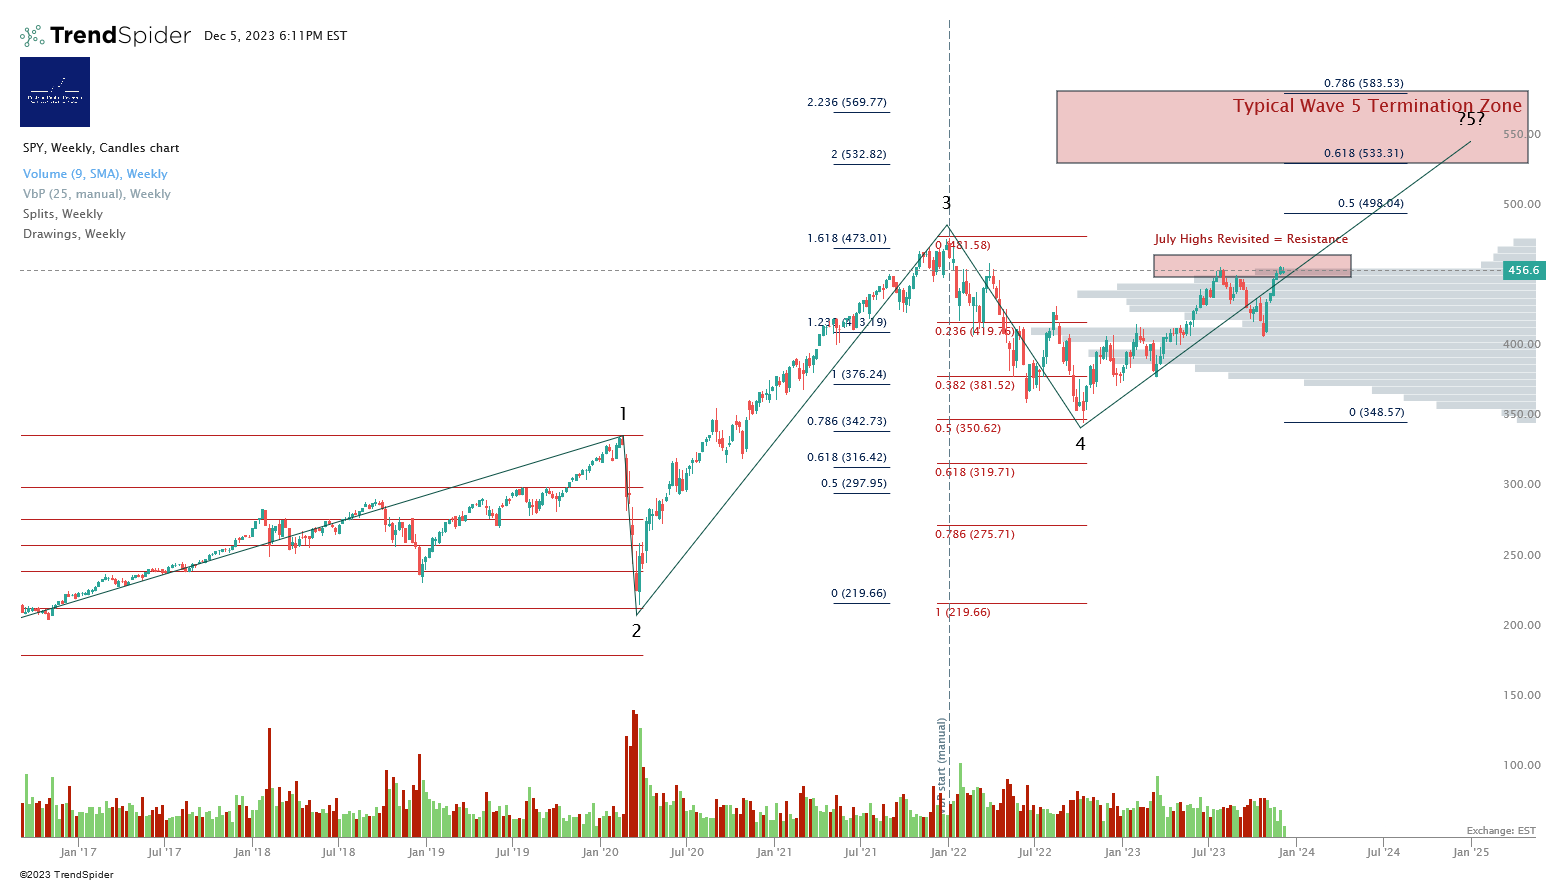
S&P500 / SPY / ES / UPRO
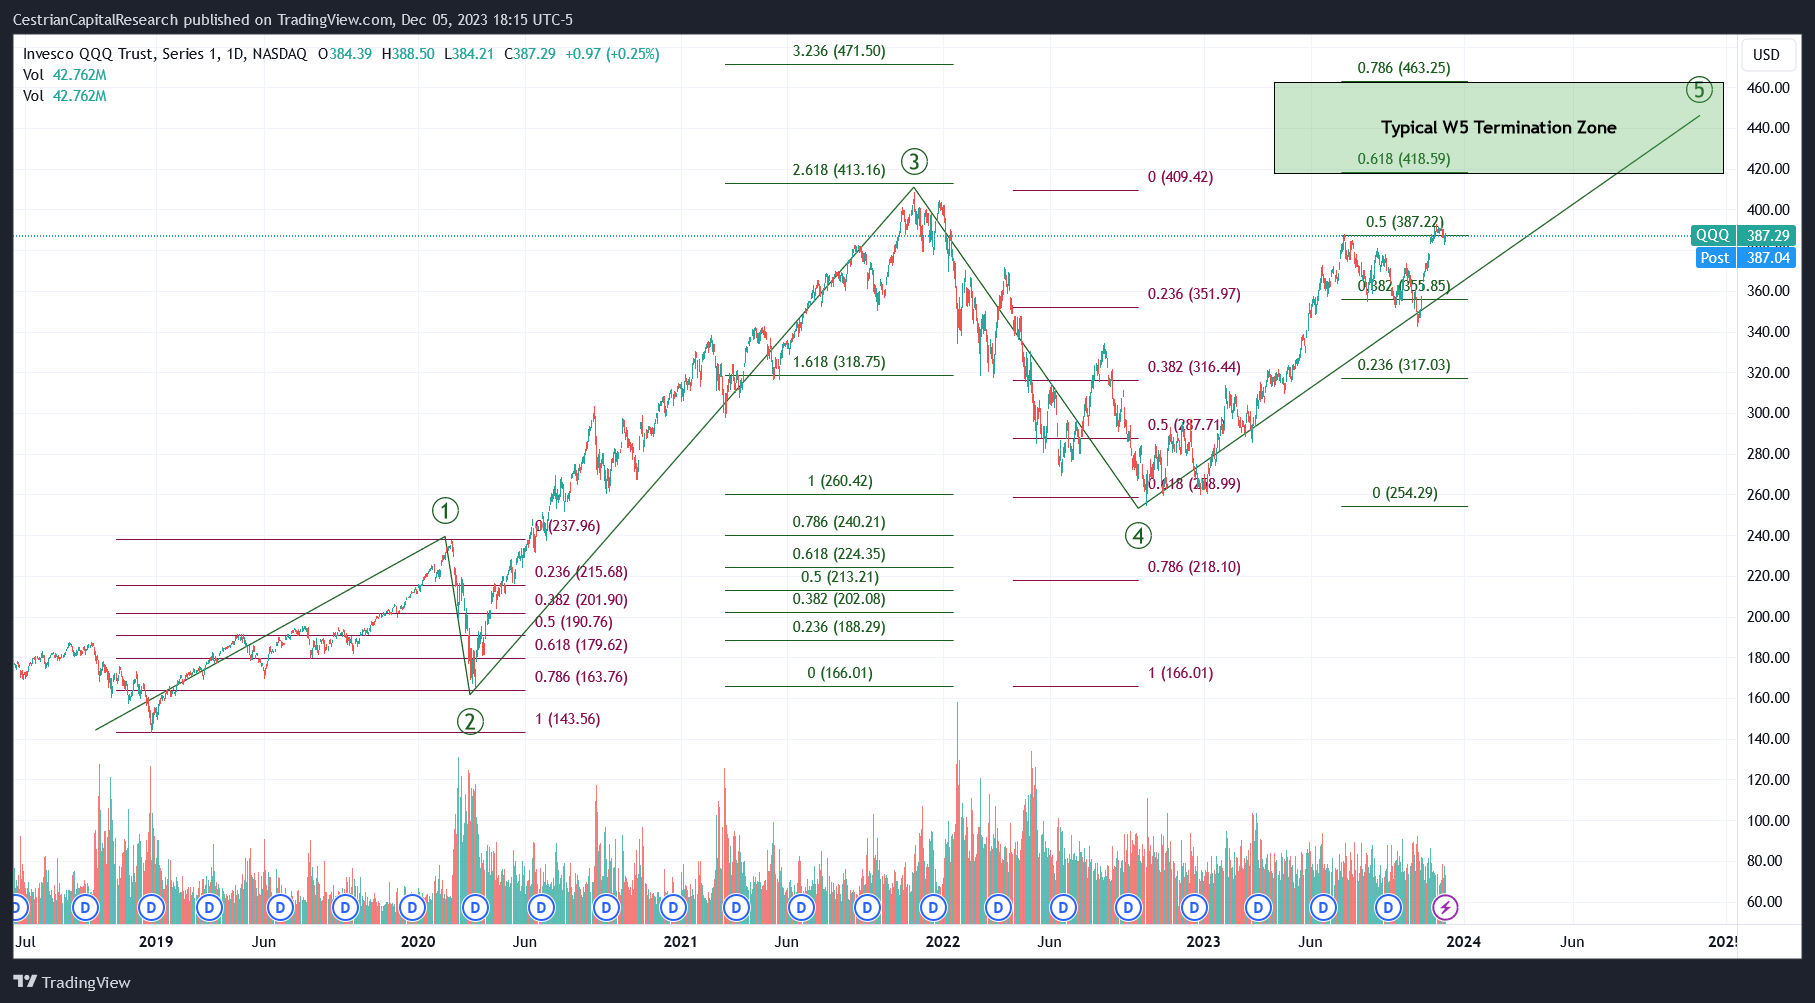
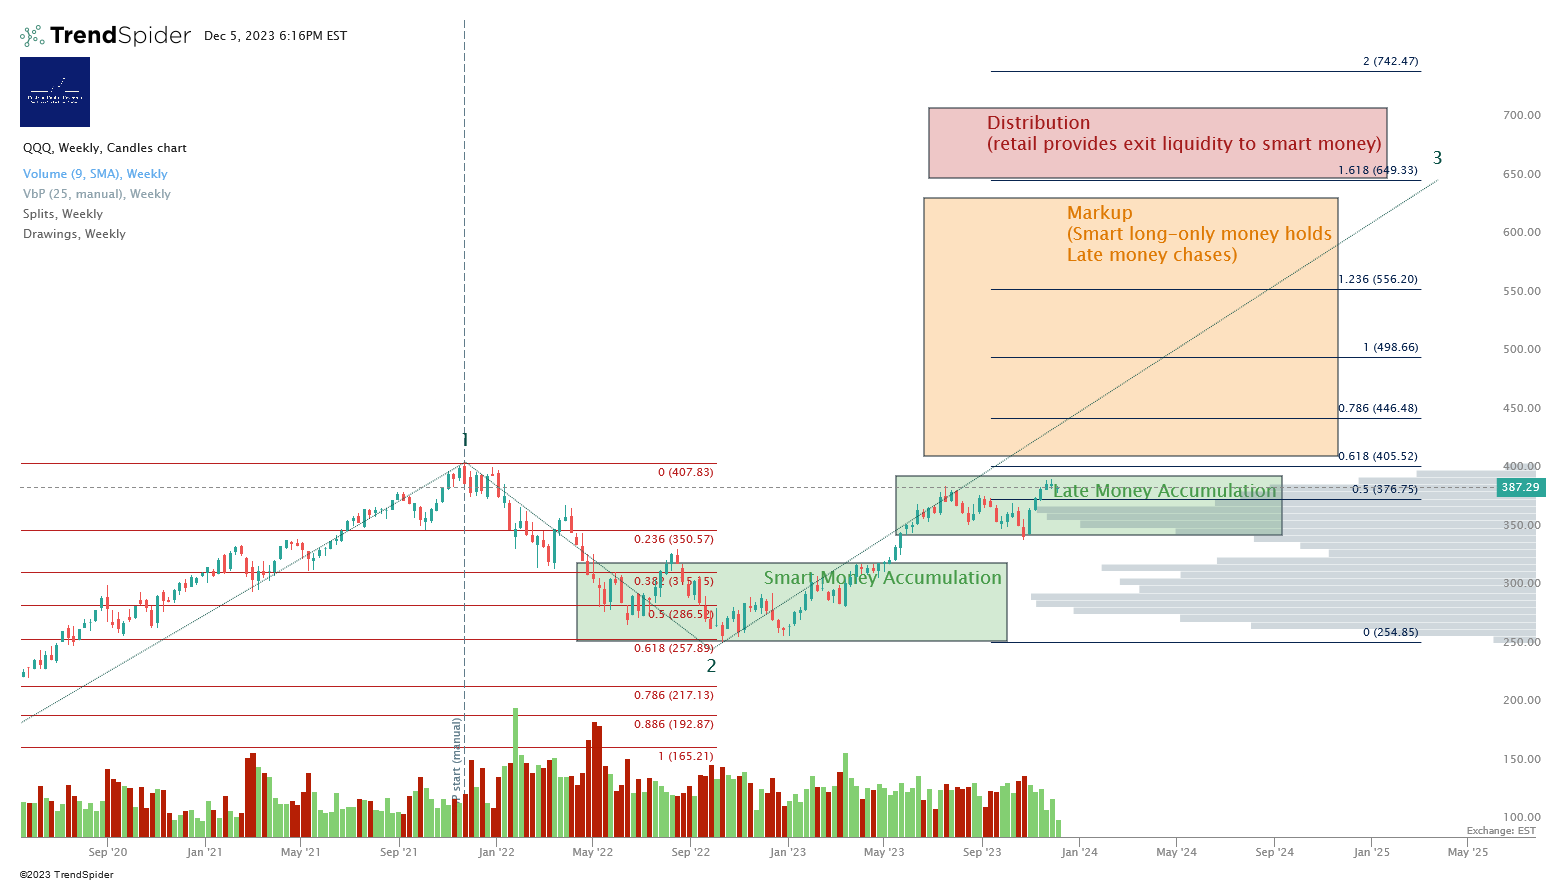
Nasdaq-100 / QQQ / NQ / TQQQ
No change to our larger-degree outlook. It will soon be time to test whether our base case is valid or too cautious.
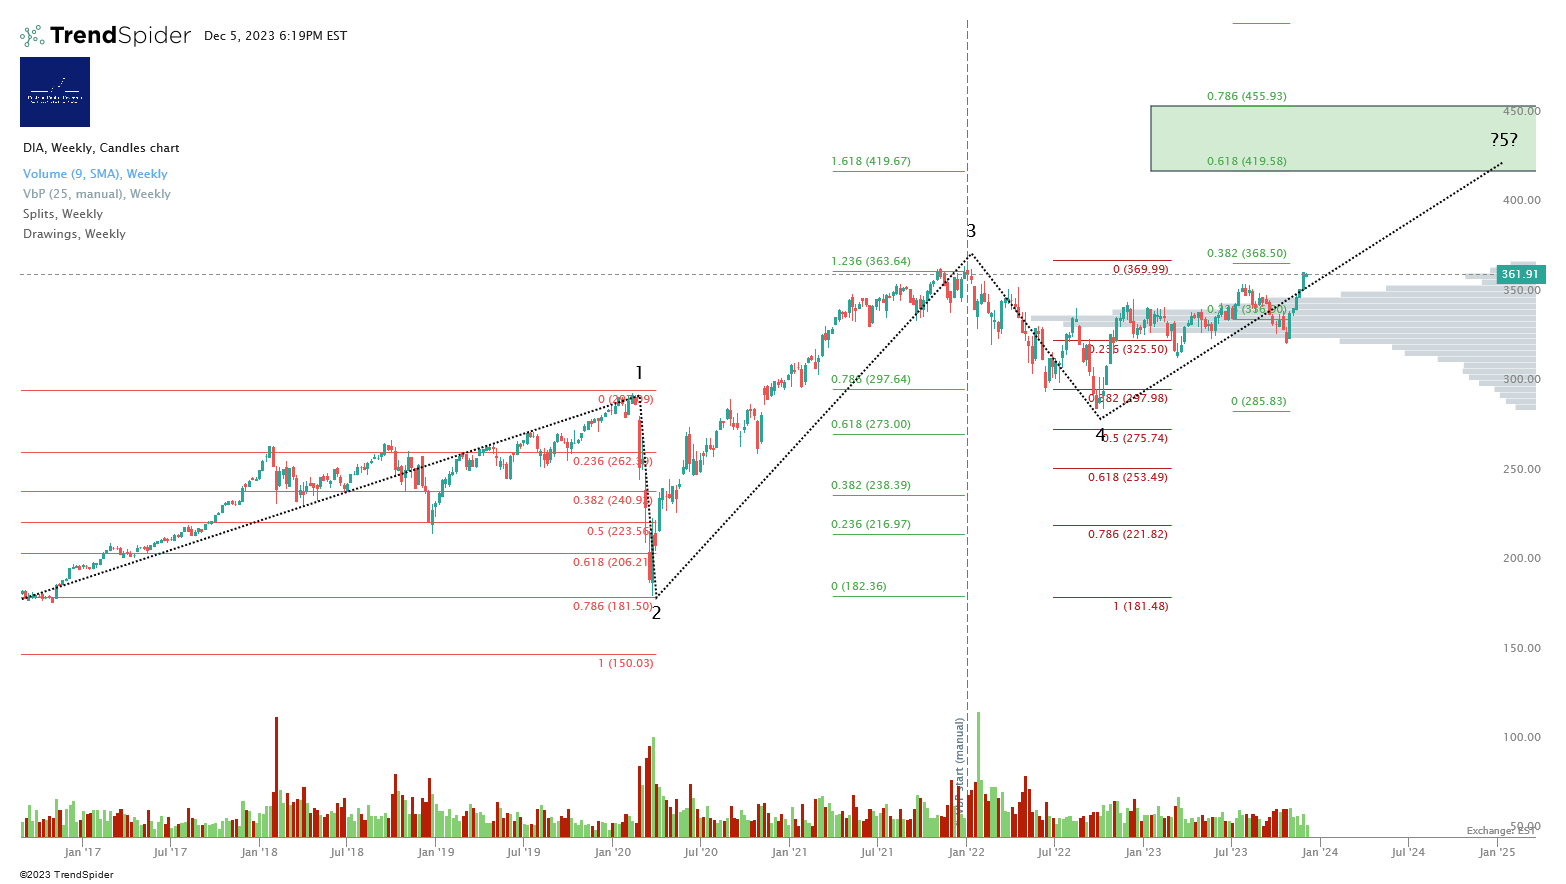
Dow Jones / DIA / YM / UDOW
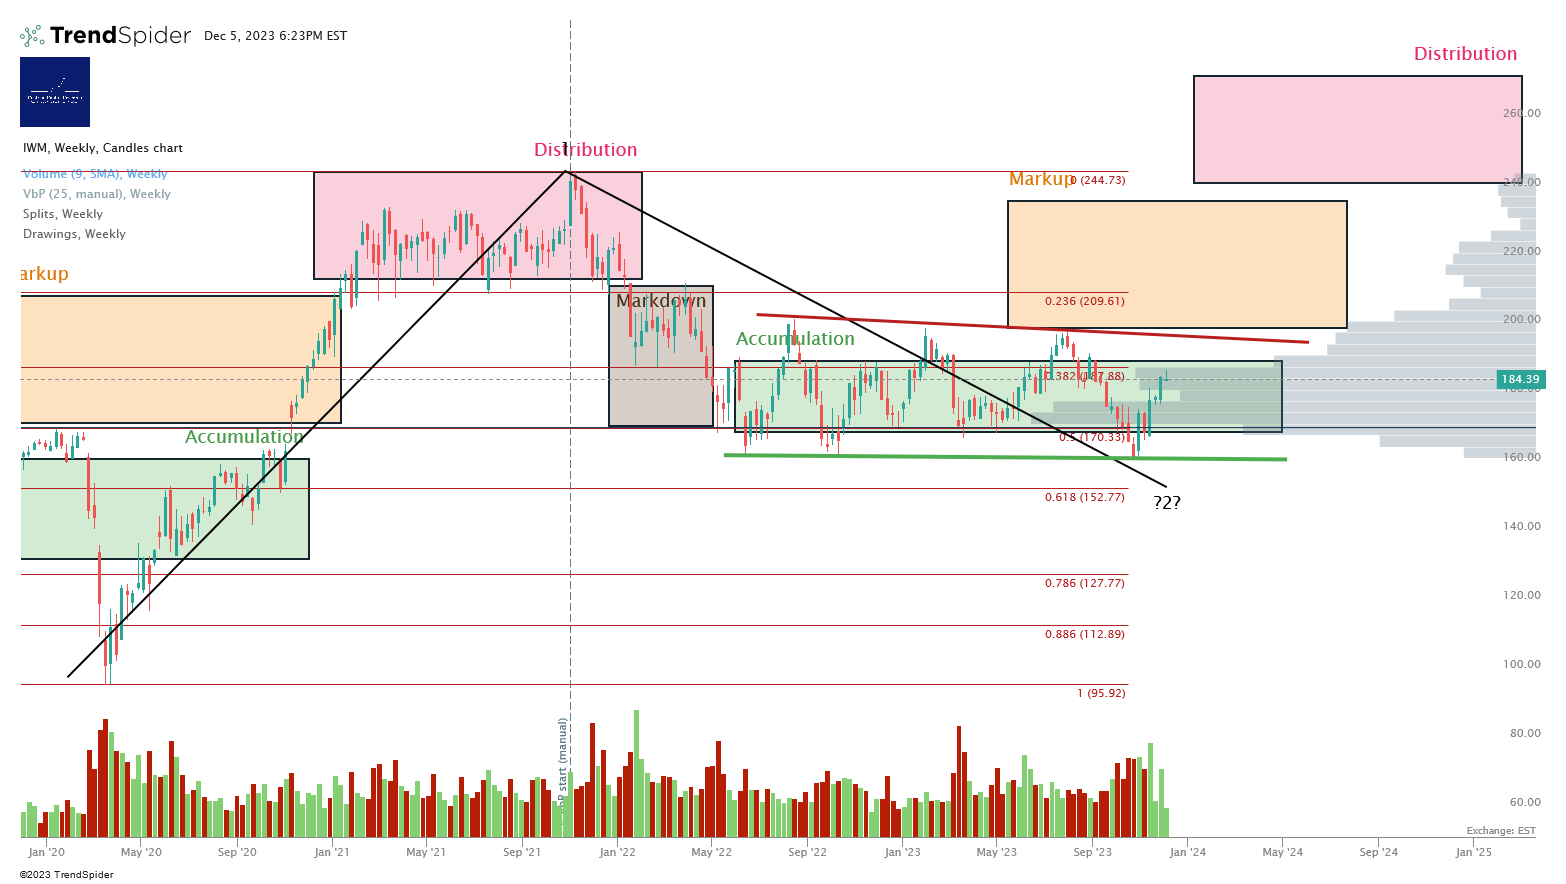
Russell 2000 / IWM / RTY / TNA
No change. Upside to $196, downside to $160.
Cestrian Capital Research, Inc - 5 December 2023.
DISCLOSURE - Cestrian Capital Research, Inc staff personal accounts hold long positions in, inter alia, UPRO, SPXU, TQQQ, SQQQ, UDOW, TNA