
Market On Open - Monday 25 September
DISCLAIMER: This note is intended for US recipients only and, in particular, is not directed at, nor intended to be relied upon by any UK recipients. Any information or analysis in this note is not an offer to sell or the solicitation of an offer to buy any securities. Nothing in this note is intended to be investment advice and nor should it be relied upon to make investment decisions. Cestrian Capital Research, Inc., its employees, agents or affiliates, including the author of this note, or related persons, may have a position in any stocks, security, or financial instrument referenced in this note. Any opinions, analyses, or probabilities expressed in this note are those of the author as of the note's date of publication and are subject to change without notice. Companies referenced in this note or their employees or affiliates may be customers of Cestrian Capital Research, Inc. Cestrian Capital Research, Inc. values both its independence and transparency and does not believe that this presents a material potential conflict of interest or impacts the content of its research or publications.
About Our 'Market On Open' Notes
These notes, published daily, form part of the Equity Index Strategy that we employ here in the Inner Circle service and, indeed, in Cestrian Capital Research, Inc staff personal accounts. You can read all about our Equity Index Strategy, here.
The Yield That Won't Quit
Normally at this point in our daily notes we keep it light. Especially on a Monday when everyone is just spooling up for the week. But here's the topic of the day, and it is rather dull, so, bear with us here.
If, big if, one can successfully chart the US Treasury 10-year yield using Elliott Waves and Fibonacci levels (which since the 2020 lows by the way, you can), then it's likely the yield is approaching a Wave 5 high. Wave 5s typically terminate somewhere between the .618 and the .786 extension of Wave 1+3 combined. Here's our 10-year yield chart.
US 10-Year Yield
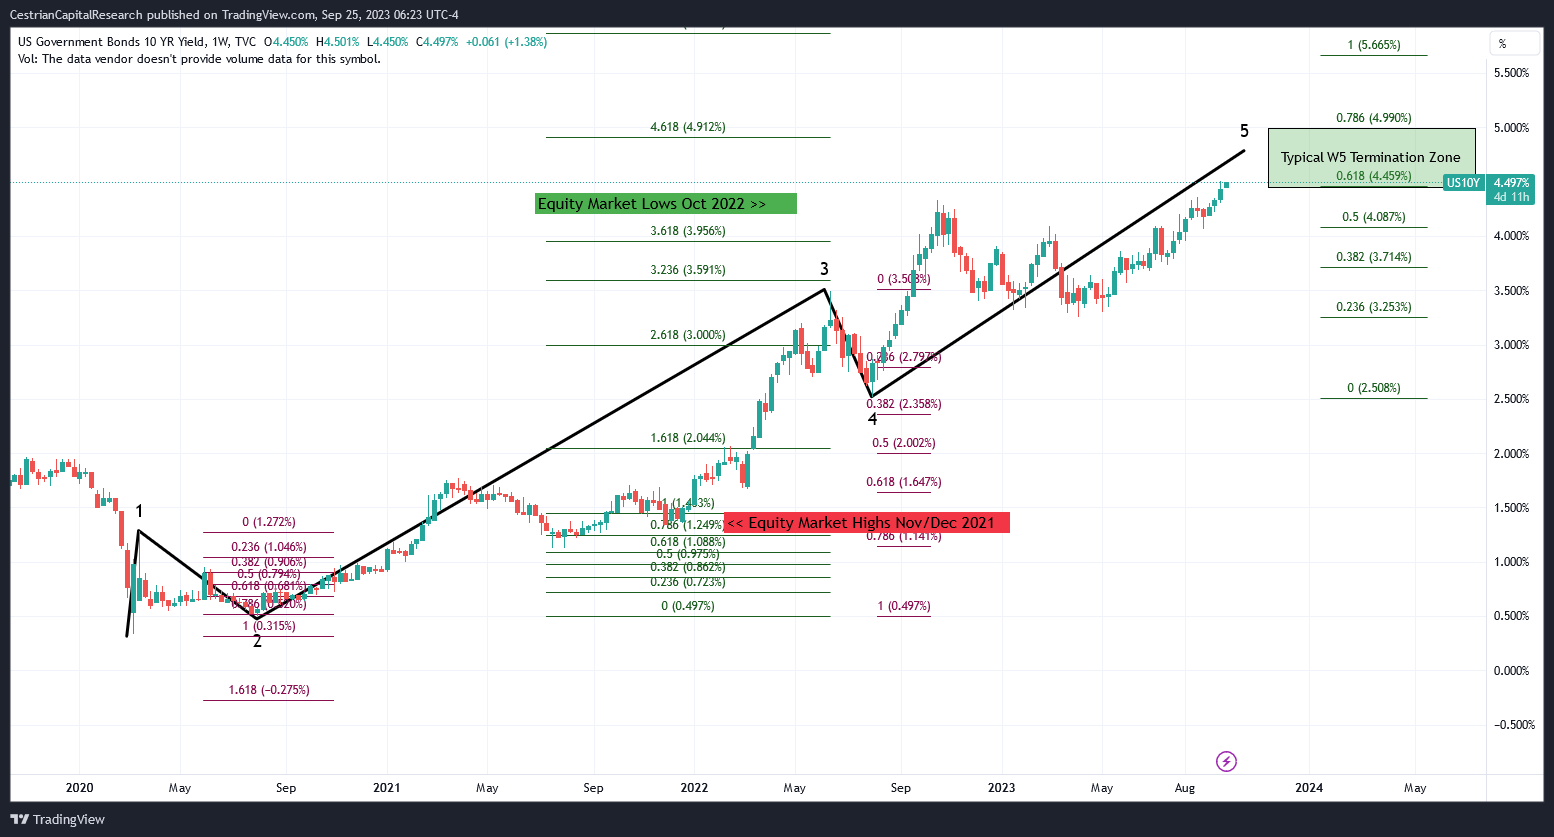
If this pattern holds true, and it might do, because the Wave 2 low above is a technically-perfect 78.6% retrace of the Wave 1, the Wave 3 is a technically-perfect 400% extension of Wave 1 placed at the W2 low, Wave 4 is a shallow .382 retrace after a deep W2 retrace (theory of alternation satisfied) and Wave 5 is already above the Wave 3 high and it has thus far found resistance at the .618 extension of Waves 1-3 combined, placed at the W4 low. Phew! If Elliott Waves aren't your thing then just trust us, that's a righteous chart. And if they are, then you can see our point here.
It might be that the yield has peaked, and if so, convention says that as yields fall, risk asset prices rise (yields down means bond prices up, and if bonds are being bought, so too are equities most likely). If the yield keeps pushing up we would be surprised to see it reach past 5% before a retrace, at least on this technical analysis.
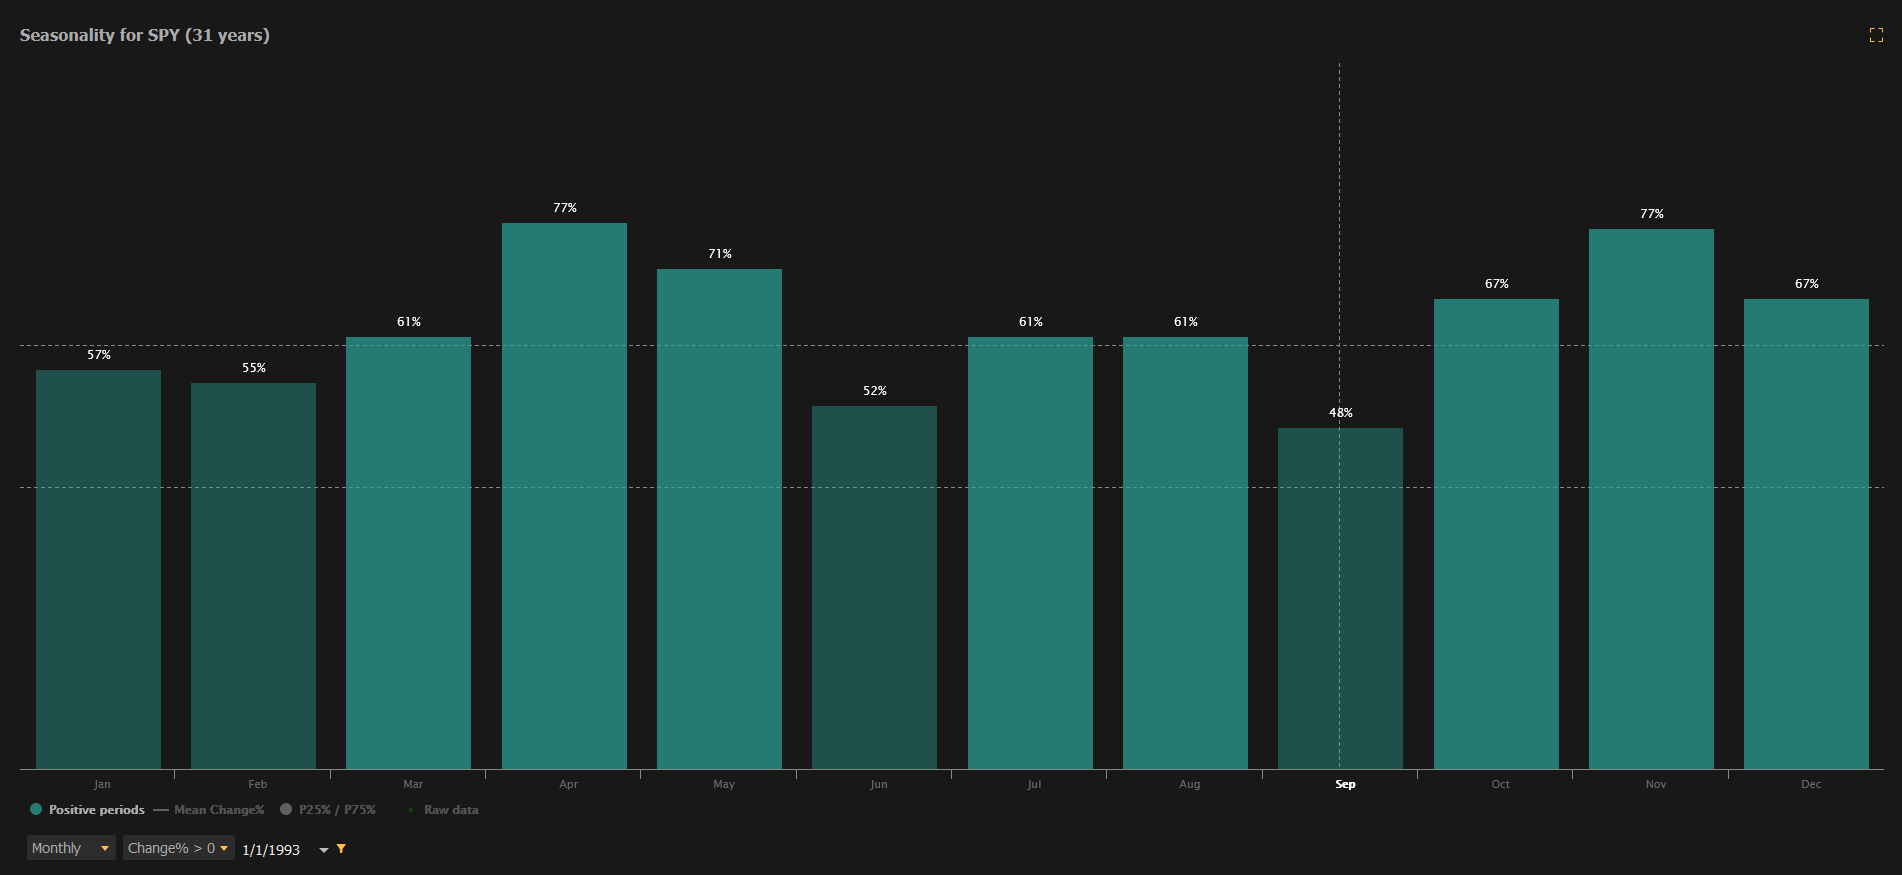
For now then we sit back. It seems to us that a reversal to the upside is due in equities. Looking at the S&P alone, over the last 30 years or so, September is more often a down month than an up month, and Q4 has historically been the most bullish quarter over that period.
Then you have the yield argument above; and you have the index charts also suggesting that a local low is close, as we shall see below.
So our best guess is that the next big move for equities is, up. As always reality will tell us what reality is going to look like. If the yield powers up through 5% and beyond then we likely have to reconsider; for now we wait.
And with that - we'll conclude with our usual refrain. If you've yet to join this Inner Circle service as a paying member, you can do so right from the button below. We're building up some wonderful testimonials, as you can see here. We hope to see you on the other side soon!