On The Launchpad?

The Trade Desk ($TTD) Q1 FY12/24 Earnings Review
DISCLAIMER: This note is intended for US recipients only and, in particular, is not directed at, nor intended to be relied upon by any UK recipients. Any information or analysis in this note is not an offer to sell or the solicitation of an offer to buy any securities. Nothing in this note is intended to be investment advice and nor should it be relied upon to make investment decisions. Cestrian Capital Research, Inc., its employees, agents or affiliates, including the author of this note, or related persons, may have a position in any stocks, security, or financial instrument referenced in this note. Any opinions, analyses, or probabilities expressed in this note are those of the author as of the note's date of publication and are subject to change without notice. Companies referenced in this note or their employees or affiliates may be customers of Cestrian Capital Research, Inc. Cestrian Capital Research, Inc. values both its independence and transparency and does not believe that this presents a material potential conflict of interest or impacts the content of its research or publications.
Why Boring Gray Bars Are Worth Studying
Amongst the many crushingly dull concepts embraced by ’technical analysis’ of stock prices (a label itself designed to deflect and offput, if you ask me - it’s not that hard, and it’s not that technical either) is the volume x price chart.
The gray bars you see on the right hand side of most of our charts are there to show you that over any specified time period (to the right of the dotted vertical line that defines time = 0) what has been the volume of shares traded in a particular price zone. Getting a feeling for what these mean can help you understand when bigs are buying, when selling, when defending a price, when letting price collapse, etc.
As regards The Trade Desk ($TTD) which just printed its Q1, the most interesting thing about the stock right now, at least to my eyes (and I am interested in some pretty dull stuff I can tell you), is the volume x price chart, because it looks very much to me like $TTD may be getting ready to rock and roll, sat as it is up and over the last high volume node that stands between today and the all time high.
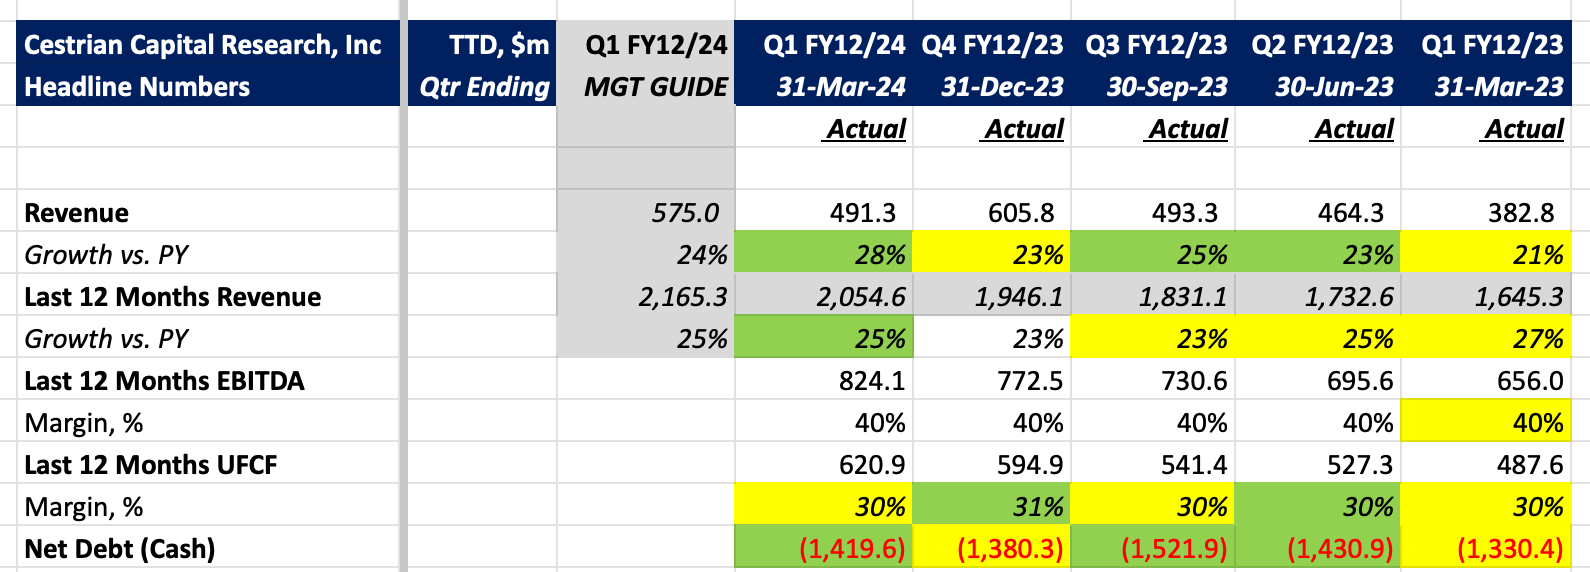
Below we lay out the headline numbers (before the paywall) and then take a look at the detailed financials, valuation analysis and our stock price projection, technical analysis and rating (after the paywall).
If you’re a free reader here, and you’d like to access the post-paywall stuff, you can sign up below either for our entry-level ‘Market Insight’ tier, or our full-monty ‘Inner Circle’ service. If you have any problems doing so, or you’d like to know more about what the pay services offer, you can reach us anytime using the contact form on this site, here.
The Trade Desk Headline Financials