
Two Tech Stock Recovery Ideas

DISCLAIMER: This note is intended for US recipients only and, in particular, is not directed at, nor intended to be relied upon by any UK recipients. Any information or analysis in this note is not an offer to sell or the solicitation of an offer to buy any securities. Nothing in this note is intended to be investment advice and nor should it be relied upon to make investment decisions. Cestrian Capital Research, Inc., its employees, agents or affiliates, including the author of this note, or related persons, may have a position in any stocks, security, or financial instrument referenced in this note. Any opinions, analyses, or probabilities expressed in this note are those of the author as of the note's date of publication and are subject to change without notice. Companies referenced in this note or their employees or affiliates may be customers of Cestrian Capital Research, Inc. Cestrian Capital Research, Inc. values both its independence and transparency and does not believe that this presents a material potential conflict of interest or impacts the content of its research or publications.
How To Know When To Buy?
By Abhishek Singh
If you read our work — free or paid — you know two things:
1.) We do not swear by any single approach to making money in the market – neither the true fundamentalist standpoint that views technical analysis as merely scribbling a few lines on paper, nor a technical analysis purist view that disregards company financial indicators such as revenue growth, RPO, etc. Instead, we try to bring these methods together in the hope of following the breadcrumb trail left by Big Money. In short, we use fundamentals plus a combination of Elliott Wave counts, Fibonacci Retracement and Extension measurements, and Wyckoff rotation by way of volume x price analysis. You can read all about our method in our (no paywall) “How To Speak Market” series of notes, here.
2.) Unless and until a major change in sentiment takes place, we remain in a bull market in our view. Why do we think so? Because prices are going up. In our work we ignore what the talking heads on TV say and the ruminations of social media geniuses. We believe the best approach is to just observe price action and strategize accordingly.
With this context, here are two long ideas you could factor into your own work. We can be right or wrong, of course, but each of the two picks we are sharing today we rate at “Accumulate”. We believe each has the potential to provide material gains. We also believe each is close enough to a sensible stop-loss placement that one can control risk fairly effectively if one chooses to. By way of disclosure, we own these two names in staff personal accounts.
Yet to sign-up for a Cestrian Capital Research subscription? You can choose one of the following:
Market Insight: our entry-level subscription. You get daily market analysis note, and you get earnings analysis on each of the 60+ single stock names we cover (the count is rising all the time we may add). Market Insight prices rise 1 June — sign up before then if you want to lock in the current low rates.
Inner Circle Membership: This includes everything in Market Insight plus additional premium features. You get access to a live chat environment with our analysts and a vibrant investor and trader community, weekly live webinars with an open-mic ask-us-anything format, real-time trade disclosure alerts whenever Cestrian staff personal accounts place trades in covered stocks and ETFs (including long/short hedging), model portfolios, and much more.
Now to those two tech stock recovery ideas.
1. Intel Corporation ( $INTC )
After tripping over its own shoelaces twice in its prior area of skill, namely manufacturing excellence – specifically, failing to navigate the shift to 10nm and 7nm node sizes - and lacking a presence in the GPU category that has powered Nvidia’s ascent, Intel stock took a beating from before the 2022 bear market started until October of that year. In our Inner Circle service we had success calling the bottom in INTC stock and riding it up through 2023 – in staff personal accounts we banked very solid gains as a result. Misery has since set in once more! But the slow-burn indicators of fundamentals have started to show an improving trend (read our latest detailed earnings analysis here: Intel Q1 FY12/24 Earnings Analysis). However, this turnaround story will not be written overnight under the guidance of a relatively new CEO. Remember we are talking about a $55 billion revenue business here. We show the last five quarters’ headline numbers, and the upcoming quarter management guide, below.
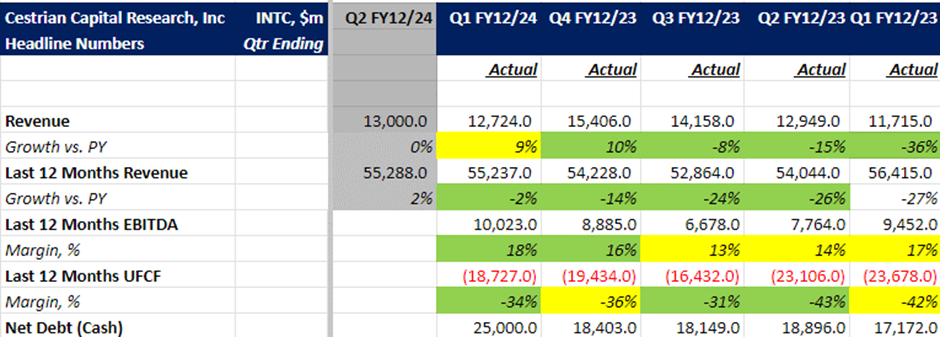
We believe Intel will be a key chess piece in the US government’s efforts to reinforce America’s semiconductor industry.
Technical analysis: The stock has put in an Elliot impulse Wave 1 from Feb–Dec’23 followed by a 78.6% retracement of the prior wave. This is a key Fibonacci level which has held firm for the past four weeks. Also, note the high volume nodes in the Accumulation zone as indicated by Volume by Price bars on the right-hand side of the chart. You can open the full page chart by clicking here.
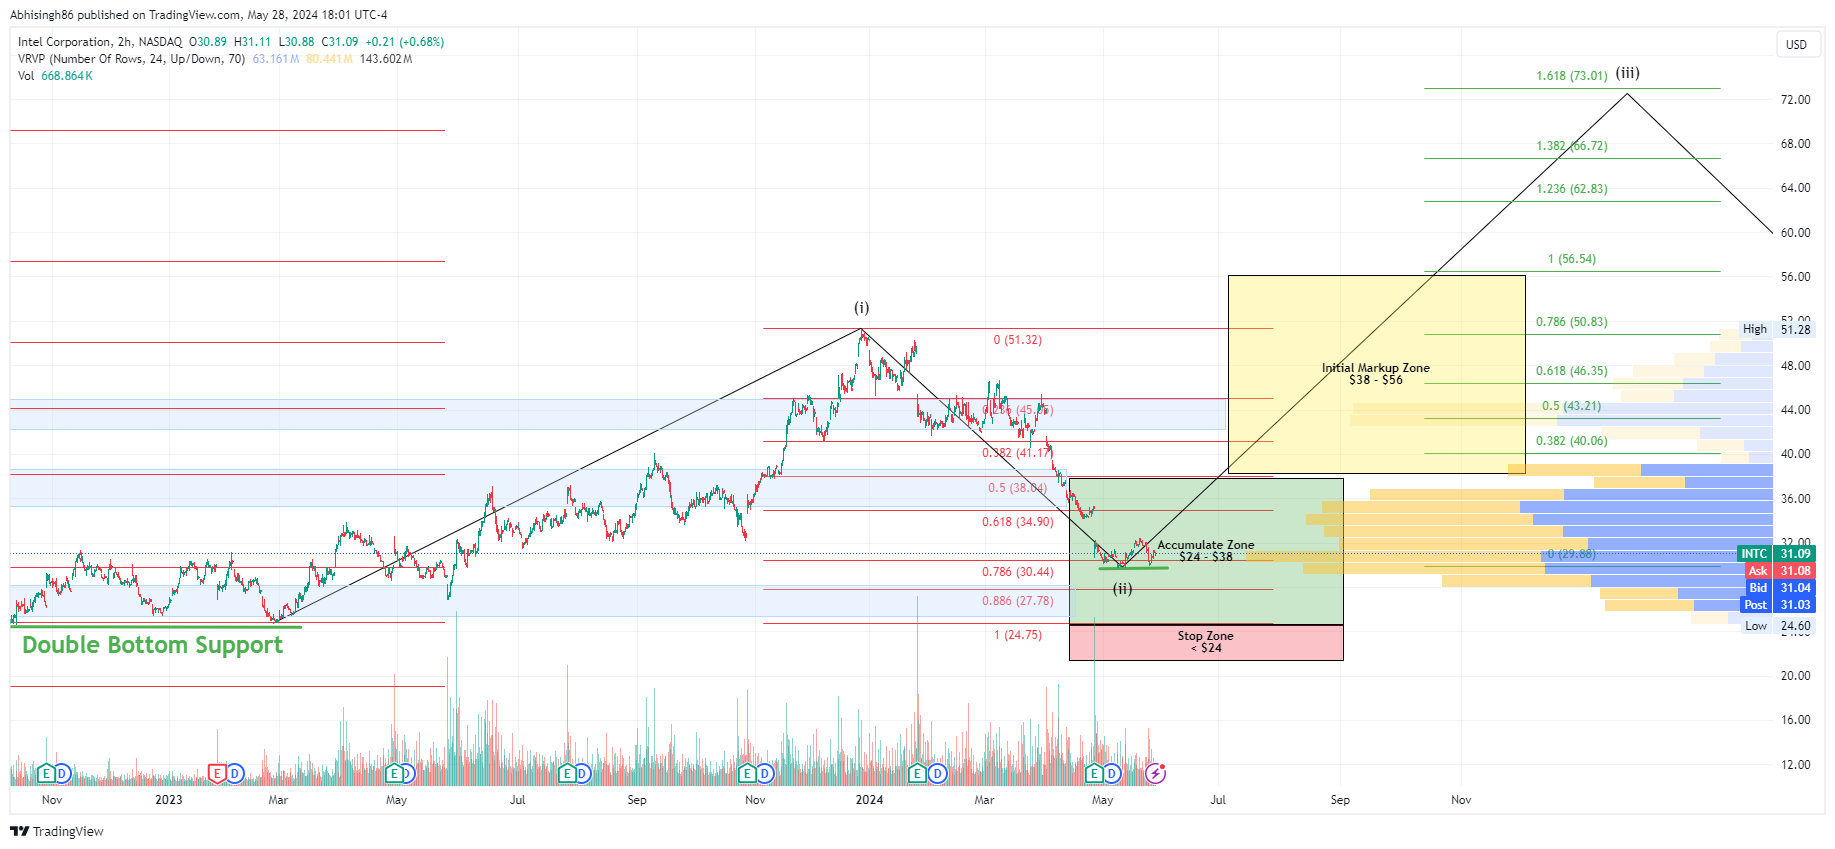
Rating: Accumulate
· Stop Zone: < $24
· Accumulation Zone: $24- $38
· Initial Markup Zone: $38 - $56
· Typical Wave 3 target : $73
2. Snowflake ( $SNOW )
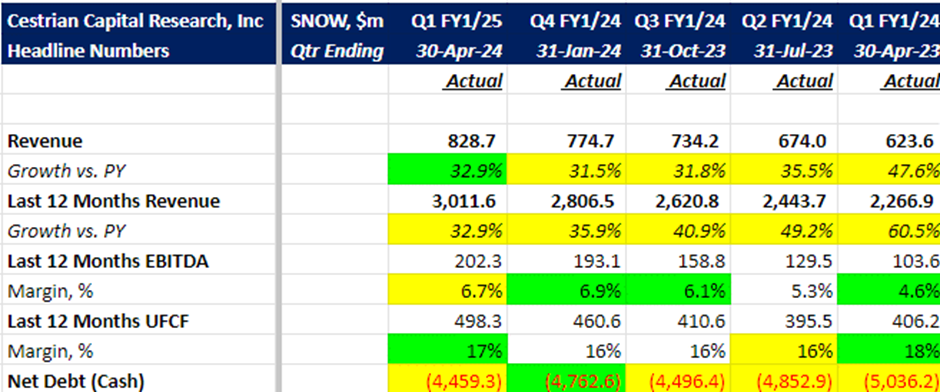
After its much-publicized IPO the stock plunged from post-IPO highs of $406 to $107 in a matter of seven months. A new CEO in combination with stabilizing fundamentals leads us to have a cautiously positive outlook on this company. Remaining Performance Obligation—the total book of orders placed but yet to be fulfilled – saw accelerating growth in the last quarter. You can’t read across directly from accelerating RPO growth to accelerating revenue growth, but it is certainly a step in right direction in our view (read our detailed earnings analysis here: Snowflake Q1 FY1/25 Earnings Analysis).
Technical analysis: Following the post IPO plunge, beginning from June’22, the stock put in a Elliot impulse Wave 1 up to $205, followed by a very deep corrective Wave 2 which retraced approximately 88.6% of the prior move. The stock currently appears to be in a Wave 3 impulse, and Fibonacci extension of Wave 1 placed at the Wave 2 low provides a price target of $272. Again, note the high volume nodes in the Accumulation zone. You can open the full page chart by clicking here.
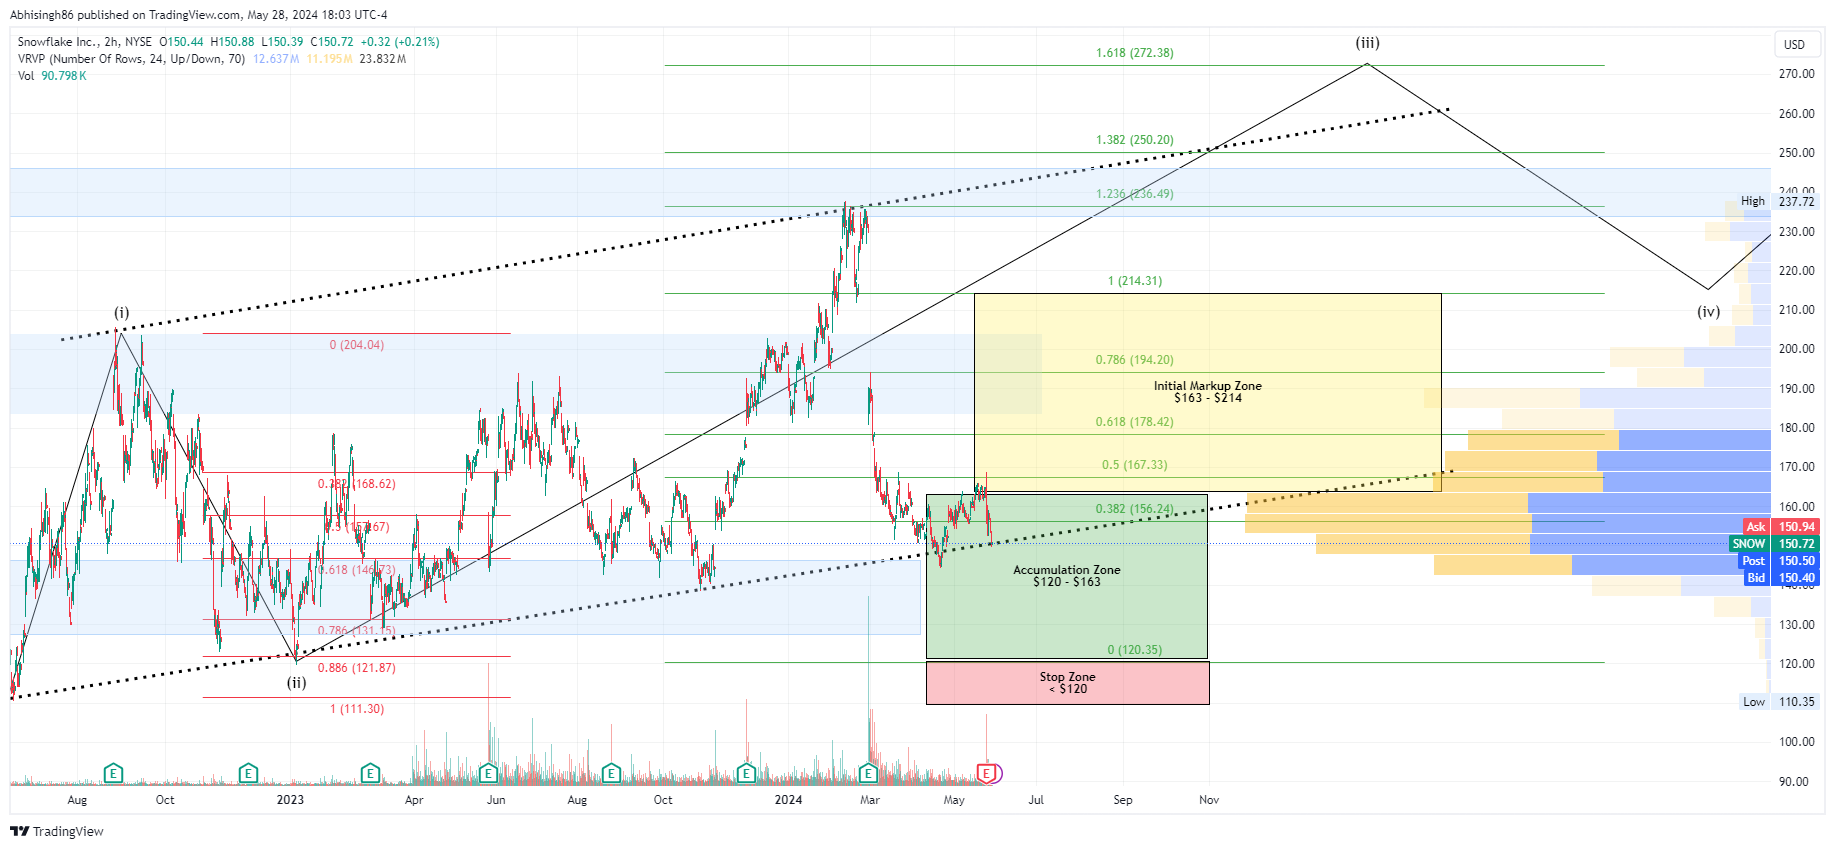
Rating: Accumulate
· Stop Zone: < $120
· Accumulation Zone: $120- $163
· Initial Markup Zone: $163 - $214
· Typical Wave 3 target: $272.
A word about our charts
· The dollar limits within the Wyckoff zones serve as guidelines rather than strict rules. They aid in maintaining disciplined buying and selling decisions, removing emotional impulses from the equation. The idea is to identify where the bulk of buying (at the lows) and selling (at the highs) is taking place; this is an inexact science but it is a useful way of trying to track those Big Money breadcrumbs.
· The blue zones in the charts are the key support/resistance levels based on historical price action. We do not approach resistance and support levels as single $$ values. Instead, we view them as price action areas that need to be materially breached in either direction to confirm a trend.
· Zone boundaries may evolve over time, adjusted according to evolving price dynamics, Elliott wave analysis, Fibonacci levels, and volume-by-price data. Once the stock approaches the upper limit of the mark-up zone, we would revisit if the target price needs to be adjusted.
Resources to Learn How To Speak The Market (No Paywall)
1. How Big Money Creates Returns Out Of Thin Air
2. How To Speak Market, Episode II - Measuring Emotion
3. How To Speak Market, Episode III - Swimming With The Tide
4. How To Speak Market, Episode IV - Charts Speak Volumes
Questions?
If you have questions about any of the numbers, charts, anything, reach out in chat.
Cestrian Capital Research, Inc - 28 May 2024.
DISCLOSURE - Cestrian Capital Research, Inc staff personal accounts hold long position(s) in INTC, SNOW, NVDA and others.